In today’s competitive job market, organizations invest heavily in apprenticeship programs to develop skilled talent. However, managing apprentices, tracking training performance, monitoring costs, and analyzing placement outcomes can quickly become complex.
Many HR teams and training managers still rely on multiple spreadsheets. As a result, they struggle to track progress, identify gaps, and make data-driven decisions.
That’s exactly where the Apprenticeship Programs Dashboard in Excel becomes a powerful solution. 🚀
This ready-to-use dashboard helps you monitor apprentices, analyze performance, control costs, and track placement outcomes—all in one place. Moreover, it transforms raw data into clear and interactive insights, so you can make smarter decisions faster.
In this detailed guide, you will learn everything about this dashboard, including its features, structure, advantages, best practices, and FAQs.
Click to Purchases Apprenticeship Programs Dashboard in Excel
🤔 What is an Apprenticeship Programs Dashboard in Excel?
An Apprenticeship Programs Dashboard in Excel is an interactive reporting tool designed to track and analyze apprenticeship program performance using charts, KPIs, and data tables.
Instead of managing multiple files, you can centralize all your apprenticeship data into one dashboard. Therefore, you save time, reduce errors, and improve efficiency.
This dashboard helps you track:
-
👨🎓 Total Apprentices
-
💰 Training Cost & Stipend Amount
-
📊 Performance & Satisfaction Scores
-
🎯 Placement Status & Outcomes
-
📍 Regional and Departmental Insights
-
📅 Monthly Trends
Because Excel provides flexibility and automation, the dashboard updates automatically when you input new data.
🚀 Why Do You Need an Apprenticeship Dashboard?
Managing apprenticeship programs without a structured system creates several challenges. However, a dashboard simplifies everything.
✅ Key Reasons to Use This Dashboard:
-
It centralizes all apprenticeship data
-
It improves training performance tracking
-
It helps control program costs
-
It enhances placement analysis
-
It supports faster decision-making
As a result, organizations can improve both training quality and employment outcomes.
🧩 Key Features of Apprenticeship Programs Dashboard in Excel
This dashboard includes 5 interactive pages, each designed for specific analysis. Additionally, it features a Page Navigator on the left side for easy navigation.
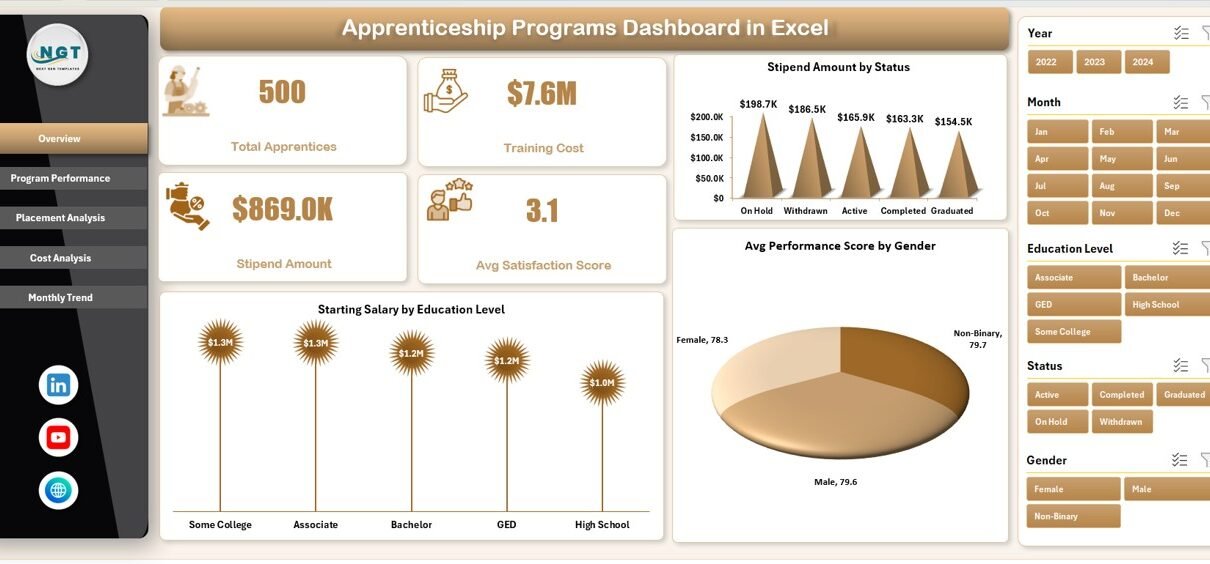
📌 1. Overview Page – Quick Snapshot of Program Performance
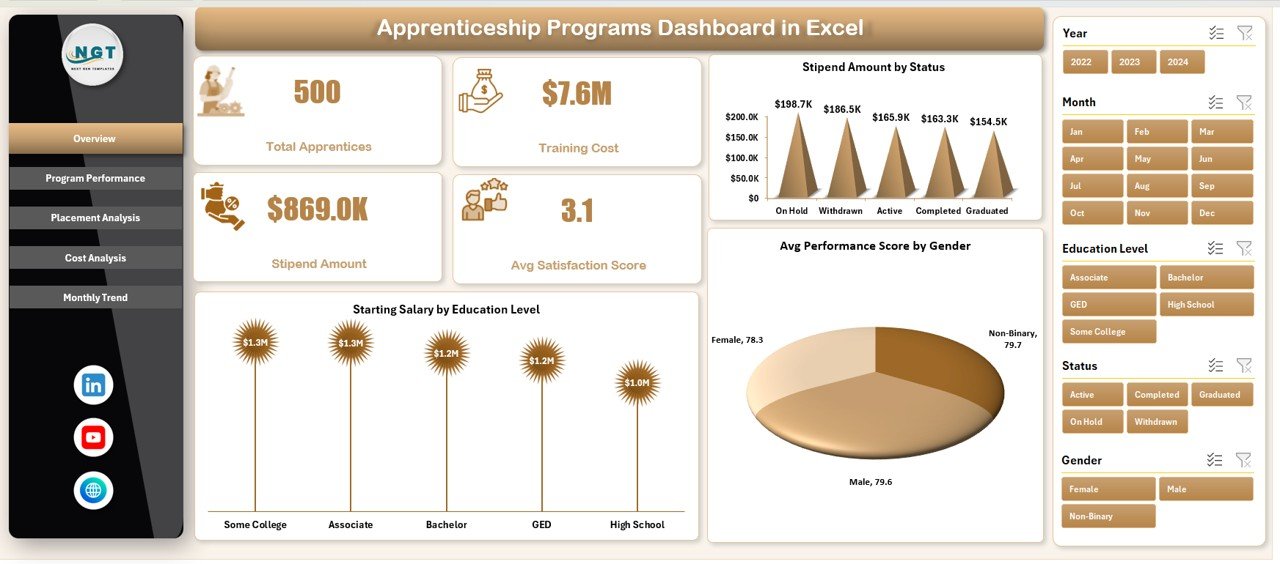
The Overview Page gives you a high-level summary of your apprenticeship program.
🔹 KPI Cards:
-
👨🎓 Total Apprentices
-
💰 Training Cost
-
💵 Stipend Amount
-
⭐ Avg. Satisfaction Score
📊 Charts:
-
Stipend Amount by Status
-
Starting Salary by Education Level
-
Avg. Performance Score by Gender
👉 Therefore, this page helps you understand overall performance at a glance.
📈 2. Program Performance – How Well Are Your Programs Running?
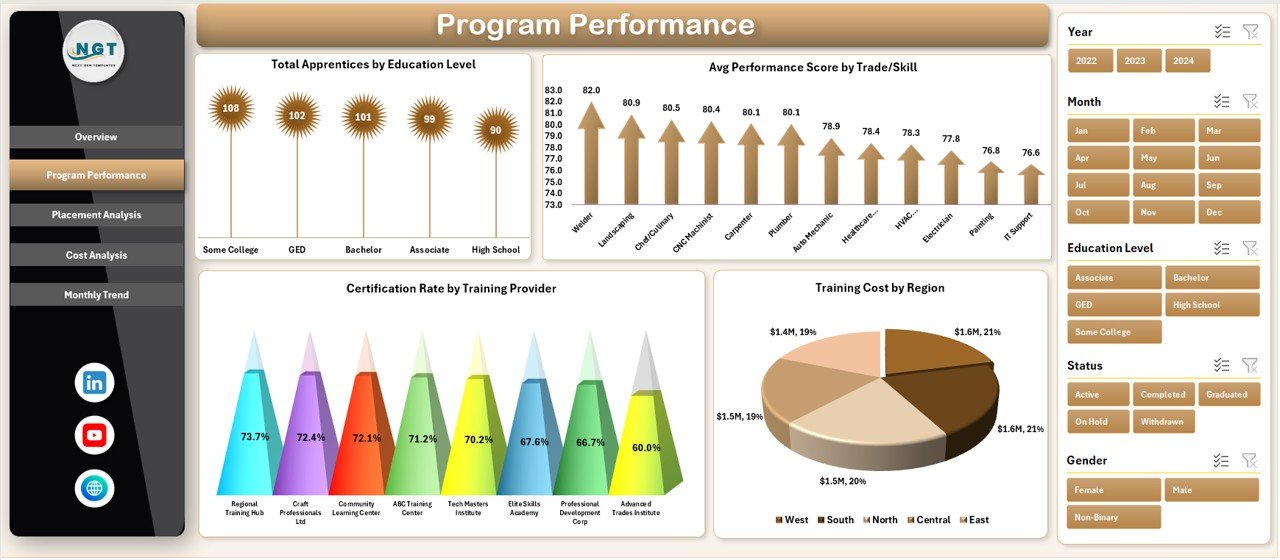
This page focuses on training effectiveness and performance.
📊 Charts Included:
-
Total Apprentices by Education Level
-
Avg. Performance Score by Trade/Skill
-
Certification Rate by Training Provider
-
Training Cost by Region
👉 As a result, you can identify high-performing programs and areas that need improvement.
Click to Purchases Apprenticeship Programs Dashboard in Excel
🎯 3. Placement Analysis – Are Apprentices Getting Jobs?
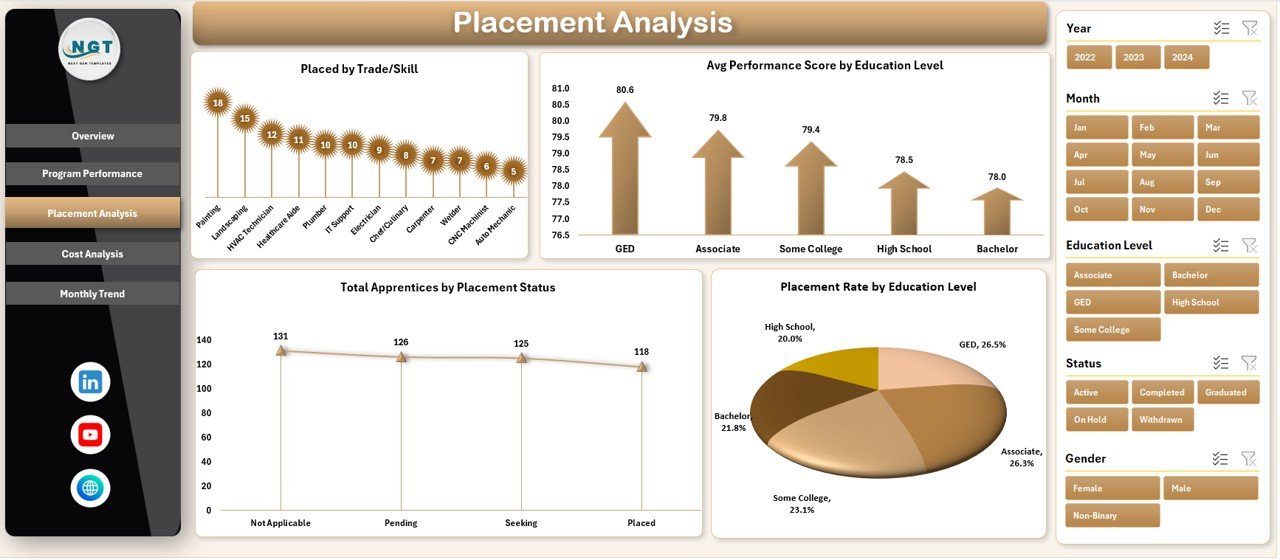
The Placement Analysis Page evaluates employment outcomes.
📊 Charts Included:
-
Placed by Trade/Skill
-
Avg Performance Score by Education Level
-
Total Apprentices by Placement Status
-
High Risk Rate by Region
👉 Therefore, you can track placement success and identify risk areas.
💰 4. Cost Analysis – Where Is Your Budget Going?
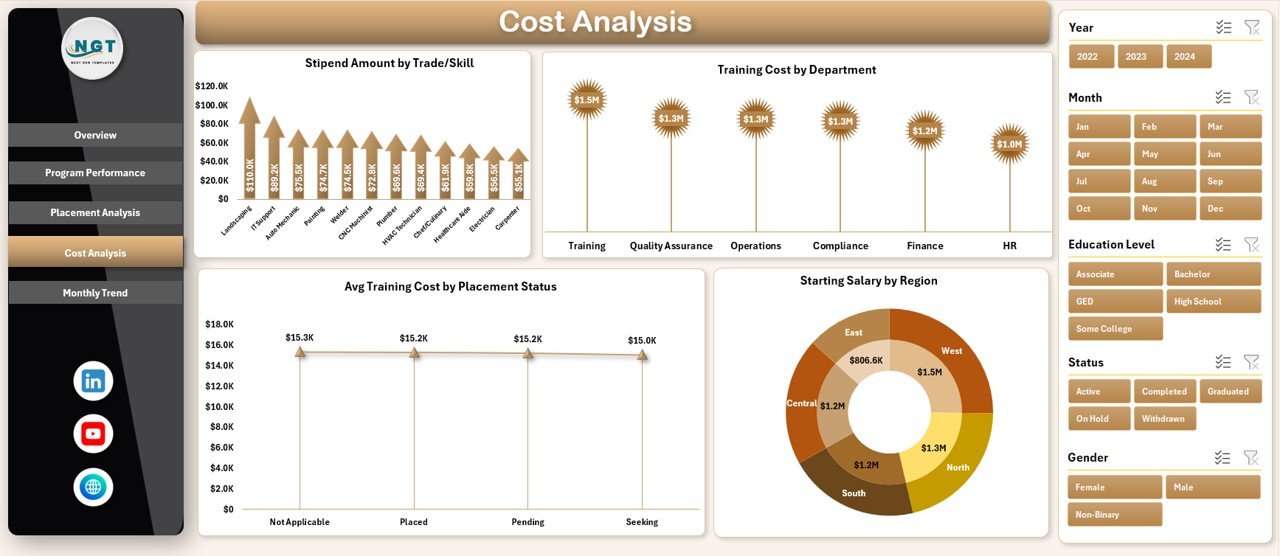
This page helps you monitor and control costs.
📊 Charts Included:
-
Stipend Amount by Trade/Skill
-
Training Cost by Department
-
Avg Training Cost by Placement Status
-
Starting Salary by Region
👉 As a result, you can optimize spending and improve ROI.
📅 5. Monthly Trends – Track Progress Over Time
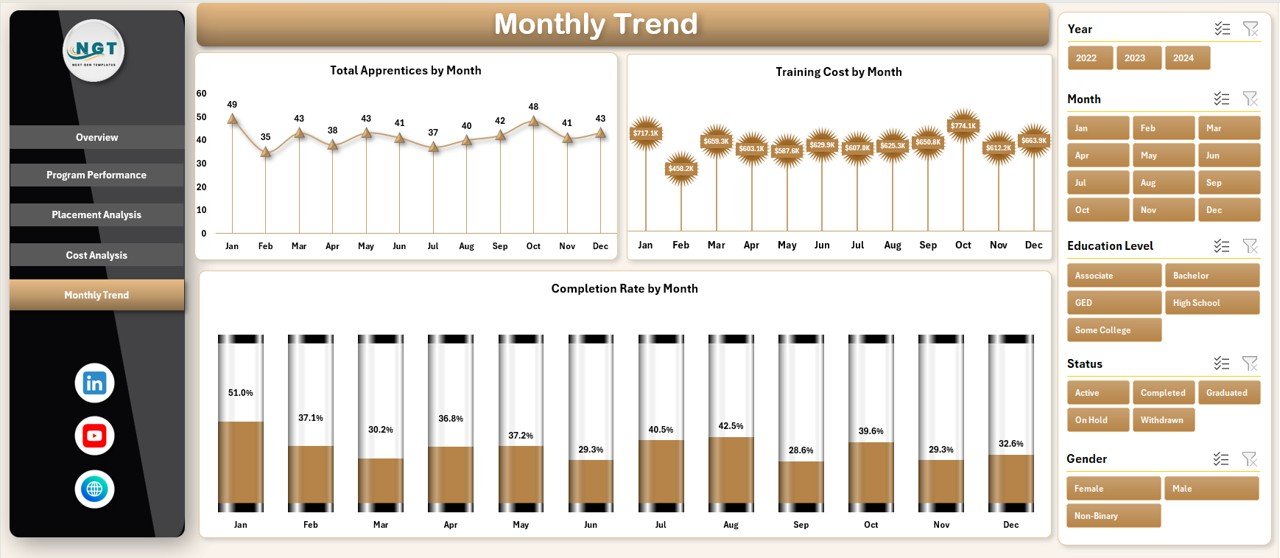
The Monthly Trends Page helps you analyze trends.
📊 Charts Included:
-
Total Apprentices by Month
-
Training Cost by Month
-
Completion Rate by Month
👉 Therefore, you can monitor growth and identify seasonal patterns.
🌟 Advantages of Apprenticeship Programs Dashboard in Excel
Using this dashboard provides multiple benefits.
💡 Key Advantages:
-
Centralized Data Management
You manage everything in one place. -
Improved Decision Making
You get clear insights to act quickly. -
Better Cost Control
You track training and stipend expenses effectively. -
Enhanced Performance Monitoring
You evaluate apprentice progress easily. -
Time-Saving Solution
You reduce manual work and errors. -
Easy Customization
You can modify it based on your needs.
⚙️ How to Use the Apprenticeship Programs Dashboard?
Using this dashboard is simple and user-friendly.
📌 Step-by-Step Guide:
-
Enter Data in Data Sheet
Input apprentice, training, and cost data. -
Update Support Sheet
Maintain categories like trade, region, and status. -
Use Page Navigator
Switch between dashboard pages easily. -
Apply Filters (Slicers)
Analyze data by region, education, or trade. -
Review KPI Cards
Monitor key performance indicators. -
Analyze Charts
Identify trends and insights.
👉 As a result, you can turn data into actionable decisions quickly.
📊 Best Practices for the Apprenticeship Programs Dashboard
To maximize results, follow these best practices:
✅ Best Practices:
-
Keep your data updated regularly
-
Focus on key KPIs only
-
Use filters to drill down into insights
-
Monitor monthly trends consistently
-
Compare performance across regions and skills
-
Avoid clutter and keep dashboards clean
👉 Therefore, you can ensure accurate and effective analysis.
Click to Purchases Apprenticeship Programs Dashboard in Excel
🔍 Opportunities for Improvement in Apprenticeship Programs
Even with a dashboard, improvement remains essential.
💡 Areas to Improve:
-
Increase certification rates
-
Reduce high-risk apprentice dropout
-
Improve training quality
-
Optimize cost allocation
-
Enhance placement success rates
👉 As a result, organizations can achieve better outcomes.
👥 Who Can Benefit from This Dashboard?
This dashboard is useful for multiple users.
🎯 Ideal Users:
-
HR Managers
-
Training Coordinators
-
Educational Institutions
-
Government Skill Development Bodies
-
NGOs & Workforce Development Agencies
👉 Therefore, anyone managing apprenticeship programs can benefit from this tool.
🔮 Future of Apprenticeship Analytics
As industries evolve, apprenticeship programs become more important. Therefore, data-driven insights will play a key role.
With advanced dashboards:
-
You can predict placement outcomes
-
You can improve training efficiency
-
You can automate reporting
-
You can enhance workforce planning
👉 As a result, dashboards like this will become essential tools.
📝 Conclusion
The Apprenticeship Programs Dashboard in Excel is a powerful and easy-to-use tool that helps organizations track training, monitor costs, and analyze placement outcomes.
It simplifies complex data and turns it into actionable insights. Moreover, it improves decision-making and enhances program success.
If you want to improve your apprenticeship programs and achieve better results, this dashboard is the perfect solution. 🚀
Click to Purchases Apprenticeship Programs Dashboard in Excel
❓ Frequently Asked Questions (FAQs)
1. What is an Apprenticeship Programs Dashboard in Excel?
It is a tool that helps track apprentices, training performance, costs, and placement outcomes.
2. Who can use this dashboard?
HR teams, training institutes, government agencies, and organizations can use it.
3. Can I customize the dashboard?
Yes, you can modify KPIs, charts, and filters as per your needs.
4. Does it update automatically?
Yes, charts update automatically when you input new data.
5. What are the key KPIs in this dashboard?
Total apprentices, training cost, stipend amount, and satisfaction score.
6. Is Excel required to use this dashboard?
Yes, you need Microsoft Excel to use and customize it.
7. How does this dashboard improve decision-making?
It provides clear insights, helping you take faster and smarter actions.
Click to Purchases Apprenticeship Programs Dashboard in Excel
Visit our YouTube channel to learn step-by-step video tutorials