Arbitration and mediation play a vital role in resolving disputes efficiently, fairly, and cost-effectively. However, without proper measurement, organizations struggle to understand how well their dispute resolution processes perform. Therefore, legal teams, arbitration centers, and dispute resolution professionals need a structured way to track performance. That is exactly where an Arbitration and Mediation KPI Dashboard in Excel delivers real value.
In this detailed and SEO-friendly article, you will learn what an Arbitration and Mediation KPI Dashboard in Excel is, why it matters, how it works, and how each worksheet supports better decision-making. Moreover, you will explore its advantages, best practices, and frequently asked questions. By the end of this guide, you will clearly understand how this ready-to-use Excel dashboard helps organizations improve transparency, efficiency, and outcomes in arbitration and mediation processes.
Click to Purchases Arbitration and Mediation KPI Dashboard in Excel
What Is an Arbitration and Mediation KPI Dashboard in Excel?
An Arbitration and Mediation KPI Dashboard in Excel is a structured, interactive, and data-driven reporting tool designed to track key performance indicators related to dispute resolution activities.
Instead of relying on scattered case files, manual registers, or static reports, this dashboard centralizes all arbitration and mediation KPIs into one Excel file. As a result, legal teams gain instant visibility into case performance, timelines, success rates, and workloads.
Moreover, Excel makes the dashboard easy to use and highly flexible. You can update data regularly, select reporting periods, and instantly analyze results without advanced technical skills.
Why Is KPI Tracking Important in Arbitration and Mediation?
Arbitration and mediation processes involve time, cost, resources, and multiple stakeholders. Therefore, tracking performance becomes essential.
KPI tracking helps organizations:
-
Measure case resolution efficiency
-
Monitor backlog and workload
-
Control time and cost overruns
-
Improve settlement success rates
-
Enhance transparency and accountability
Without KPIs, dispute resolution remains reactive. With KPIs, it becomes strategic and measurable.
Click to Purchases Arbitration and Mediation KPI Dashboard in Excel
What Is the Purpose of an Arbitration and Mediation KPI Dashboard?
The primary purpose of this dashboard is to convert case data into actionable insights.
This dashboard helps you:
-
Track arbitration and mediation KPIs consistently
-
Compare actual performance with targets
-
Monitor Month-to-Date (MTD) and Year-to-Date (YTD) results
-
Analyze trends against previous years
-
Support informed and timely decisions
As a result, organizations improve both operational efficiency and case outcomes.
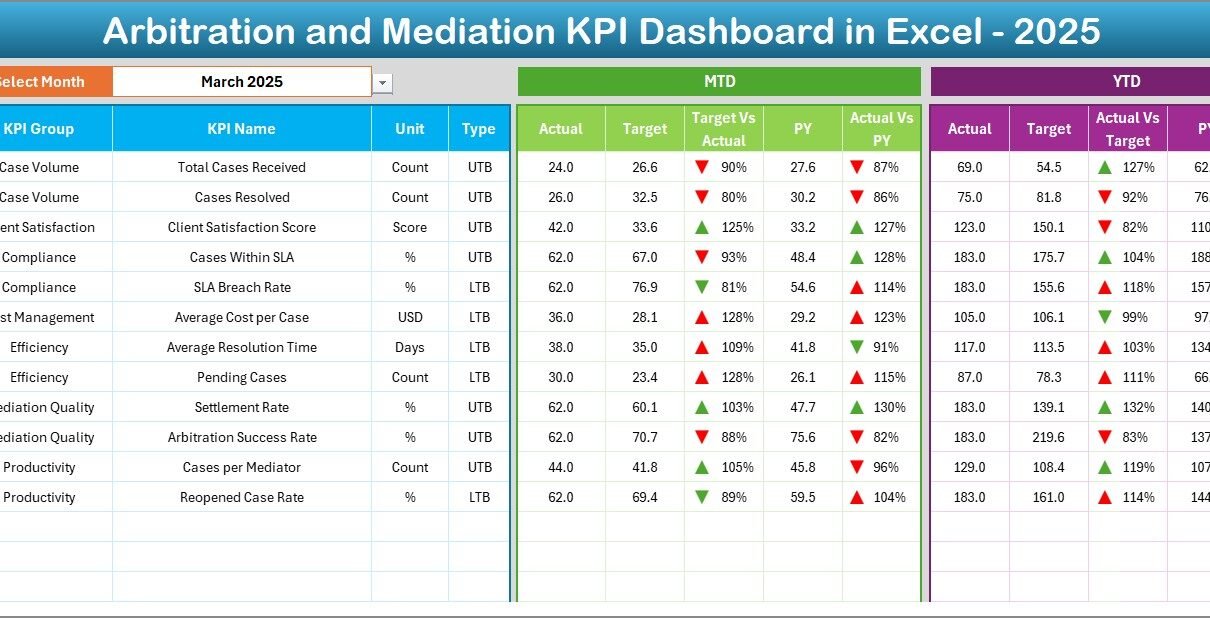
Which KPIs Are Commonly Tracked in Arbitration and Mediation?
An Arbitration and Mediation KPI Dashboard typically includes KPIs such as:
-
Number of Cases Filed
-
Number of Cases Resolved
-
Average Resolution Time
-
Settlement Success Rate
-
Pending Case Backlog
-
Cost per Case
-
Compliance with Timelines
-
Arbitrator or Mediator Utilization
Each KPI aligns with a specific goal, such as speed, quality, cost control, or effectiveness.
How Does an Arbitration and Mediation KPI Dashboard in Excel Work?
The dashboard works through structured data input, automated calculations, and dynamic visuals.
You enter actual numbers, targets, and previous year data. Then, Excel formulas calculate variances, trends, and performance indicators. After that, charts and conditional formatting visually highlight performance status.
Because Excel updates everything dynamically, the dashboard always reflects the latest data.
Click to Purchases Arbitration and Mediation KPI Dashboard in Excel
What Worksheets Are Included in the Arbitration and Mediation KPI Dashboard in Excel?
This ready-to-use dashboard includes seven well-structured worksheets, each designed for a specific purpose.
Let us explore them in detail.
What Is the Home Sheet and Why Is It Useful?
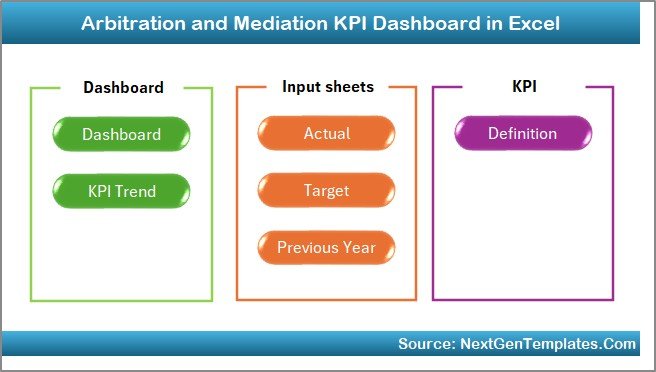
The Home Sheet acts as the navigation hub of the dashboard.
Key Features of the Home Sheet
-
Central index page
-
Six navigation buttons
-
Quick access to all major worksheets
Why the Home Sheet Matters
Because dashboards often include multiple sheets, navigation becomes important. This sheet saves time and improves usability by allowing users to jump directly to the required section.
What Is the Dashboard Sheet and How Does It Support Decision-Making?
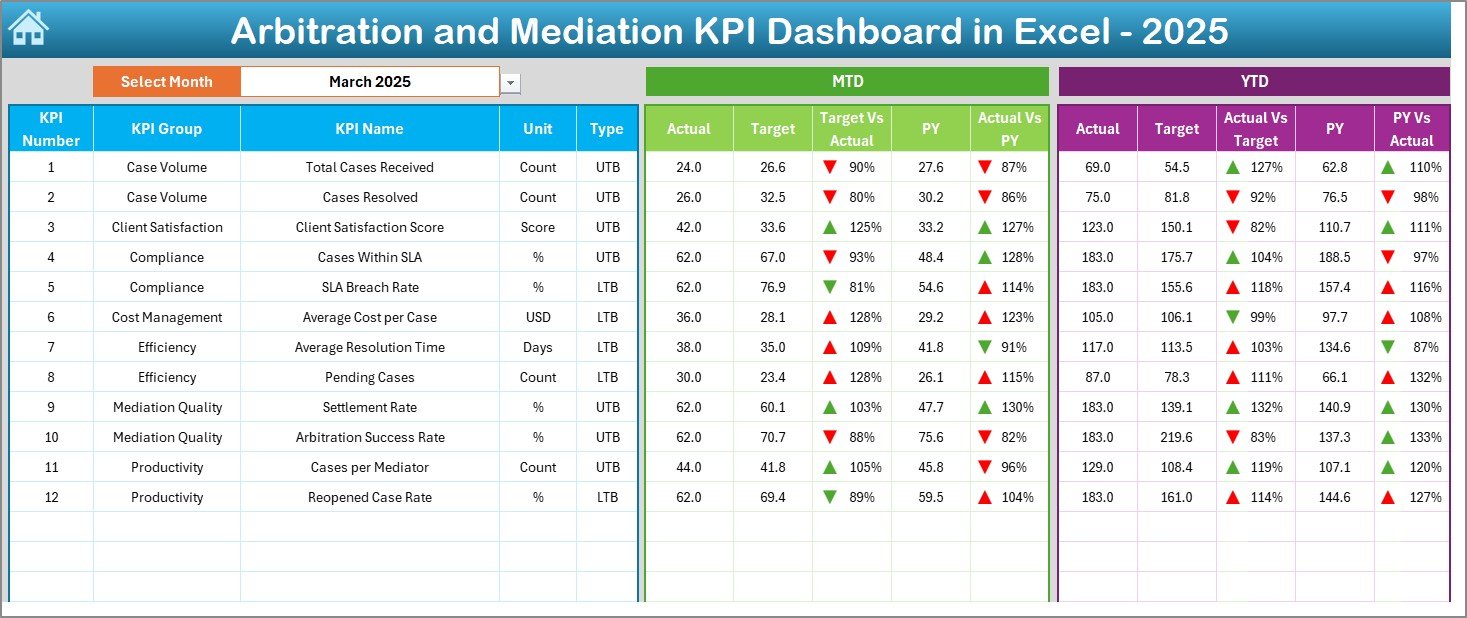
The Dashboard Sheet is the core of the entire KPI dashboard.
Key Features of the Dashboard Sheet
-
Month Selection Dropdown
You can select the reporting month from cell D3. All dashboard values update automatically. -
MTD Performance View
Displays MTD Actual, Target, and Previous Year values. -
YTD Performance View
Displays YTD Actual, Target, and Previous Year values. -
Target vs Actual Comparison
Instantly see whether KPIs meet defined targets. -
Previous Year Comparison
Understand performance improvement or decline. -
Conditional Formatting Indicators
Up and down arrows visually show performance trends.
Why the Dashboard Sheet Is Critical
This sheet provides a consolidated view of all KPIs. Therefore, leadership can quickly identify strengths, weaknesses, and priority areas.
Click to Purchases Arbitration and Mediation KPI Dashboard in Excel
What Is the KPI Trend Sheet and Why Is It Important?

The KPI Trend Sheet focuses on detailed KPI-level analysis.
How the KPI Trend Sheet Works
-
Select a KPI name from the dropdown at cell C3
-
The dashboard displays:
-
KPI Group
-
KPI Unit
-
KPI Type (Lower the Better or Upper the Better)
-
KPI Formula
-
KPI Definition
-
Trend Analysis Features
-
MTD Trend Chart for Actual, Target, and Previous Year
-
YTD Trend Chart for Actual, Target, and Previous Year
Why Trend Analysis Matters
Trends show performance direction over time. Therefore, this sheet helps you:
-
Detect early signs of delays or inefficiencies
-
Compare current performance with historical data
-
Support proactive corrective actions
What Is the Actual Numbers Input Sheet and How Do You Use It?

The Actual Numbers Input Sheet captures real performance data.
Key Features
-
Enter MTD and YTD actual values for each KPI
-
Change the reporting month from cell E1
-
Set the first month of the year easily
Why This Sheet Is Important
This sheet forms the foundation of the dashboard. Accurate and timely data entry ensures reliable insights across all reports.
Click to Purchases Arbitration and Mediation KPI Dashboard in Excel
What Is the Target Sheet and Why Is It Required?

The Target Sheet stores target values for each KPI.
What You Enter in the Target Sheet
-
Monthly MTD targets
-
Corresponding YTD targets
Why Targets Matter
Targets define success. Without clear targets, performance measurement loses meaning. Therefore, this sheet ensures consistent benchmarking.
What Is the Previous Year Number Sheet and How Does It Help?
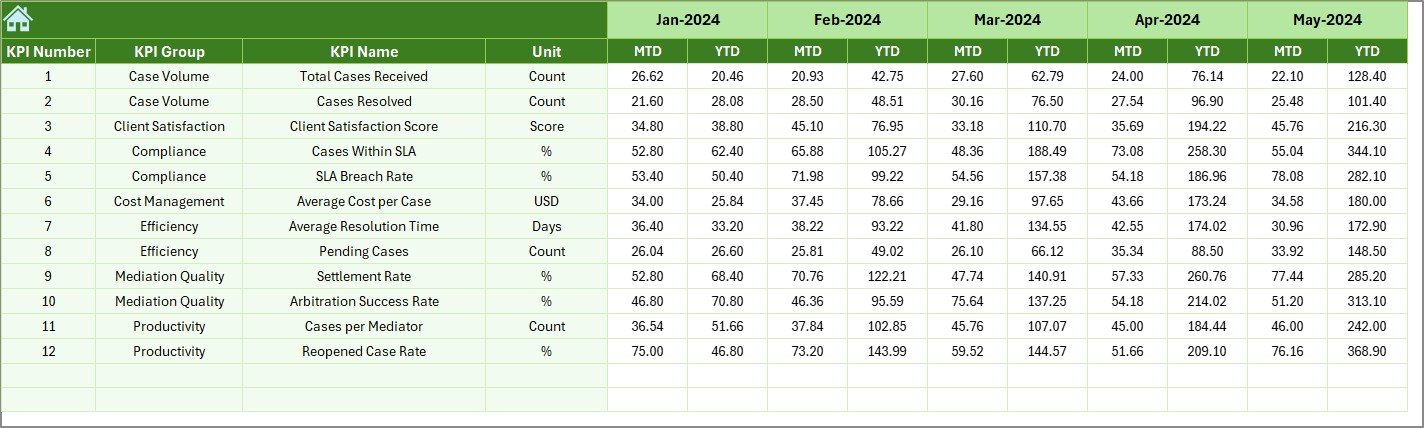
The Previous Year Number Sheet captures historical performance data.
Key Benefits
-
Enables year-over-year comparison
-
Helps measure improvement or decline
-
Supports trend and benchmarking analysis
Because context matters, previous year data adds valuable perspective.
Click to Purchases Arbitration and Mediation KPI Dashboard in Excel
What Is the KPI Definition Sheet and Why Is It Essential?

The KPI Definition Sheet documents all KPIs clearly.
Information Captured
-
KPI Name
-
KPI Group
-
Unit of Measurement
-
Formula
-
KPI Definition
Benefits of the KPI Definition Sheet
-
Ensures uniform KPI understanding
-
Reduces misinterpretation
-
Supports onboarding and training
-
Improves reporting consistency
Advantages of Arbitration and Mediation KPI Dashboard in Excel
Using this dashboard delivers multiple benefits.
Key Advantages
-
Centralized KPI Management
All arbitration and mediation KPIs stay in one place. -
Improved Transparency
Stakeholders clearly see case performance. -
Faster Decision-Making
Visual indicators highlight issues quickly. -
Better Case Control
Track delays, backlog, and resolution rates. -
User-Friendly Design
No complex tools or systems required. -
Customizable Structure
Easily modify KPIs and targets. -
Cost-Effective Solution
No expensive software investments needed.
How Does This Dashboard Improve Arbitration and Mediation Outcomes?
This dashboard improves outcomes by turning data into insights.
It helps organizations:
-
Reduce case resolution time
-
Improve settlement success rates
-
Balance mediator and arbitrator workload
-
Monitor compliance with timelines
-
Strengthen accountability
Because measurement drives improvement, the dashboard supports continuous performance enhancement.
Best Practices for the Arbitration and Mediation KPI Dashboard in Excel
To get maximum value, follow these best practices.
1. Select Relevant KPIs
Focus on KPIs that directly impact case efficiency and quality.
2. Define Clear KPI Definitions
Ensure every KPI has a clear formula and explanation.
3. Update Data Regularly
Frequent updates ensure accurate insights.
4. Review Both MTD and YTD Performance
Short-term and long-term views together provide better clarity.
5. Analyze Trends Consistently
Use trend charts to spot recurring issues early.
6. Align KPIs with Organizational Goals
Ensure KPIs support legal and business objectives.
7. Take Action on Insights
Always convert findings into corrective actions.
Click to Purchases Arbitration and Mediation KPI Dashboard in Excel
Who Should Use an Arbitration and Mediation KPI Dashboard in Excel?
This dashboard suits many professionals, including:
-
Arbitration Centers
-
Mediation Institutions
-
Legal Departments
-
Dispute Resolution Professionals
-
Compliance Teams
-
Consultants and Analysts
Because Excel remains widely used, this dashboard fits organizations of all sizes.
Can Small Legal Teams Use This Dashboard?
Yes, absolutely.
Small teams benefit because this dashboard offers:
-
Simple setup
-
Low cost
-
Easy customization
-
Immediate insights
As a result, even small legal teams gain structured performance management.
Conclusion: Why You Need an Arbitration and Mediation KPI Dashboard in Excel
An Arbitration and Mediation KPI Dashboard in Excel provides clarity, control, and consistency in dispute resolution performance tracking. It transforms raw case data into meaningful insights that support efficiency, transparency, and better outcomes.
Because it combines structured worksheets, trend analysis, visual indicators, and flexible data entry, this ready-to-use dashboard becomes an essential tool for modern arbitration and mediation management.
If you want to improve how you measure and manage dispute resolution performance, this Excel dashboard delivers a powerful and practical solution.
Click to Purchases Arbitration and Mediation KPI Dashboard in Excel
Frequently Asked Questions (FAQs)
What is an Arbitration and Mediation KPI Dashboard in Excel?
It is an Excel-based tool that tracks and analyzes KPIs related to arbitration and mediation performance.
Can I customize KPIs in the dashboard?
Yes, you can easily add, remove, or modify KPIs.
Does the dashboard support MTD and YTD analysis?
Yes, it supports both Month-to-Date and Year-to-Date analysis.
Do I need advanced Excel skills to use this dashboard?
No, basic Excel knowledge is sufficient.
How often should I update the dashboard?
You should update it based on your reporting cycle, such as monthly or quarterly.
Can this dashboard replace complex legal analytics tools?
For many organizations, yes. It offers strong insights without high costs.
Click to Purchases Arbitration and Mediation KPI Dashboard in Excel
Visit our YouTube channel to learn step-by-step video tutorials