The astrology and spiritual services industry has grown rapidly in recent years. More people now seek guidance through astrology consultations, tarot readings, healing sessions, and spiritual workshops. However, as demand increases, service providers face a new challenge.How do you measure performance?How do you track monthly bookings, client satisfaction, revenue growth, repeat customers, and consultation accuracy?Most practitioners rely on spreadsheets. However, scattered data does not provide clarity. As a result, business owners struggle to make informed decisions.Therefore, you need a structured system.You need an Astrology and Spiritual Services KPI Dashboard in Power BI.This ready-to-use dashboard helps astrology centers, spiritual consultants, tarot readers, and healing service providers monitor key performance indicators in one interactive system. Moreover, it converts raw Excel data into meaningful insights.
In this detailed guide, you will learn:Astrology and Spiritual Services KPI Dashboard in Power BI
- What an Astrology and Spiritual Services KPI Dashboard in Power BI is
- Why spiritual businesses need KPI tracking
- Detailed explanation of all 3 dashboard pages
- Excel data structure requirements
- Advantages of this dashboard
- Best practices for implementation
- Frequently Asked Questions
Click to buy Astrology and Spiritual Services KPI Dashboard in Power BI
What Is an Astrology and Spiritual Services KPI Dashboard in Power BI?
An Astrology and Spiritual Services KPI Dashboard in Power BI is an interactive business intelligence tool that helps spiritual service providers measure and monitor performance metrics.
Instead of manually checking multiple Excel sheets, you can:
- Track Monthly Performance (MTD)
- Monitor Year-to-Date Performance (YTD)
- Compare Current Year vs Previous Year
- Identify target achievement trends
- Analyze underperforming KPIs instantly
Moreover, Power BI automatically updates visuals when you refresh Excel data. Therefore, you always see real-time insights.
Why Do Astrology and Spiritual Businesses Need KPI Tracking?
Many spiritual service providers focus only on client consultations. However, if you want long-term growth, you must track measurable performance indicators.
Because when you track KPIs:
- You identify revenue trends quickly
- You improve client satisfaction
- You increase repeat consultations
- You reduce cancellations
- You improve marketing performance
Furthermore, KPI tracking helps you set clear goals. Instead of guessing performance, you make decisions based on numbers.
Key Features of the Astrology and Spiritual Services KPI Dashboard in Power BI
This dashboard contains 3 powerful analytical pages. Each page serves a specific purpose.
Let us understand them one by one.
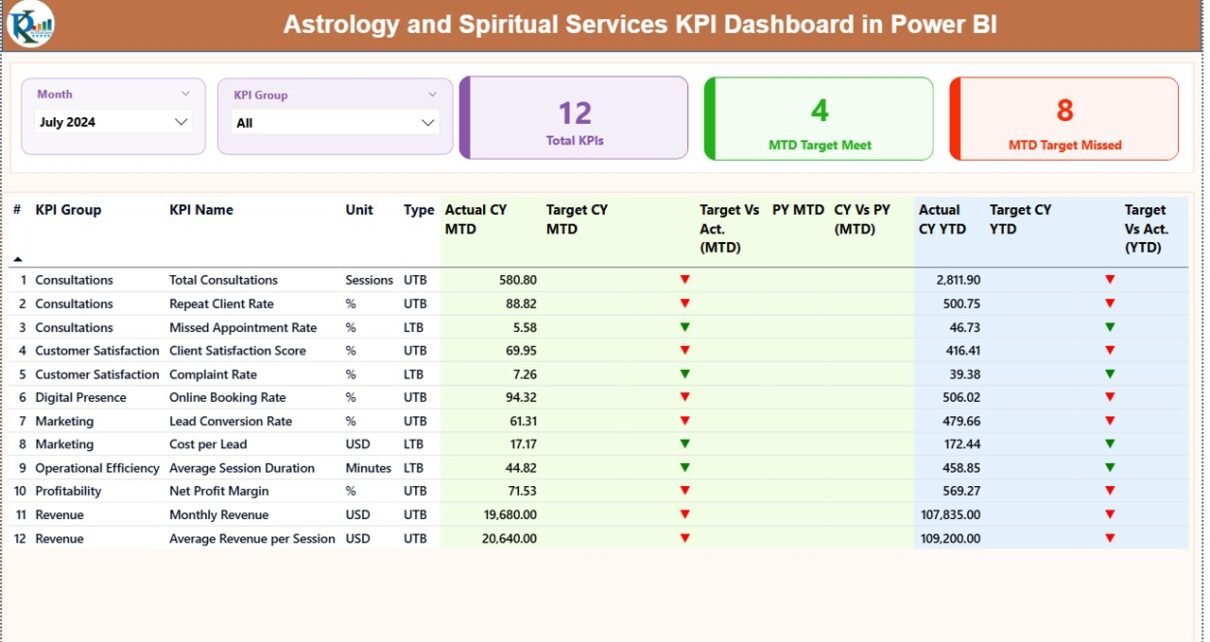
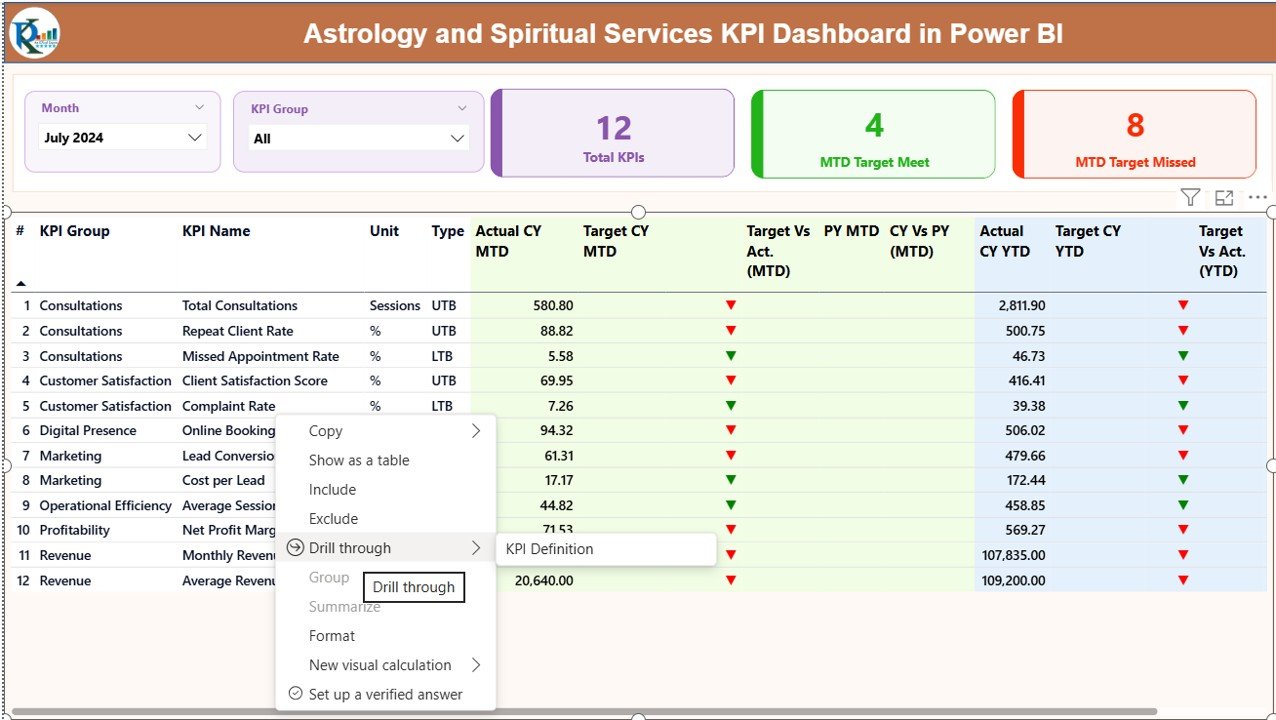
Summary Page
The Summary Page works as the main control center of the dashboard.
At the top, you will see:
- Month Slicer
- KPI Group Slicer
These slicers allow you to filter data dynamically. Therefore, you can analyze specific months or KPI categories instantly.
KPI Cards Section
Below the slicers, you will find 3 key performance cards:
- Total KPIs Count
- MTD Target Meet Count
- MTD Target Missed Count
These cards immediately show overall performance status.
Detailed KPI Table
Under the cards, the dashboard displays a detailed KPI performance table. This table contains:
- KPI Number – Sequence number of KPI
- KPI Group – Category of KPI (Revenue, Client, Operations, Quality, etc.)
- KPI Name – Specific KPI title
- Unit – Measurement unit (Number, %, Hours, etc.)
- Type – LTB (Lower the Better) or UTB (Upper the Better)
MTD (Month-To-Date) Analysis
- Actual CY MTD
- Target CY MTD
- MTD Icon (▲ Green or ▼ Red)
- Target vs Actual (MTD %)
- PY MTD
- CY vs PY (MTD %)
The dashboard calculates:
Actual MTD ÷ Target MTD
And
Current Year MTD ÷ Previous Year MTD
Therefore, you instantly understand performance against targets and past year.
YTD (Year-To-Date) Analysis
Similarly, the dashboard shows:
- Actual CY YTD
- Target CY YTD
- YTD Icon
- Target vs Actual (YTD %)
- PY YTD
- CY vs PY (YTD %)
Thus, you analyze long-term growth easily.

Click to buy Astrology and Spiritual Services KPI Dashboard in Power BI
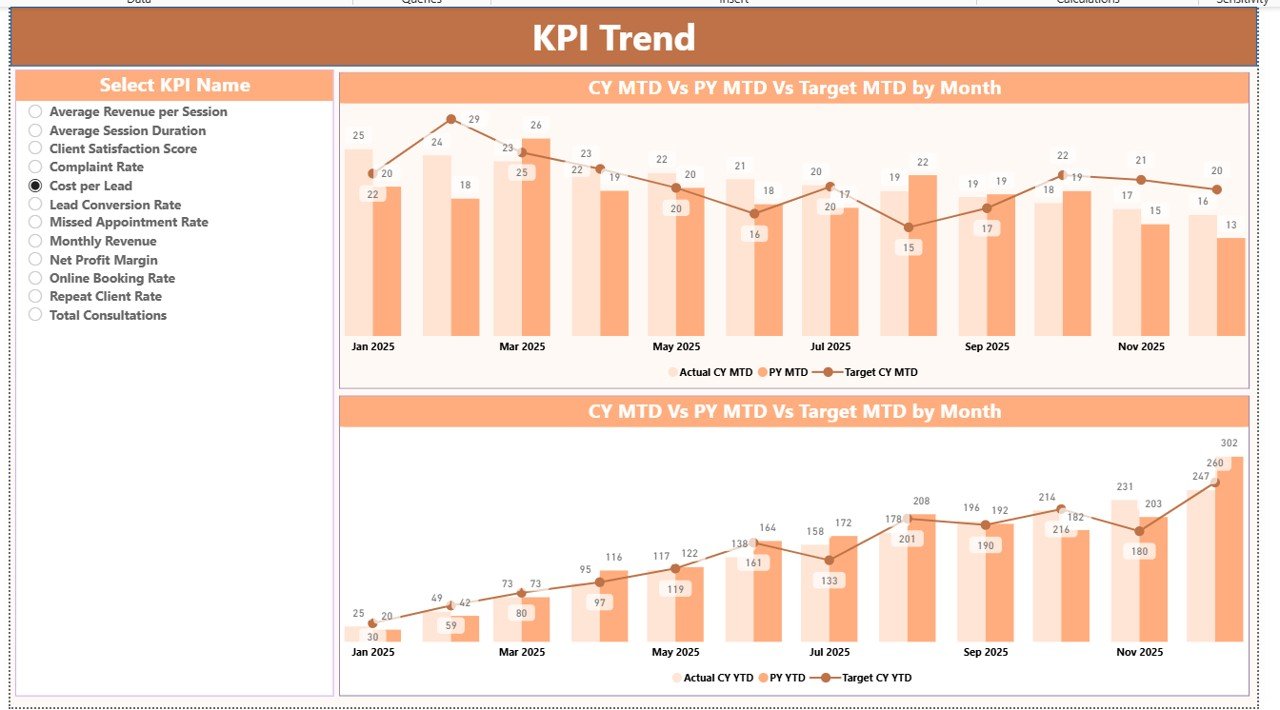
KPI Trend Page
The KPI Trend Page provides deep visual insights.
On this page:
- You get 2 Combo Charts
- One for MTD
- One for YTD
Each chart shows:
- Current Year Actual
- Previous Year Actual
- Target Value
Moreover, you can select a specific KPI using the slicer on the left.
Therefore, you can analyze:
- Monthly revenue growth
- Client satisfaction trend
- Session completion rate
- Repeat client percentage
Trend analysis helps you predict future performance. Consequently, you make smarter business decisions.
Click to buy Astrology and Spiritual Services KPI Dashboard in Power BI
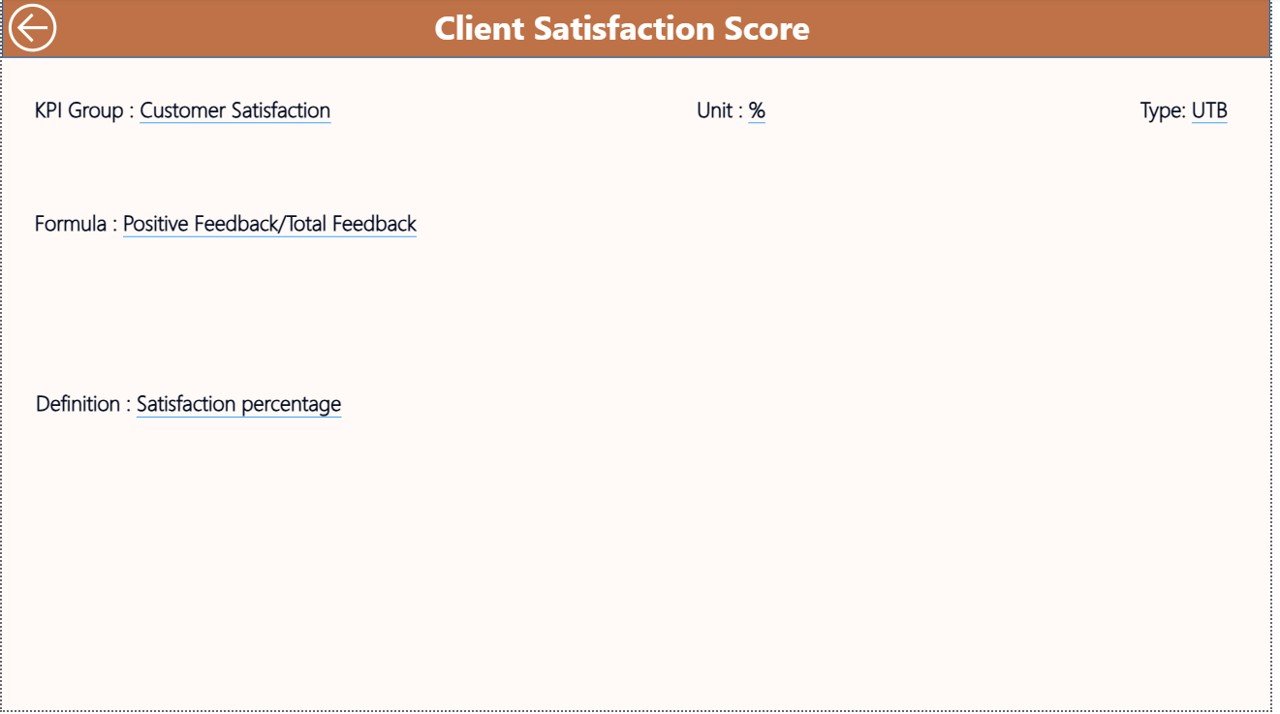
KPI Definition
The KPI Definition Page works as a drill-through page.
Although it remains hidden, you can access it from the Summary Page.
This page displays:
- KPI Formula
- KPI Definition
- KPI Group
- KPI Unit
- KPI Type
Therefore, whenever someone wants clarity about calculation logic, they can drill through and understand full details.
To return to the main page, simply click the back button at the top left corner.
Click to buy Astrology and Spiritual Services KPI Dashboard in Power BI
How Does the Excel Data Structure Work?
The dashboard uses an Excel file as the data source.
You must fill 3 worksheets carefully.
Input_Actual Sheet
Here you enter:
- KPI Name
- Month (First date of month)
- MTD Value
- YTD Value
For example:
- January 1, 2026
- Revenue from Horoscope Readings
- 45 (MTD)
- 420 (YTD)
Ensure you maintain consistent formatting.
Click to buy Astrology and Spiritual Services KPI Dashboard in Power BI
Input_Target Sheet
Here you enter:
- KPI Name
- Month
- MTD Target
- YTD Target
This sheet allows comparison between target and actual performance.
KPI Definition Sheet
This sheet contains:
- KPI Number
- KPI Group
- KPI Name
- Unit
- Formula
- Definition
- Type (LTB or UTB)
For example:
- KPI Name: Client Satisfaction Rate
- Formula: Positive Feedback / Total Sessions
- Type: UTB
Thus, Power BI reads all necessary information from Excel.
What Types of KPIs Can You Track in Astrology and Spiritual Services?
You can track multiple categories of KPIs:
Revenue KPIs
- Total Monthly Revenue
- Average Revenue per Consultation
- Workshop Revenue
- Online Booking Revenue
Client KPIs
- Total Sessions Conducted
- Repeat Client Rate
- Client Satisfaction %
- Referral Rate
Operational KPIs
- Appointment Cancellation Rate
- No-Show Rate
- Average Session Duration
- Booking Lead Time
Marketing KPIs
- Website Conversion Rate
- Social Media Inquiries
- Campaign ROI
- Cost per Lead
Therefore, this dashboard supports complete business monitoring.
Advantages of Astrology and Spiritual Services KPI Dashboard in Power BI
Now let us understand the major benefits.
Centralized Performance Monitoring
Instead of checking multiple files, you view all KPIs in one place.
Real-Time Insights
As soon as you update Excel data, Power BI refreshes visuals. Therefore, you always see updated numbers.
Clear Target Tracking
The green and red icons instantly show whether you achieved targets.
Better Decision Making
Because you analyze trends visually, you identify growth opportunities quickly.
Time Saving
You reduce manual calculations. Consequently, you focus more on serving clients.
Professional Reporting
You can present this dashboard to partners, investors, or team members professionally.
Best Practices for the Astrology and Spiritual Services KPI Dashboard
To get maximum benefits, follow these best practices.
Define Clear KPIs
Before entering data, clearly define measurable KPIs. Avoid vague metrics.
Maintain Data Consistency
Always use the first date of each month. Maintain uniform format.
Update Data Monthly
Regular updates ensure accurate trend analysis.
Use Proper KPI Classification
Separate Revenue, Client, Marketing, and Operational KPIs.
Review Trends Quarterly
Do not rely only on monthly performance. Analyze quarterly trends.
Train Your Team
Ensure your team understands KPI definitions and dashboard usage.
How Does This Dashboard Improve Business Growth?
Because when you monitor KPIs:
- You identify weak marketing campaigns
- You reduce cancellations
- You improve session efficiency
- You increase revenue per client
- You improve client retention
Moreover, you stop relying on intuition alone. Instead, you use data-driven insights.
Therefore, long-term growth becomes predictable and manageable.
Who Can Use This Dashboard?
This dashboard suits:
- Astrology Consultation Centers
- Tarot Reading Businesses
- Vedic Astrology Practitioners
- Numerology Consultants
- Reiki Healing Centers
- Spiritual Coaching Businesses
- Online Horoscope Platforms
Thus, any spiritual service provider can benefit from this system.
Why Choose Power BI for KPI Tracking?
Power BI offers:
- Interactive visuals
- Drill-through functionality
- Dynamic slicers
- Professional layout
- Easy Excel integration
Moreover, Power BI provides flexibility for future expansion. Therefore, as your business grows, the dashboard can grow with you.
Conclusion
The astrology and spiritual services industry continues to expand. However, without structured performance tracking, growth becomes unpredictable.
The Astrology and Spiritual Services KPI Dashboard in Power BI provides clarity, control, and confidence.
It allows you to:
- Track MTD and YTD performance
- Compare current year with previous year
- Monitor target achievement
- Analyze KPI trends visually
- Maintain professional reporting
Therefore, if you want to transform your spiritual service business into a data-driven enterprise, this dashboard offers the perfect solution.
Now you can serve your clients spiritually while managing your business strategically.
Frequently Asked Questions (FAQs)
What is MTD and YTD in KPI tracking?
MTD means Month-To-Date performance. YTD means Year-To-Date performance. These metrics help you track short-term and long-term progress.
Do I need advanced Power BI knowledge to use this dashboard?
No. You only need basic knowledge to refresh data and use slicers.
Can I customize KPIs?
Yes. You can modify the KPI Definition sheet and add new KPIs easily.
How often should I update the Excel data?
You should update data monthly. However, you can update it weekly if required.
Can I use this dashboard for other service industries?
Yes. You can adapt this dashboard for consulting, coaching, or wellness businesses.
Does this dashboard support previous year comparison?
Yes. It automatically calculates CY vs PY for both MTD and YTD.
Watch the step-by-step video tutorial:
Visit our YouTube channel to learn step-by-step video tutorials
Click to buy Astrology and Spiritual Services KPI Dashboard in Power BI