Auction houses operate in a fast-moving and highly competitive environment. Every auction event involves consignors, bidders, inventory valuation, commissions, marketing costs, and final hammer prices. Therefore, auction managers must track performance carefully. However, many auction businesses still rely on scattered spreadsheets and manual calculations. As a result, decision-making becomes slow and inaccurate.So, how can auction houses monitor performance, analyze results, and improve profitability without investing in expensive software?You need an Auction Houses KPI Dashboard in Excel.In this detailed guide, you will learn everything about building and using an Auction Houses KPI Dashboard in Excel. Moreover, you will understand how this dashboard helps auction managers track KPIs, improve operational efficiency, and make data-driven decisions.
Click to buy Auction Houses KPI Dashboard in Excel
What Is an Auction Houses KPI Dashboard in Excel?
An Auction Houses KPI Dashboard in Excel is a ready-to-use analytical reporting tool designed to monitor key performance indicators related to auction operations, financial performance, and sales outcomes.
Instead of reviewing multiple worksheets separately, you can analyze all auction performance metrics from one centralized dashboard.
With this dashboard, auction houses can:
- Track auction revenue and commissions
- Monitor bidder participation
- Compare targets vs actual performance
- Analyze monthly and yearly performance trends
- Evaluate profitability and efficiency
Because Excel remains accessible and flexible, teams can implement the dashboard quickly without technical complexity.
Why Do Auction Houses Need KPI Tracking?
Auction businesses deal with dynamic pricing and unpredictable outcomes. Therefore, performance visibility becomes essential.
Without KPI tracking:
- Managers cannot evaluate auction success accurately.
- Financial planning becomes difficult.
- Marketing investments lack measurable outcomes.
- Inventory turnover remains unclear.
However, when auction houses use KPI dashboards, they gain structured insights.
Key Benefits of KPI Tracking
- Improved revenue forecasting
- Better consignor relationship management
- Enhanced operational transparency
- Faster decision-making
- Increased profitability
Consequently, KPI dashboards transform raw auction data into actionable intelligence.
What Makes Excel Ideal for Auction KPI Dashboards?
Although many analytics tools exist, Excel offers unmatched flexibility.
Excel Advantages
- Easy customization
- No additional software cost
- Pivot-table-driven analytics
- Dynamic formulas and automation
- User-friendly interface
Moreover, Excel allows auction teams to maintain complete control over their data structure.
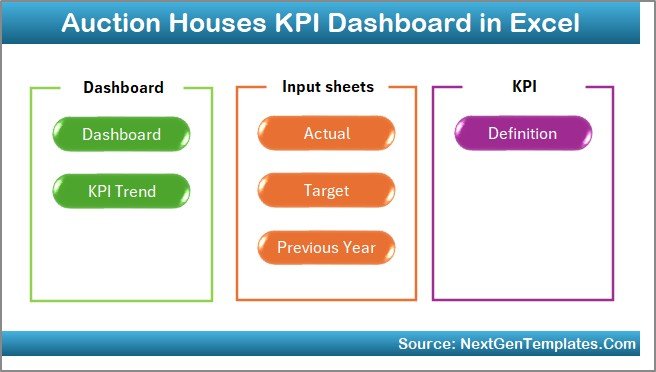
Overview of the Auction Houses KPI Dashboard Structure
This Auction Houses KPI Dashboard includes 7 powerful worksheets, each designed for a specific analytical purpose.
Let us explore each sheet step by step.
Summary Page – Your Navigation Center
The Summary Page acts as the dashboard index.
Key Features
- Six navigation buttons
- Quick access to all sheets
- User-friendly layout
- Centralized workflow control
Instead of scrolling through multiple tabs, users can instantly move between analytical pages.
As a result, dashboard usability improves significantly.
Click to buy Auction Houses KPI Dashboard in Excel
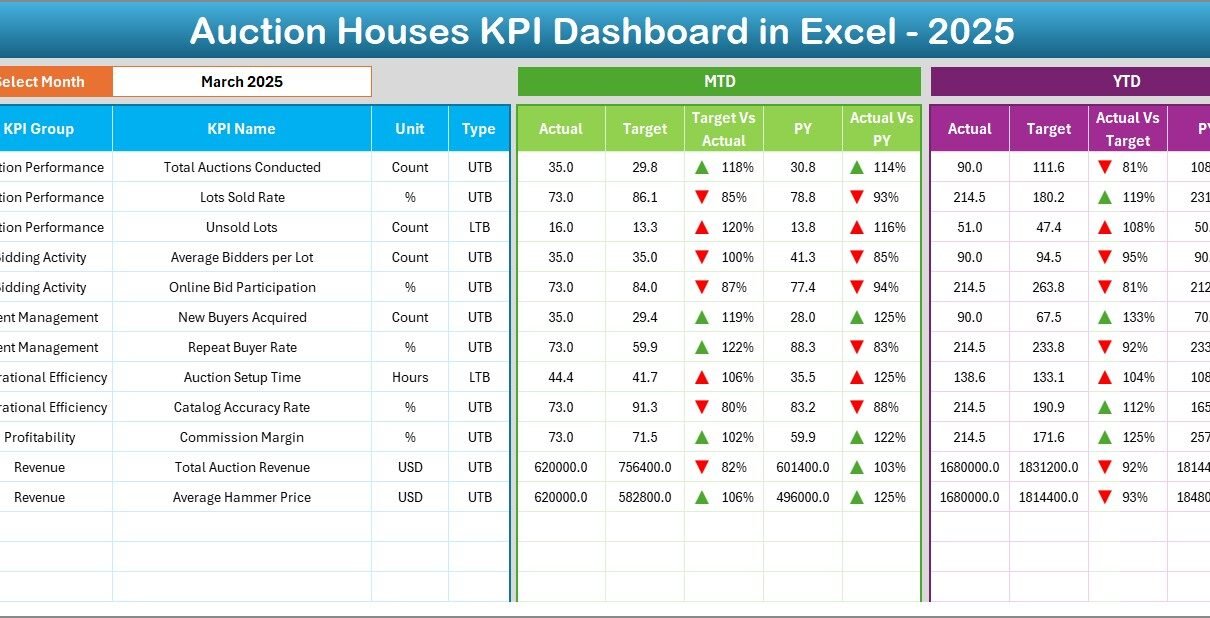
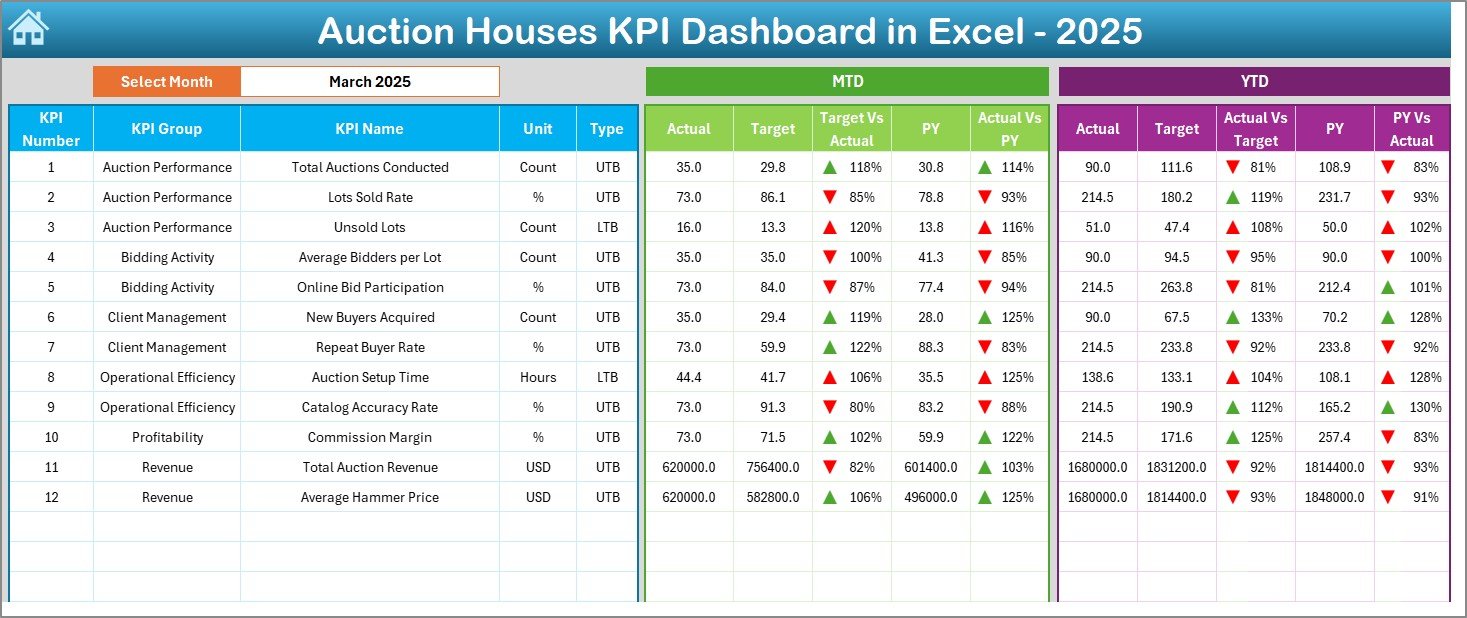
Dashboard Sheet – The Main Performance View
The Dashboard Sheet serves as the core analytical page.
Here, users see complete KPI performance at a glance.
Dynamic Month Selection
- Month dropdown available in cell D3
- Entire dashboard updates automatically
- Instant performance comparison
KPI Metrics Displayed
The dashboard shows:
- MTD (Month-To-Date) Actual
- MTD Target
- Previous Year Comparison
- YTD (Year-To-Date) Actual
- YTD Target
- YTD Previous Year
Visual Indicators
Conditional formatting enhances clarity:
- Up arrows for positive performance
- Down arrows for underperformance
- Color-coded signals
Therefore, managers instantly understand performance status without manual analysis.
Click to buy Auction Houses KPI Dashboard in Excel
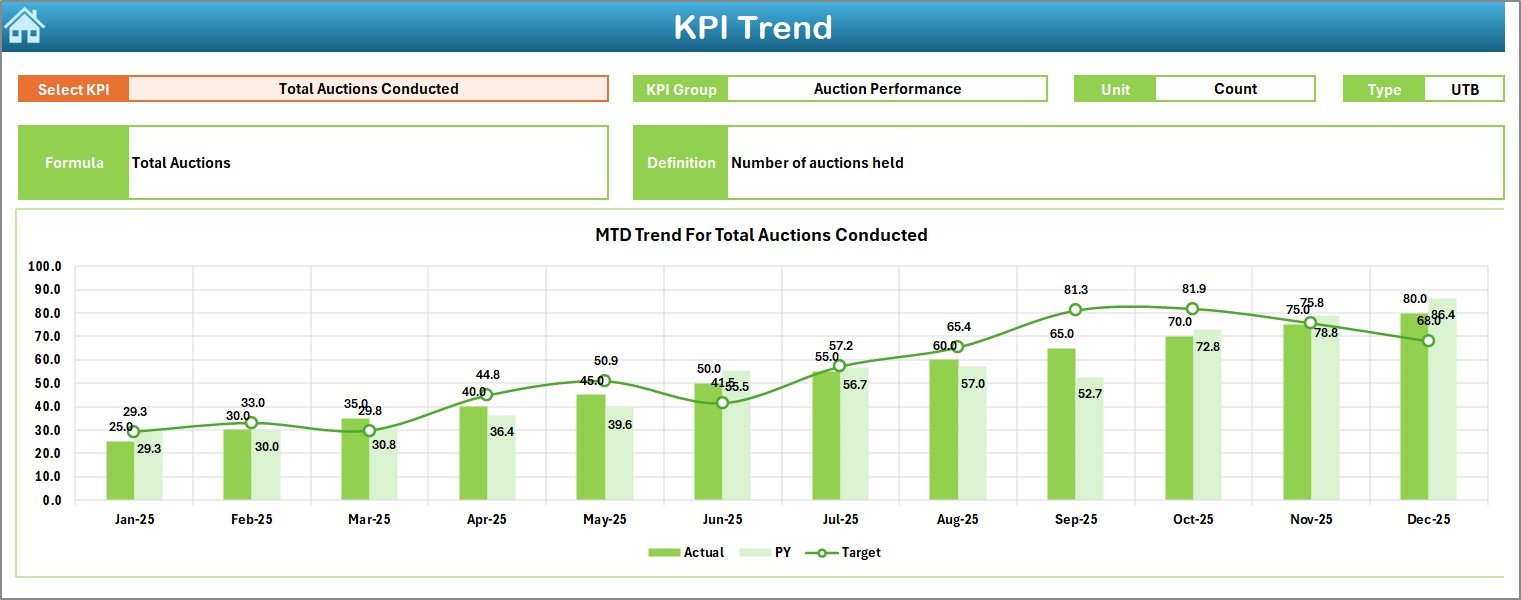
Trend Sheet – KPI Performance Analysis Over Time
The Trend Sheet provides deeper analytical insight.
Here, users analyze KPI movement across months.
Interactive KPI Selection
- KPI dropdown available in cell C3
- Dynamic chart updates
- Focused KPI evaluation
Information Displayed
The sheet shows:
- KPI Group
- KPI Unit
- KPI Type (Upper the Better / Lower the Better)
- KPI Formula
- KPI Definition
Trend Visualization
Charts include:
- MTD Actual vs Target vs Previous Year
- YTD Actual vs Target vs Previous Year
Because trends reveal patterns, auction managers can identify performance improvements or risks early.
Click to buy Auction Houses KPI Dashboard in Excel
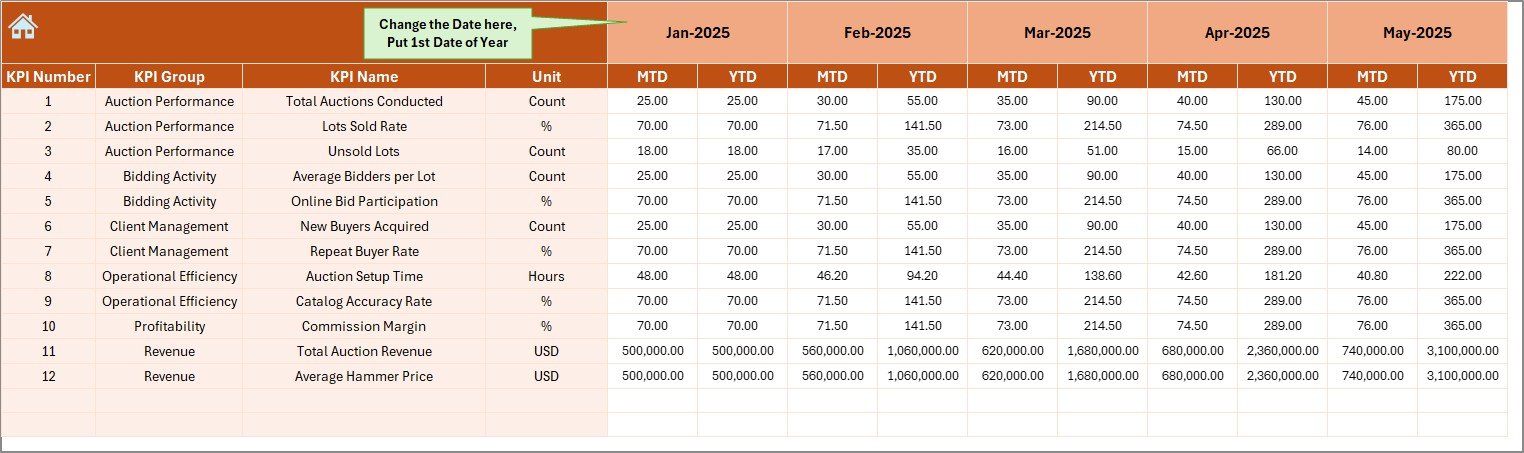
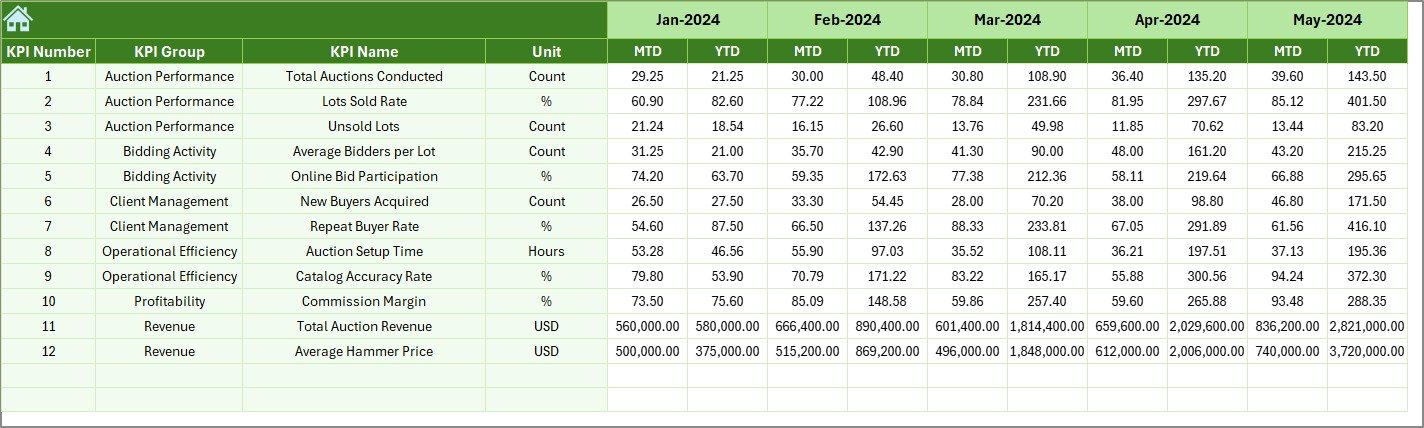
Actual Numbers Input Sheet – Data Entry Hub
This sheet stores real operational data.
How It Works
- Enter actual KPI values monthly
- Change starting month in cell E1
- Dashboard updates automatically
Data Entered Includes
- Auction revenue
- Number of lots sold
- Bidder participation
- Commission earned
- Conversion rates
Therefore, users maintain accurate real-time reporting.
Click to buy Auction Houses KPI Dashboard in Excel
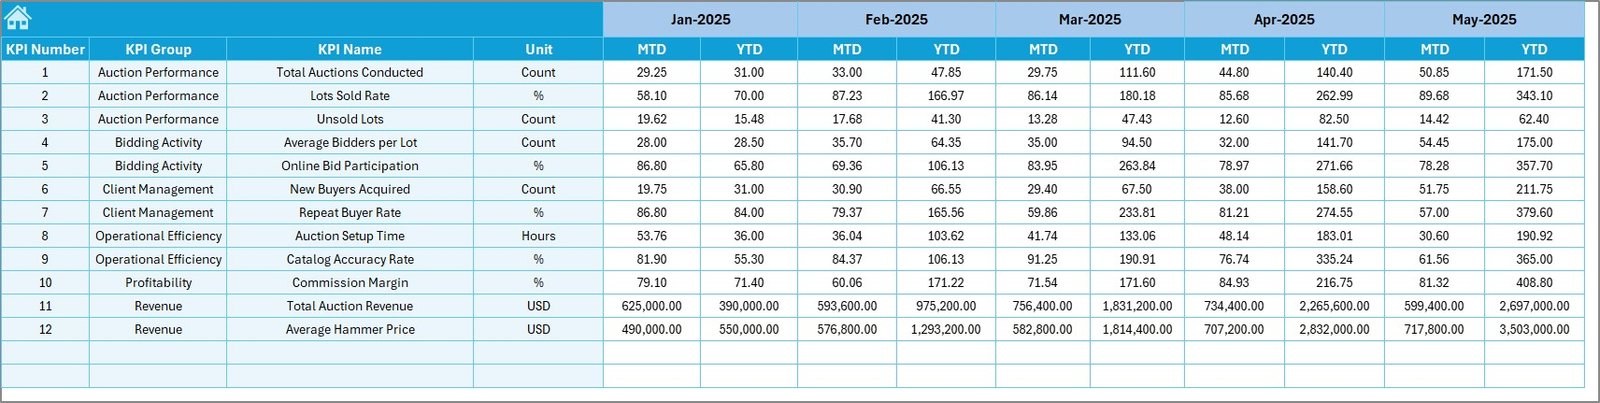
Target Sheet – Goal Setting and Planning
Every successful auction house operates with defined goals.
This sheet allows teams to enter:
- Monthly targets
- YTD targets
- KPI-specific performance expectations
Once targets are entered, the dashboard compares performance automatically.
Consequently, managers quickly evaluate success levels.
Click to buy Auction Houses KPI Dashboard in Excel
Previous Year Numbers Sheet – Historical Comparison
Historical performance provides valuable context.
This sheet stores last year’s data using the same structure as current-year data.
Why Previous-Year Data Matters
- Measures growth trends
- Evaluates seasonal performance
- Improves forecasting accuracy
- Identifies recurring patterns
Therefore, auction houses gain long-term performance visibility.
Click to buy Auction Houses KPI Dashboard in Excel
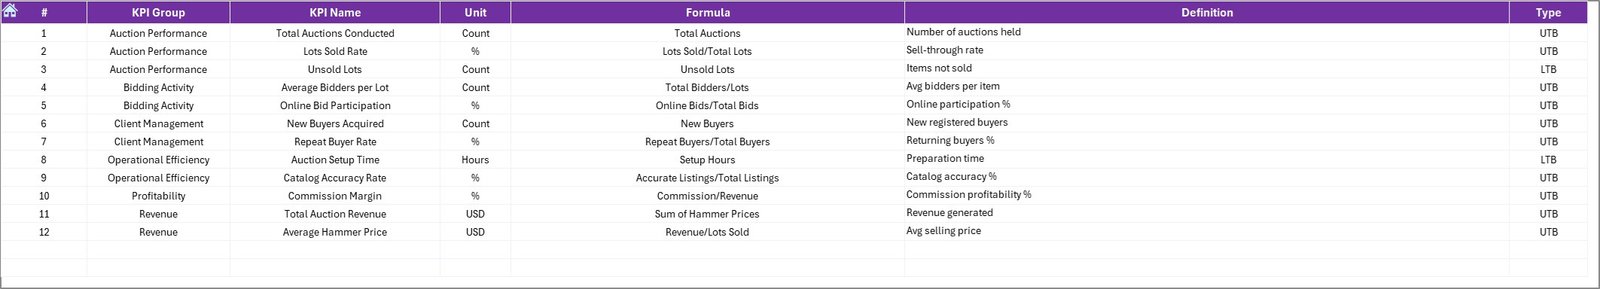
KPI Definition Sheet – KPI Knowledge Base
This sheet acts as the dashboard’s documentation center.
Users define:
- KPI Name
- KPI Group
- Unit
- Formula
- KPI Definition
Because clear definitions exist, all users interpret KPIs consistently.
Click to buy Auction Houses KPI Dashboard in Excel
Which KPIs Should Auction Houses Track?
A strong KPI dashboard depends on meaningful metrics.
Operational KPIs
- Number of Auctions Conducted
- Lots Listed
- Lots Sold Percentage
- Average Auction Duration
Financial KPIs
- Total Revenue
- Commission Earned
- Average Hammer Price
- Profit Margin
Customer KPIs
- Active Bidders
- New Registrations
- Bidder Conversion Rate
Efficiency KPIs
- Inventory Turnover
- Unsold Lot Percentage
- Cost per Auction Event
These KPIs ensure complete performance monitoring.
How Does the Dashboard Improve Decision-Making?
When managers see data visually, they act faster.
For example:
- If conversion rates drop, marketing strategies can change immediately.
- If commission revenue increases, pricing strategies may expand.
- If unsold lots rise, inventory valuation requires adjustment.
Thus, dashboards support proactive management instead of reactive decisions.
Advantages of Auction Houses KPI Dashboard in Excel
Centralized Performance Monitoring
All KPIs appear in one place, which reduces reporting time.
Faster Decision-Making
Visual indicators highlight issues instantly.
Performance Transparency
Teams understand goals clearly.
Improved Profitability
Managers identify revenue opportunities quickly.
Dynamic Updates
Changing one input automatically updates all visuals.
Flexible Customization
Auction houses can add or modify KPIs easily.
Best Practices for the Auction Houses KPI Dashboard in Excel
To maximize dashboard value, follow these best practices.
- Define KPIs Clearly
Always document formulas and definitions.
- Maintain Data Consistency
Use standardized data entry formats.
- Update Data Regularly
Enter numbers monthly to keep insights accurate.
- Use Meaningful Targets
Set realistic performance benchmarks.
- Review Trends Frequently
Analyze trends instead of single-month performance.
- Limit Manual Changes
Avoid altering formulas to prevent errors.
- Train Team Members
Ensure users understand dashboard navigation.
How Can Auction Managers Use This Dashboard Daily?
Managers can integrate dashboard usage into daily operations.
Daily Tasks
- Review KPI performance
- Monitor auction progress
- Check bidder activity
Monthly Tasks
- Compare targets vs actuals
- Evaluate revenue growth
- Adjust strategies
Annual Tasks
- Analyze yearly trends
- Improve forecasting
- Plan expansion strategies
Therefore, the dashboard becomes a continuous management tool.
Common Challenges Auction Houses Face Without Dashboards
Without structured analytics:
- Reports take hours to prepare.
- Data errors increase.
- Performance visibility remains limited.
- Strategic decisions rely on guesswork.
However, dashboards eliminate these problems by automating analysis.
Who Can Benefit from This Dashboard?
This solution works for:
- Auction house owners
- Auction managers
- Financial analysts
- Operations teams
- Art and antique auction firms
- Online auction platforms
Because the dashboard adapts easily, organizations of any size can use it.
How Does This Dashboard Support Business Growth?
Growth requires measurement.
When auction houses monitor KPIs:
- They optimize pricing strategies.
- They improve bidder engagement.
- They enhance inventory planning.
- They increase revenue consistency.
As a result, long-term scalability improves.
Future Expansion Possibilities
Auction houses can extend the dashboard by adding:
- Geographic analysis
- Online vs offline auction comparison
- Marketing ROI tracking
- Category-wise performance dashboards
- Predictive forecasting models
Excel allows continuous expansion without rebuilding the system.
Conclusion
Auction houses operate in a results-driven industry where performance visibility determines success. Therefore, structured KPI tracking becomes essential.
The Auction Houses KPI Dashboard in Excel provides a powerful yet simple solution for monitoring operational, financial, and performance metrics in one interactive environment.
Because the dashboard combines automation, visualization, and flexibility, auction managers gain complete control over their business performance. Moreover, teams reduce manual reporting while improving strategic decisions.
Ultimately, organizations that measure performance consistently achieve stronger growth, higher profitability, and better operational efficiency.
Frequently Asked Questions (FAQs)
- What is an Auction Houses KPI Dashboard in Excel?
It is a ready-to-use Excel dashboard that tracks auction performance metrics such as revenue, lots sold, bidder activity, and profitability.
- Do I need advanced Excel skills to use this dashboard?
No. The dashboard uses simple data entry sheets and automated calculations, so beginners can use it easily.
- Can I customize KPIs in the dashboard?
Yes. You can add, remove, or modify KPIs through the KPI Definition sheet.
- How often should I update the dashboard?
You should update it monthly for accurate MTD and YTD reporting.
- Does the dashboard support historical comparison?
Yes. The Previous Year sheet allows direct comparison with past performance.
- Can small auction houses use this dashboard?
Absolutely. The dashboard suits both small and large auction businesses.
- Why should auction houses track KPIs?
KPI tracking improves decision-making, increases transparency, and helps businesses grow sustainably.
Click to buy Auction Houses KPI Dashboard in Excel
Visit our YouTube channel to learn step-by-step video tutorials
Watch the step-by-step video tutorial: