The aviation industry operates in one of the most complex and safety-critical environments in the world. Airlines, aircraft operators, and maintenance organizations must continuously monitor aircraft health, maintenance schedules, operational costs, and reliability metrics. Therefore, aviation companies rely heavily on data-driven insights to ensure safety, reduce downtime, and improve operational efficiency.
However, many aviation maintenance teams still manage maintenance information using scattered reports, multiple spreadsheets, and manual tracking systems. As a result, decision-makers often struggle to identify performance trends, analyze maintenance costs, and detect reliability issues quickly.
Therefore, modern aviation organizations increasingly adopt advanced data visualization tools like Power BI to monitor maintenance performance effectively.
One powerful solution is the Aviation Maintenance Dashboard in Power BI. This interactive dashboard enables maintenance managers, engineers, and aviation analysts to monitor maintenance activities, track work orders, analyze maintenance costs, and evaluate aircraft reliability in a structured and visual format.
Instead of reviewing multiple reports, aviation professionals can analyze all maintenance metrics through a single dashboard.
In this comprehensive guide, you will learn:
- What an Aviation Maintenance Dashboard in Power BI is
- Why aviation organizations need maintenance dashboards
- Key features of the dashboard
- Important aviation maintenance metrics
- Advantages of using this dashboard
- Best practices for implementing aviation maintenance analytics
- Frequently asked questions about aviation maintenance dashboards
Click to buy Aviation Maintenance Dashboard in Power BI
What Is an Aviation Maintenance Dashboard in Power BI?
An Aviation Maintenance Dashboard in Power BI is an interactive data visualization tool designed to monitor aircraft maintenance activities, track maintenance costs, analyze work orders, and measure reliability performance.
Power BI allows aviation organizations to transform raw maintenance data into meaningful visual insights. As a result, managers can quickly identify maintenance issues, track operational efficiency, and improve aircraft reliability.
This dashboard typically integrates maintenance data such as:
- Work orders
- Maintenance types
- Aircraft categories
- Department performance
- Labor and parts costs
- Reliability impact metrics
- Service level agreement (SLA) targets
Because Power BI supports interactive charts, filters, and drill-down analysis, users can analyze maintenance performance from multiple perspectives.
Consequently, aviation maintenance teams gain better visibility into operations and can make faster and smarter decisions.
Why Do Aviation Organizations Need a Maintenance Dashboard?
Aircraft maintenance plays a critical role in aviation safety and operational efficiency. Therefore, organizations must track numerous maintenance activities every day.
However, manual monitoring creates several challenges:
- Large volumes of maintenance data
- Multiple aircraft types and maintenance categories
- Complex work order management
- Difficulty identifying cost trends
- Limited visibility into reliability issues
Because of these challenges, aviation organizations require a centralized system to analyze maintenance data.
An aviation maintenance dashboard solves these problems by providing:
- Real-time maintenance insights
- Cost monitoring and control
- Work order tracking
- Department performance evaluation
- Aircraft reliability analysis
As a result, aviation teams can quickly identify problems and take corrective actions.
Key Features of the Aviation Maintenance Dashboard in Power BI
This Aviation Maintenance Dashboard contains five interactive pages, each designed to analyze maintenance operations from different perspectives.
These pages allow users to drill down into maintenance performance and identify operational trends.
Let’s explore each page in detail.
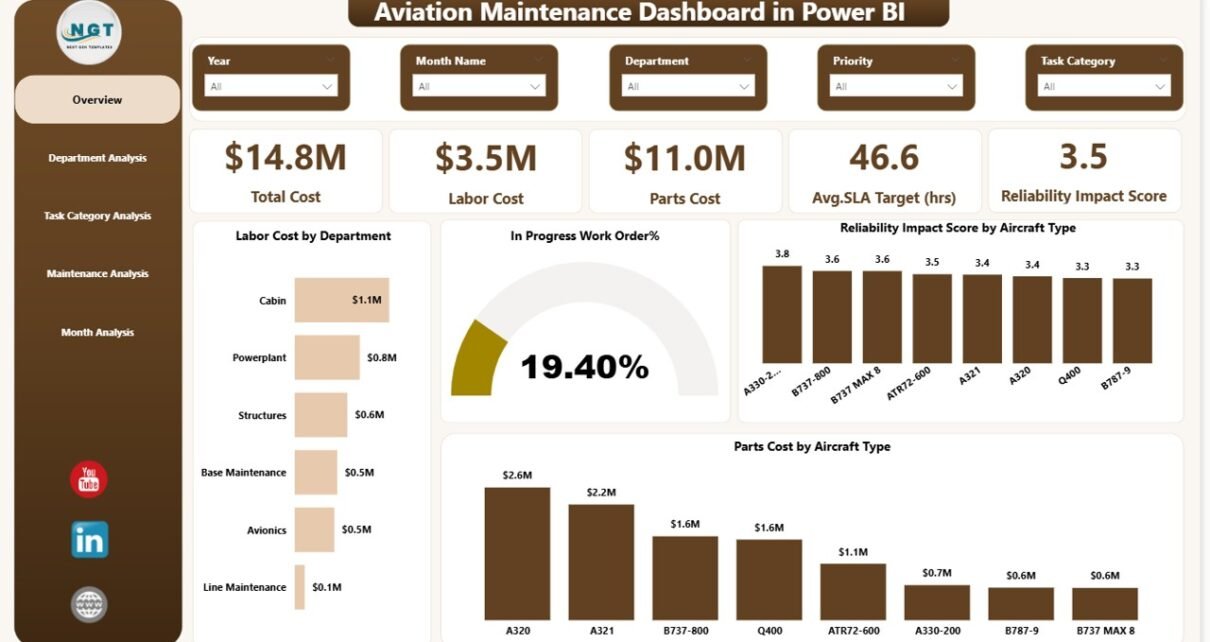
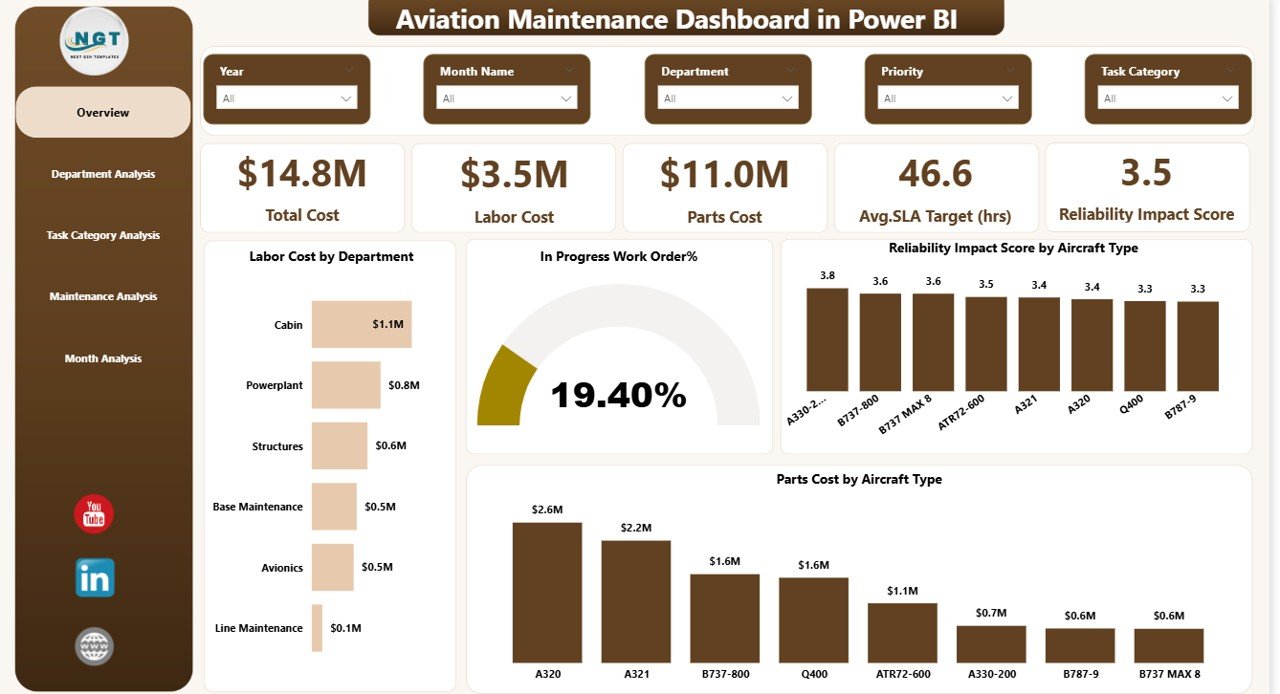
Overview Page – The Main Maintenance Monitoring Panel
The Overview Page serves as the central control panel of the dashboard. It provides a quick snapshot of aviation maintenance performance.
Users can immediately evaluate costs, work orders, and reliability metrics from this page.
KPI Cards Displayed on the Overview Page
The dashboard displays five key performance indicators:
- Total Cost – Overall maintenance cost
- Labor Cost – Total workforce cost for maintenance tasks
- Parts Cost – Cost of replacement parts
- Average SLA Target (Hours) – Average maintenance response time target
- Reliability Impact Score – Score representing maintenance impact on aircraft reliability
These KPIs allow decision-makers to quickly evaluate maintenance performance.
Charts Included on the Overview Page
The overview page also includes four analytical charts:
- Labor Cost by Department – Shows maintenance labor expenses across departments
- In Progress Work Order % – Displays the percentage of ongoing maintenance tasks
- Reliability Impact Score by Aircraft Type – Analyzes aircraft reliability across different aircraft models
- Parts Cost by Aircraft Type – Highlights the parts cost distribution for aircraft types
Because this page summarizes critical maintenance metrics, managers can quickly identify operational trends.
Click to buy Aviation Maintenance Dashboard in Power BI
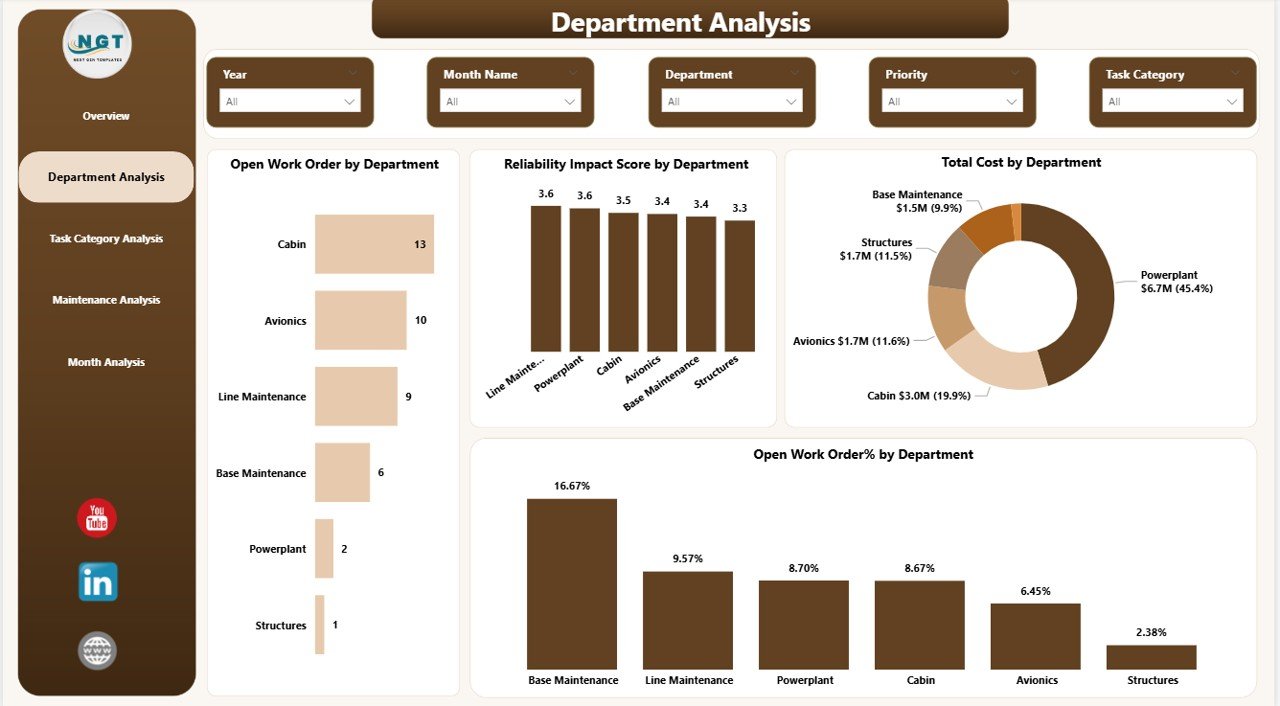
Department Analysis – How Do Maintenance Departments Perform?
Maintenance operations usually involve multiple departments such as:
- Engine maintenance
- Avionics
- Airframe maintenance
- Electrical systems
- Structural maintenance
Therefore, organizations must evaluate how each department contributes to maintenance performance.
The Department Analysis Page helps managers compare maintenance performance across departments.
Charts Available in Department Analysis
This page includes four charts:
- Open Work Orders by Department
Shows the number of pending maintenance tasks across departments. - Reliability Impact Score by Department
Evaluates how department performance influences aircraft reliability. - Total Cost by Department
Displays maintenance cost distribution across departments. - Open Work Order % by Department
Shows the percentage of incomplete work orders in each department.
Because this page highlights department performance, management teams can allocate resources more effectively.
Click to buy Aviation Maintenance Dashboard in Power BI
Task Category Analysis – What Type of Maintenance Tasks Occur Most?
Aircraft maintenance includes different task categories such as:
- Inspection tasks
- Repair tasks
- Component replacements
- Preventive maintenance
- Corrective maintenance
Therefore, aviation organizations must track task categories to understand maintenance workload.
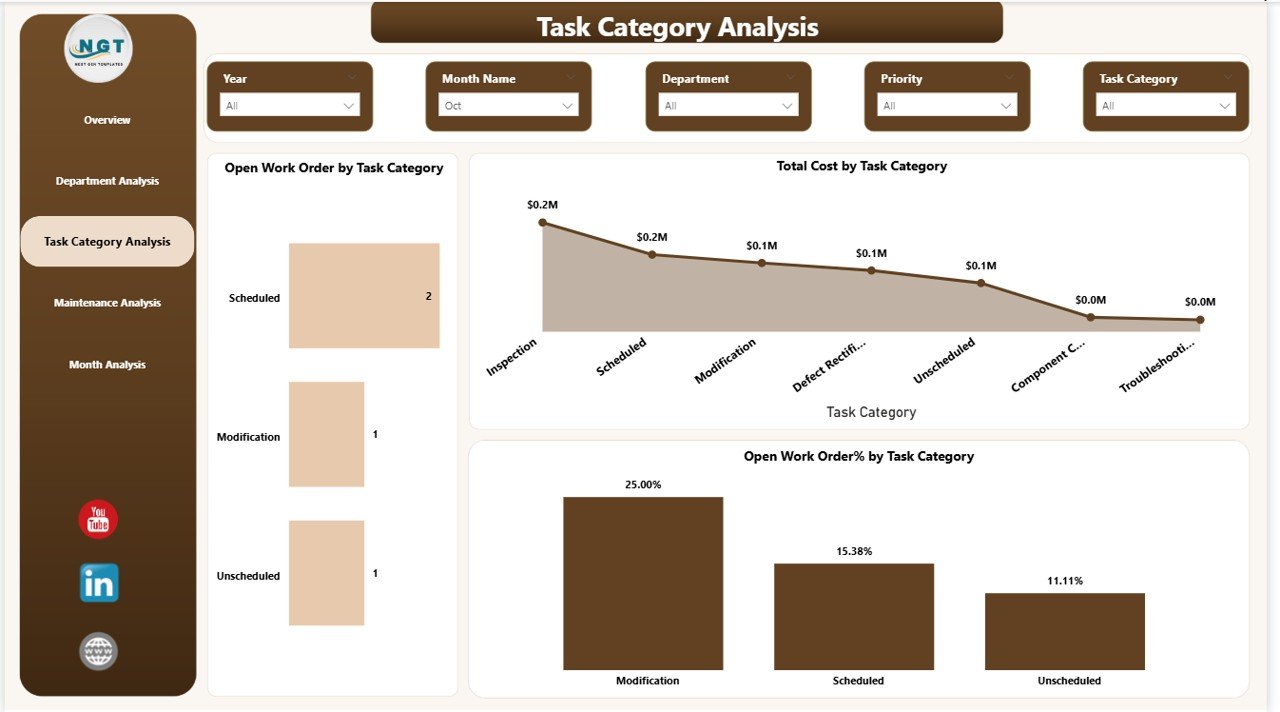
The Task Category Analysis Page focuses on analyzing maintenance tasks by category.
Charts Included in Task Category Analysis
This page includes three charts:
- Open Work Orders by Task Category
Shows pending maintenance tasks across categories. - Total Cost by Task Category
Displays maintenance expenses related to different task categories. - Open Work Order % by Task Category
Highlights categories with high maintenance backlog.
Because of this analysis, managers can identify which maintenance categories require additional resources.
Click to buy Aviation Maintenance Dashboard in Power BI
Maintenance Analysis – How Do Maintenance Types Affect Operations?
Aircraft maintenance activities usually fall into several maintenance types:
- Preventive maintenance
- Corrective maintenance
- Scheduled maintenance
- Unscheduled maintenance
- Emergency maintenance
Therefore, understanding maintenance type distribution helps aviation teams improve maintenance planning.
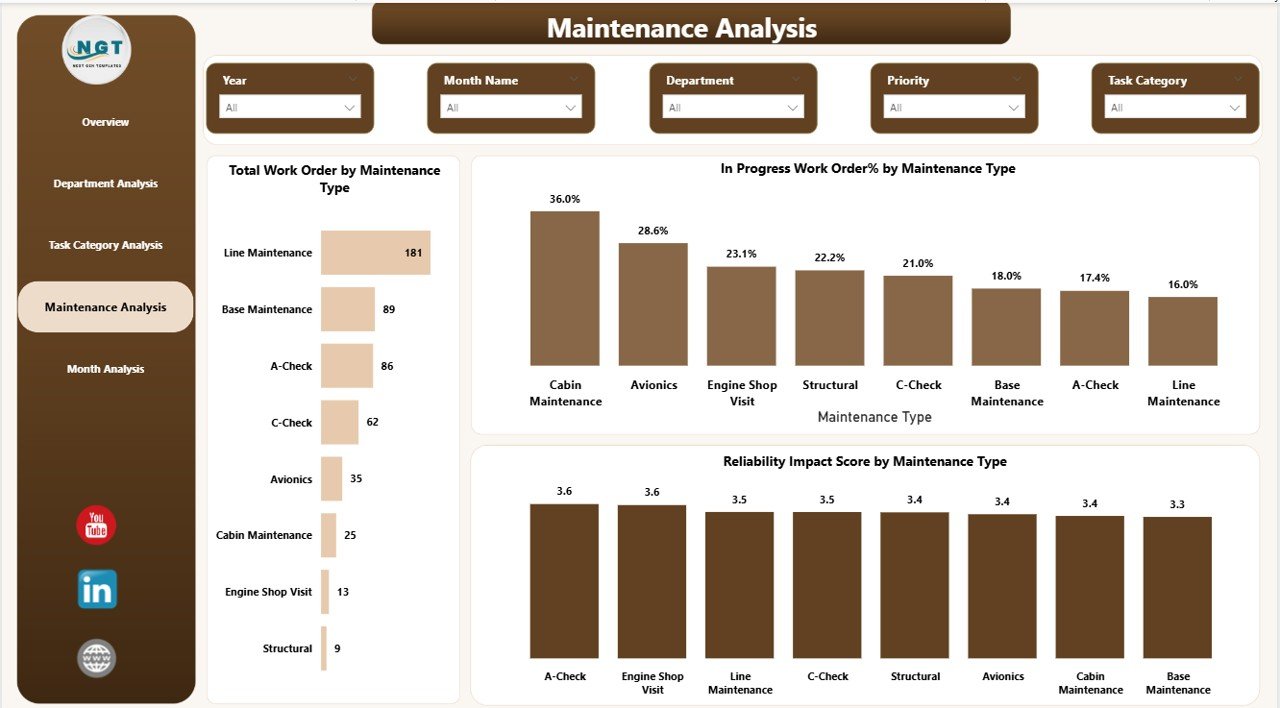
The Maintenance Analysis Page provides insights into maintenance types.
Charts Included in Maintenance Analysis
This page includes three charts:
- Total Work Orders by Maintenance Type
Displays the volume of maintenance tasks for each type. - In Progress Work Order % by Maintenance Type
Shows the percentage of ongoing maintenance tasks. - Reliability Impact Score by Maintenance Type
Evaluates how different maintenance types influence aircraft reliability.
Because this analysis highlights maintenance trends, managers can improve maintenance strategies.
Click to buy Aviation Maintenance Dashboard in Power BI
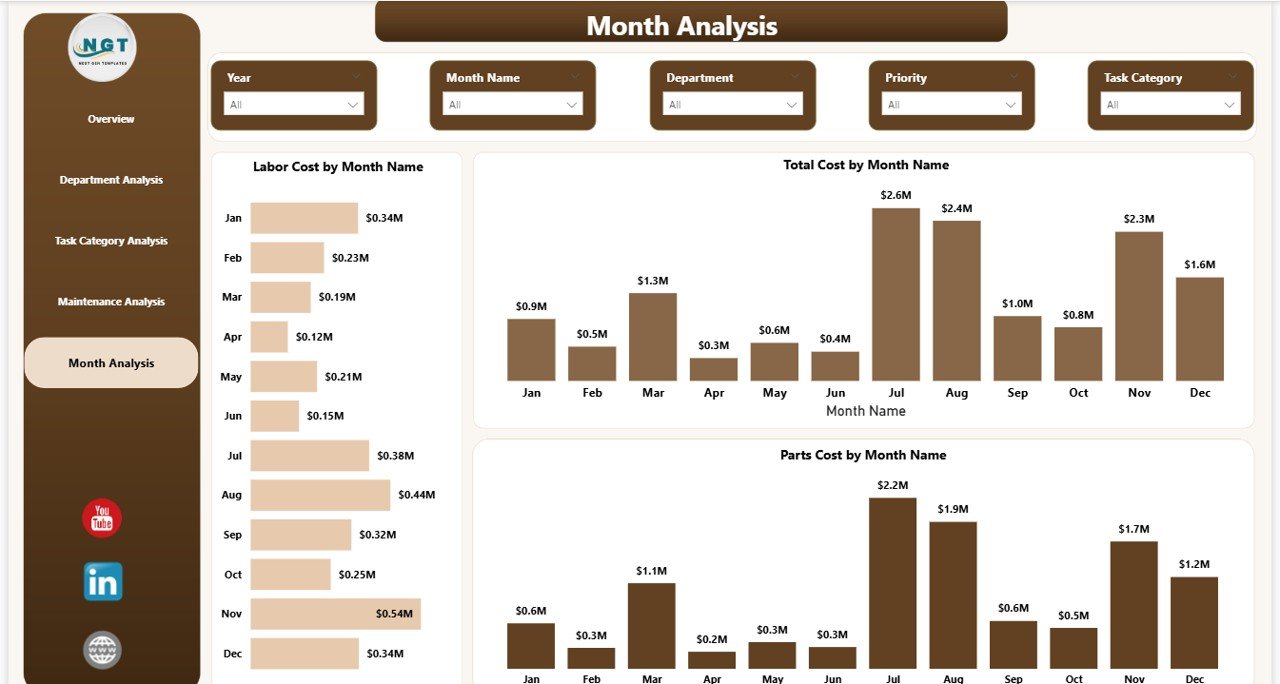
Month Analysis – How Do Maintenance Costs Change Over Time?
Maintenance costs fluctuate throughout the year depending on aircraft utilization, inspections, and component replacements.
Therefore, organizations must track maintenance costs by month to identify cost patterns.
The Month Analysis Page helps aviation teams evaluate maintenance trends over time.
Charts Included in Month Analysis
This page includes three charts:
- Labor Cost by Month
Displays workforce expenses throughout the year. - Total Cost by Month
Shows the overall maintenance cost trend. - Parts Cost by Month
Tracks monthly spending on aircraft parts.
Because this page provides time-based analysis, aviation managers can forecast maintenance budgets and plan maintenance schedules.
Click to buy Aviation Maintenance Dashboard in Power BI
Important KPIs Used in Aviation Maintenance Dashboards
An aviation maintenance dashboard typically monitors several key performance indicators.
Some important KPIs include:
- Maintenance Cost
- Labor Cost
- Parts Cost
- Work Order Completion Rate
- Open Work Order Percentage
- Aircraft Reliability Score
- SLA Compliance
- Maintenance Backlog
- Preventive Maintenance Compliance
- Maintenance Downtime
These KPIs allow aviation organizations to measure maintenance efficiency and operational reliability.
Advantages of Aviation Maintenance Dashboard in Power BI
Organizations that implement aviation maintenance dashboards gain several benefits.
- Improved Maintenance Visibility
Power BI dashboards provide a centralized view of maintenance operations. Therefore, managers can quickly monitor aircraft health and maintenance performance.
- Faster Decision Making
Because dashboards provide real-time insights, managers can identify issues quickly and take corrective actions.
- Better Cost Control
Maintenance dashboards track labor costs and parts costs in detail. As a result, organizations can reduce unnecessary spending.
- Improved Aircraft Reliability
By monitoring reliability impact scores and maintenance trends, aviation teams can prevent major failures.
- Efficient Work Order Management
The dashboard helps teams track open work orders and prioritize maintenance tasks.
- Department Performance Monitoring
Managers can evaluate department productivity and allocate resources more effectively.
- Data-Driven Maintenance Planning
Historical maintenance data helps organizations plan preventive maintenance strategies.
Best Practices for the Aviation Maintenance Dashboard in Power BI
Organizations should follow several best practices to maximize the value of aviation maintenance dashboards.
Maintain High-Quality Data
Accurate data ensures reliable dashboard insights. Therefore, maintenance teams should regularly update maintenance records.
Track the Right KPIs
Organizations should focus on metrics that directly influence maintenance performance and aircraft reliability.
Use Interactive Filters
Power BI slicers allow users to analyze maintenance data by aircraft type, department, and maintenance category.
Monitor Maintenance Costs Regularly
Continuous monitoring helps organizations identify cost spikes and control expenses.
Perform Trend Analysis
Historical maintenance data helps identify patterns and improve maintenance planning.
Ensure Cross-Department Collaboration
Maintenance dashboards work best when all departments contribute accurate data.
Update the Dashboard Frequently
Frequent updates ensure the dashboard reflects the latest maintenance activities.
Who Can Benefit from an Aviation Maintenance Dashboard?
Several aviation professionals can benefit from this dashboard:
- Airline maintenance managers
- Aircraft engineers
- Aviation safety teams
- Maintenance planners
- Operations managers
- Aviation analysts
- Maintenance repair organizations (MRO)
Because the dashboard provides detailed operational insights, these professionals can improve maintenance efficiency and aircraft safety.
Conclusion
Aircraft maintenance requires careful monitoring, accurate data analysis, and proactive decision-making. Without proper analytics, aviation organizations may struggle to control maintenance costs, track work orders, and maintain aircraft reliability.
Therefore, the Aviation Maintenance Dashboard in Power BI provides a powerful solution for monitoring aviation maintenance operations.
This interactive dashboard allows aviation teams to analyze maintenance costs, track work orders, evaluate department performance, and monitor aircraft reliability through multiple analytical pages.
Because Power BI offers dynamic visualizations and real-time insights, aviation organizations can make faster and more informed decisions.
As a result, companies can improve operational efficiency, enhance aircraft reliability, and maintain the highest safety standards.
Frequently Asked Questions (FAQs)
What is an Aviation Maintenance Dashboard?
An Aviation Maintenance Dashboard is a data visualization tool that tracks aircraft maintenance activities, costs, work orders, and reliability metrics.
Why should aviation companies use Power BI for maintenance dashboards?
Power BI offers powerful visualization tools, interactive filters, and real-time analytics. Therefore, aviation companies can easily monitor maintenance performance and identify operational issues.
What metrics should an aviation maintenance dashboard include?
Common aviation maintenance metrics include:
- Total maintenance cost
- Labor cost
- Parts cost
- Work order completion rate
- Maintenance backlog
- Aircraft reliability score
- SLA compliance
How does a maintenance dashboard improve aircraft reliability?
The dashboard identifies maintenance trends and reliability issues early. Therefore, maintenance teams can take preventive actions before problems escalate.
Who typically uses aviation maintenance dashboards?
Maintenance managers, engineers, aviation analysts, operations managers, and airline executives commonly use aviation maintenance dashboards.
Watch the step-by-step video tutorial:
Visit our YouTube channel to learn step-by-step video tutorials
Click to buy Aviation Maintenance Dashboard in Power BI