Introduction to Battery Manufacturing Dashboard
The Battery Manufacturing Dashboard is a ready-to-use Excel dashboard designed to streamline and visualize key metrics within battery production processes. By simply updating the data in the Data sheet and refreshing the dashboard, you can instantly gain insights into production, quality control, costs, and plant performance. This dashboard is ideal for manufacturers looking to optimize operations with a comprehensive and interactive tool.
Click to Purchases Battery Manufacturing Dashboard in Excel
Key Features of Battery Manufacturing Dashboard
- Ready-to-use with easy data update and refresh functionality in Excel.
- Multiple pages targeting different aspects such as Overview, Production Analysis, Quality Control, Cost & Revenue, and Plant Performance.
- Dynamic slicing and filtering to drill down data quickly.
- High-level KPI cards displaying total records, production costs, revenue, profit, and units produced.
- Comprehensive charts delivering detailed visual insights by battery type, production line, plant, and shift.
- Support and Data tabs with pivot table foundations to maintain dashboard dynamicity and ease of updates.
Dashboard Pages Explanation
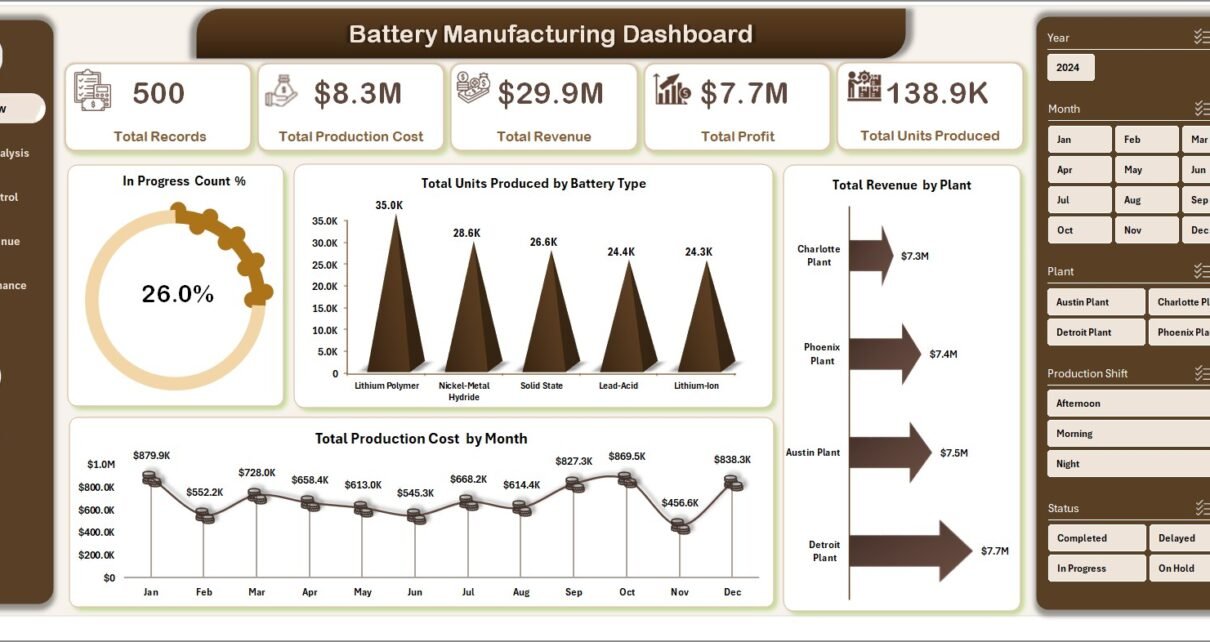
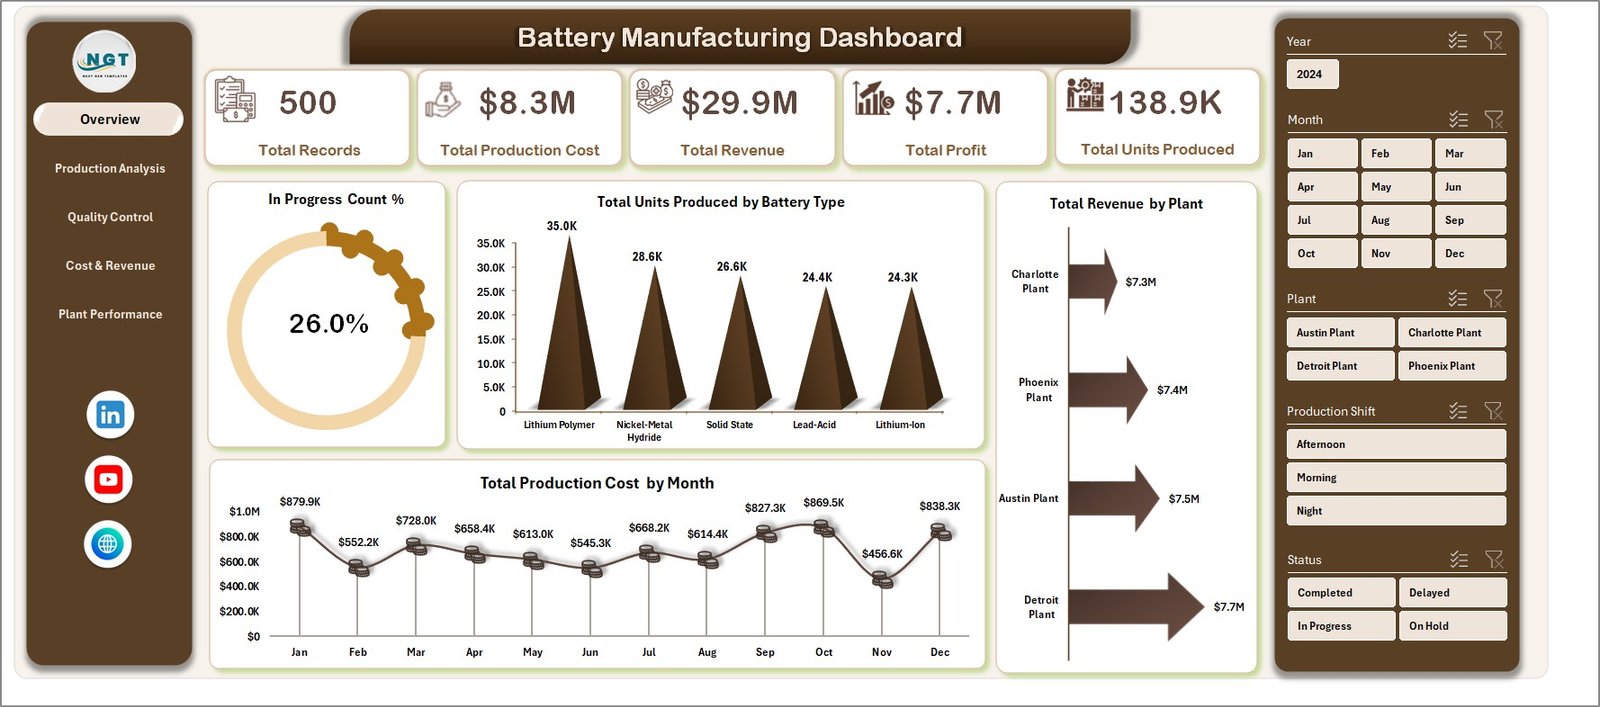
1 – Overview Page
The Overview page serves as the entry point for the dashboard with key performance indicator cards and multiple charts explaining production health.
- Cards:
- Total Records: Displays the count of all data entries currently loaded.
- Total Production Cost: Indicates the cumulative production expense.
- Total Revenue: Shows the overall income generated from battery sales.
- Total Profit: Demonstrates profit after deducting costs from revenue.
- Total Units Produced: Displays total battery units manufactured.
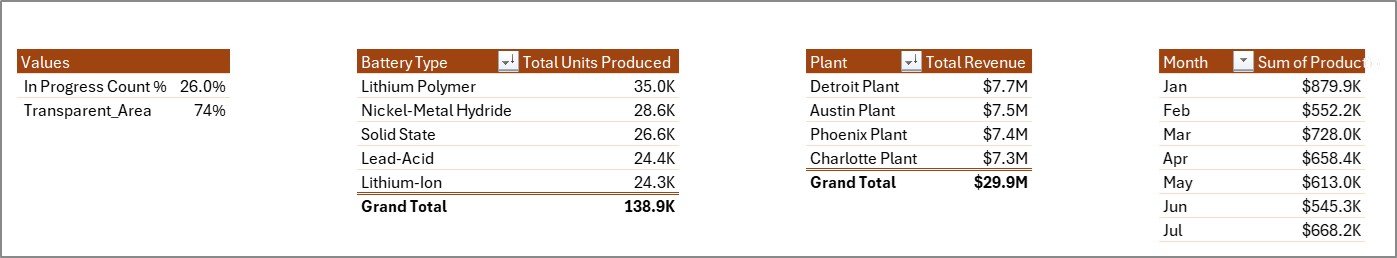
- Charts:
- In Progress Count %: Visualizes the percentage of production units currently in progress.
- Total Units Produced by Battery Type: Compares battery production volumes across different types.
- Total Production Cost by Month: Tracks monthly production costs to identify trends and spikes.
- Total Revenue by Plant: Visualizes revenue distribution among various manufacturing plants.
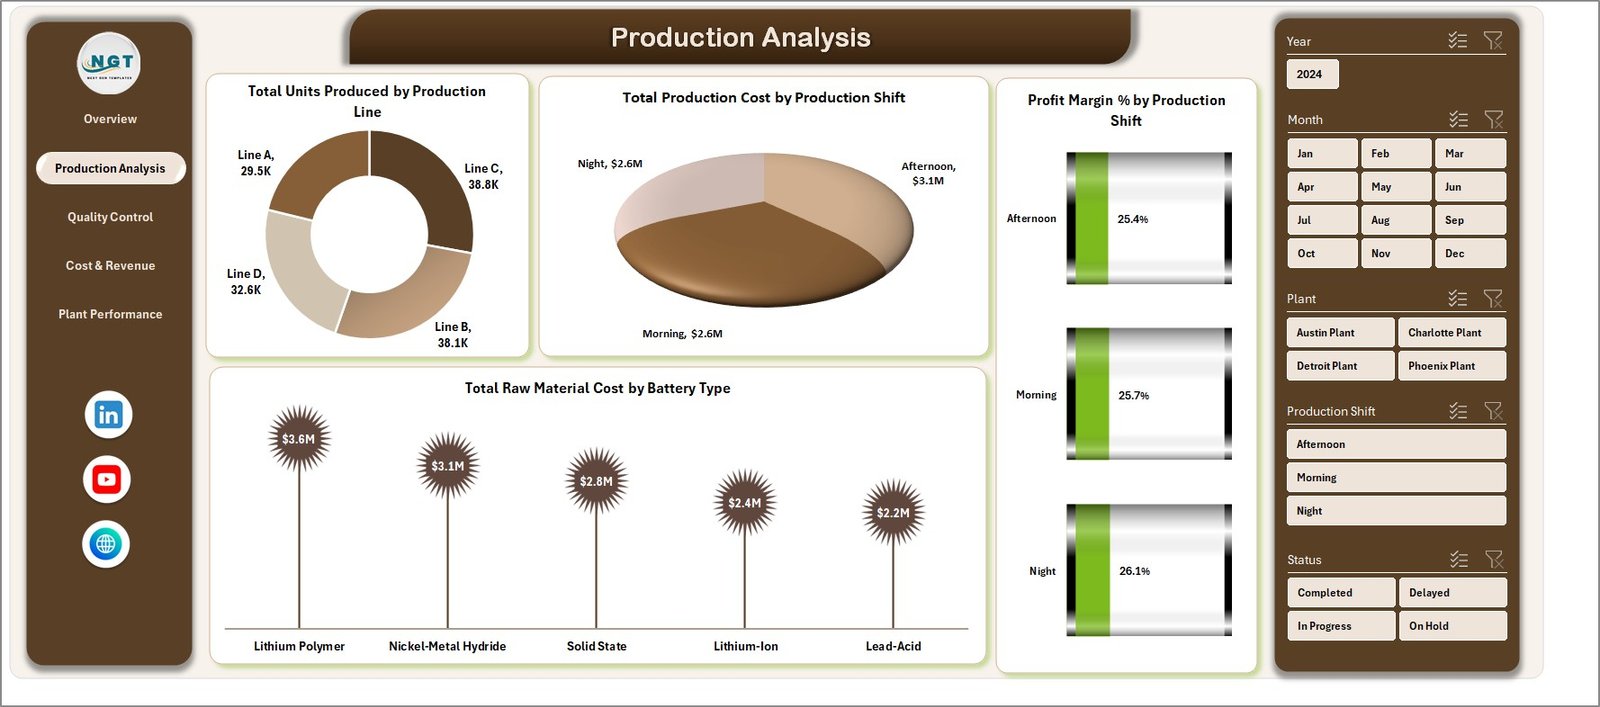
2 – Production Analysis
This sheet provides detailed production insights to measure efficiency across production lines and shifts.
- Total Units Produced by Production Line: Breakdown showing production volume per line for performance assessment.
- Total Production Cost by Production Shift: Highlights cost differences between shifts to optimize labor and resource allocation.
- Profit Margin % by Production Shift: Tracks profitability per shift to identify high-performing periods.
- Total Raw Material Cost by Battery Type: Compares raw material expenditure for different battery types, helping manage procurement.
Production Analysis
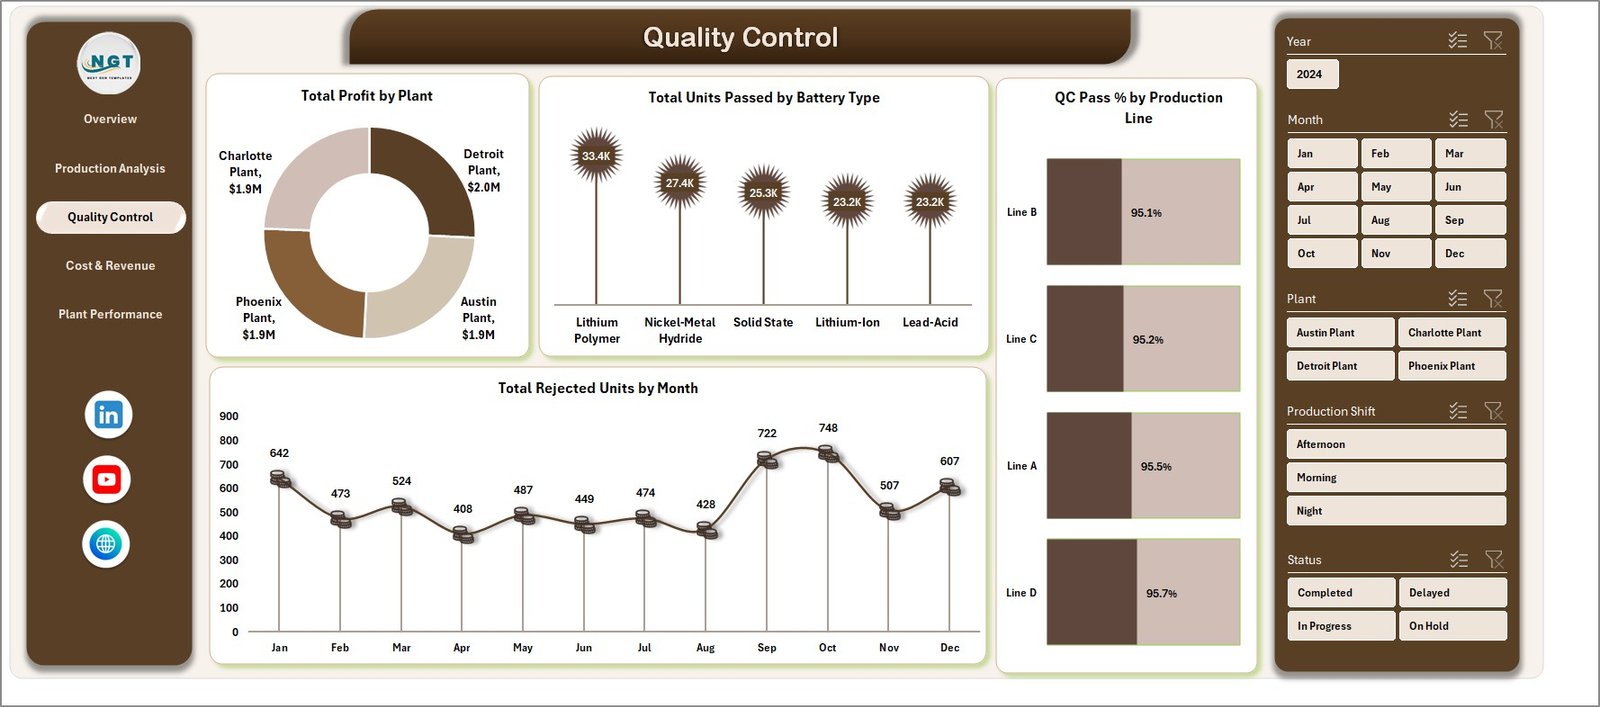
3 – Quality Control
Quality metrics to ensure production meets standards, minimizing defects and costs.
- Total Profit by Plant: Displays profit generated per plant, correlating quality controls impact.
- Total Units Passed by Battery Type: Shows quantity of batteries passing QC, aiding in product consistency tracking.
- QC Pass % by Production Line: Highlights quality success rates for each line.
- Total Rejected Units by Month: Presents defective unit trends over months to identify problem periods.
Quality Control
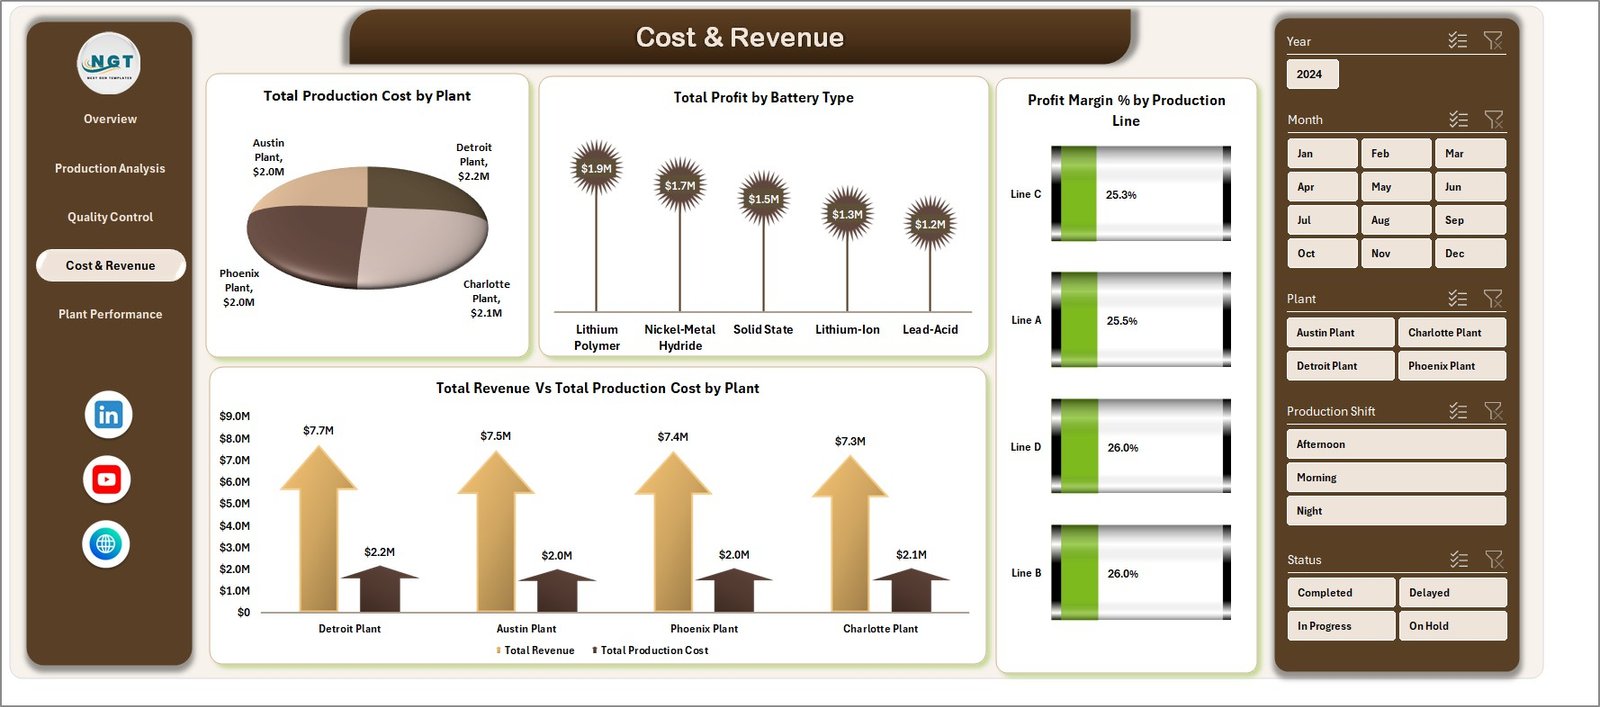
4 – Cost & Revenue
This section provides a financial overview linking costs and revenues for insightful profitability analysis.
- Total Production Cost by Plant: Compares costs incurred at different manufacturing plants.
- Total Profit by Battery Type: Identifies which battery types yield higher profits.
- Profit Margin % by Production Line: Assesses profitability variations across production lines.
- Total Revenue Vs Total Production Cost by Plant: Shows plant-wise revenue-to-cost ratios to pinpoint efficiency.
Cost & Revenue
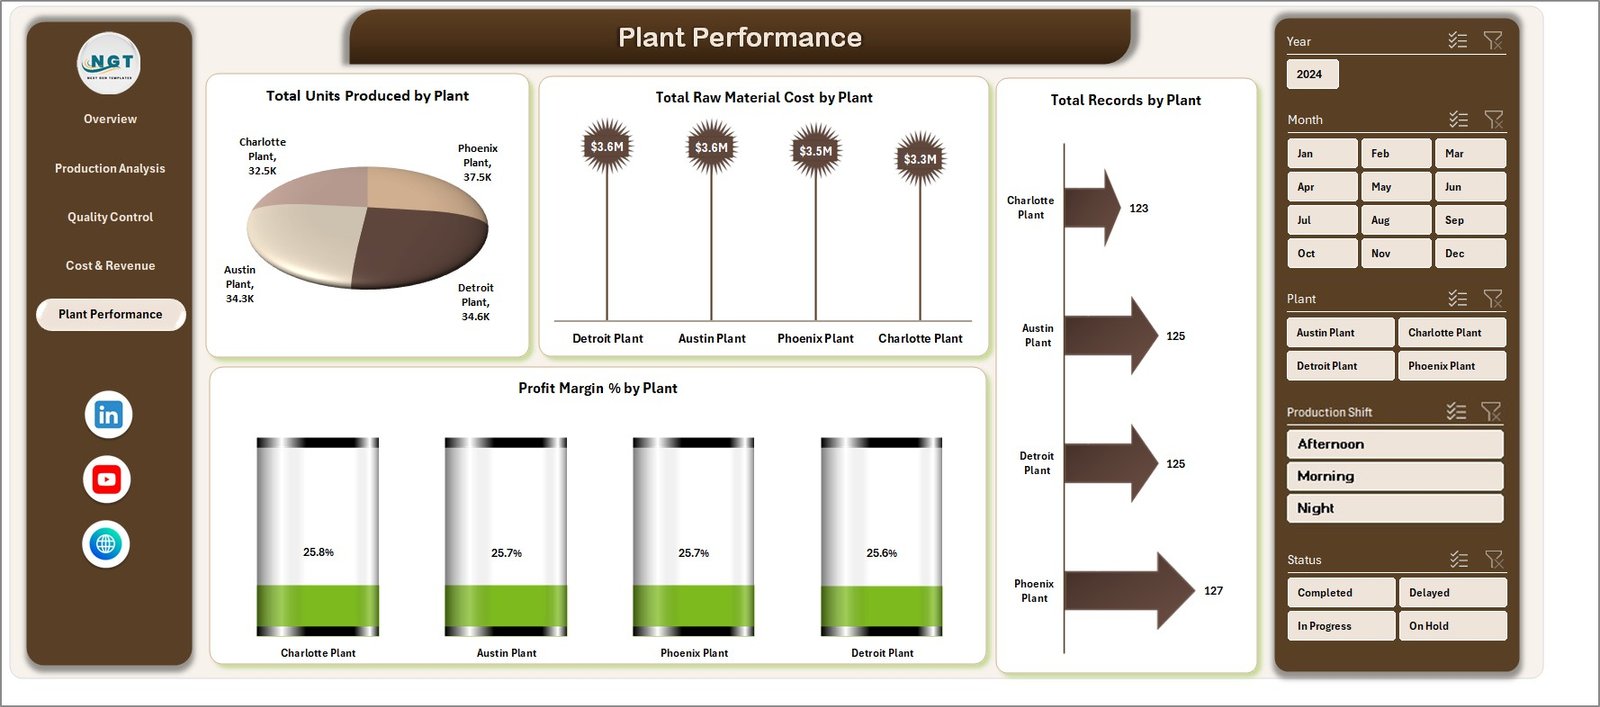
5 – Plant Performance
Highlights individual plant successes and challenges to drive operational improvements and strategic decisions.
- Total Units Produced by Plant: Quantifies output volumes for each plant.
- Total Raw Material Cost by Plant: Details raw material expenses per plant.
- Total Records by Plant: Shows data volume and activity level per location.
- Profit Margin % by Plant: Summarizes profitability measures by plant.
Plant Performance
6 – Data Sheet Tab
This is the core data entry area where all raw data must be entered or imported in the prescribed format to keep the dashboard updated. Always update this sheet before refreshing.

7 – Support Sheet
This sheet contains pivot tables which power the entire dashboard’s data processing and visualization. You can hide this sheet to keep the workbook clean.
After updating data, go to the Data tab in Excel Ribbon and click on Refresh All to update pivot tables and charts.
Advantages of Battery Manufacturing Dashboard
- Enables real-time visualization for quick decision-making.
- Provides a holistic view of production, costs, revenues, and quality metrics.
- Simplifies complex data through interactive visuals and slicers.
- Helps identify bottlenecks and areas of opportunity by production line, shift, or plant.
- Facilitates performance benchmarking across different plants and product types.
- Improves data accuracy by centralizing information updates in a single Data Sheet.
Opportunities for Improvement
- Integration with live production ERP data for real-time updates.
- Adding predictive analytics to forecast production trends and potential quality issues.
- Mobile-friendly dashboard versions for access on the go.
- User role-based views to limit data access and focus reporting.
- Automated alerts for deviations in KPIs like profit margin or defect rate.
Best Practices
- Always back up your data sheet before making bulk data changes.
- Use consistent naming conventions and data formats to avoid refresh errors.
- Test slicers and filters to ensure they work correctly after data updates.
- Limit manual entry errors by validating data before import.
- Regularly review dashboard KPIs to align with evolving business goals.
FAQs
- How do I update the dashboard with new data? Add your updated data in the Data sheet tab, then refresh all pivot tables and charts from the Data tab on the Excel Ribbon.
- Can I customize the charts? Yes, charts are based on pivot tables, allowing customization by editing pivot fields or chart formats.
- Is this dashboard compatible with Google Sheets? It is optimized for Excel, though some features may work in Google Sheets with limitations.
- How do slicers affect the dashboard? Slicers allow you to filter data dynamically, providing targeted insights based on selected criteria.
- Can I add more battery types or plants? Yes, just include new entries in the Data sheet formatted consistently for automatic inclusion upon refresh.
Conclusion
The Battery Manufacturing Dashboard offers a powerful solution to visualize, analyze, and optimize battery production metrics seamlessly. It empowers managers with instant access to production volumes, quality stats, cost breakdowns, and profitability analyses through a user-friendly yet flexible interface. By maintaining updated data and utilizing the built-in slicers and pivot-driven charts, manufacturers can make data-backed decisions that enhance operation efficiency and profitability.
For those seeking to improve manufacturing insights with minimal setup, this dashboard is a valuable asset.
Click to Purchases Battery Manufacturing Dashboard in Excel
For more detailed demonstrations, visit our YouTube channel to watch the demo.
Learn more about Excel dashboards from Microsoft Excel Support.