In today’s fast-moving business world, companies must make quick and accurate decisions. However, many businesses still rely on scattered data and manual reports. As a result, they struggle to compare performance, track KPIs, and identify growth opportunities.
So, how can you bring all your business insights into one place and make better decisions faster?
The answer is simple — Benchmarking and Insights Dashboard in Excel.
In this complete guide, you will learn everything about this powerful dashboard. Moreover, you will understand its features, benefits, use cases, and best practices. By the end, you will know exactly how to use this dashboard to improve performance and stay ahead of the competition.
Click to buy Benchmarking and Insights Dashboard in Excel
What is a Benchmarking and Insights Dashboard in Excel?
A Benchmarking and Insights Dashboard in Excel is a ready-to-use analytical tool that helps businesses compare their performance against industry benchmarks.
Instead of working with multiple reports, you can use this dashboard to:
- Track revenue and profit trends
- Compare company performance with industry standards
- Analyze KPIs across categories
- Identify strengths and weaknesses
- Make data-driven decisions
Moreover, since it is built in Excel, it is easy to use, flexible, and highly customizable.
Why is Benchmarking Important for Businesses?
Before we dive deeper, let’s understand why benchmarking matters.
How Does Benchmarking Help Businesses Grow?
Benchmarking allows companies to compare their performance with competitors or industry standards. As a result, businesses can:
- Identify performance gaps
- Improve efficiency
- Set realistic goals
- Increase profitability
Furthermore, benchmarking provides clarity. Instead of guessing, you can rely on actual data to make decisions.
What Does This Dashboard Include?
This ready-to-use dashboard includes multiple sheet tabs. Each tab focuses on a specific area of analysis. Therefore, users can explore data in detail without confusion.
Let’s explore each section step by step.
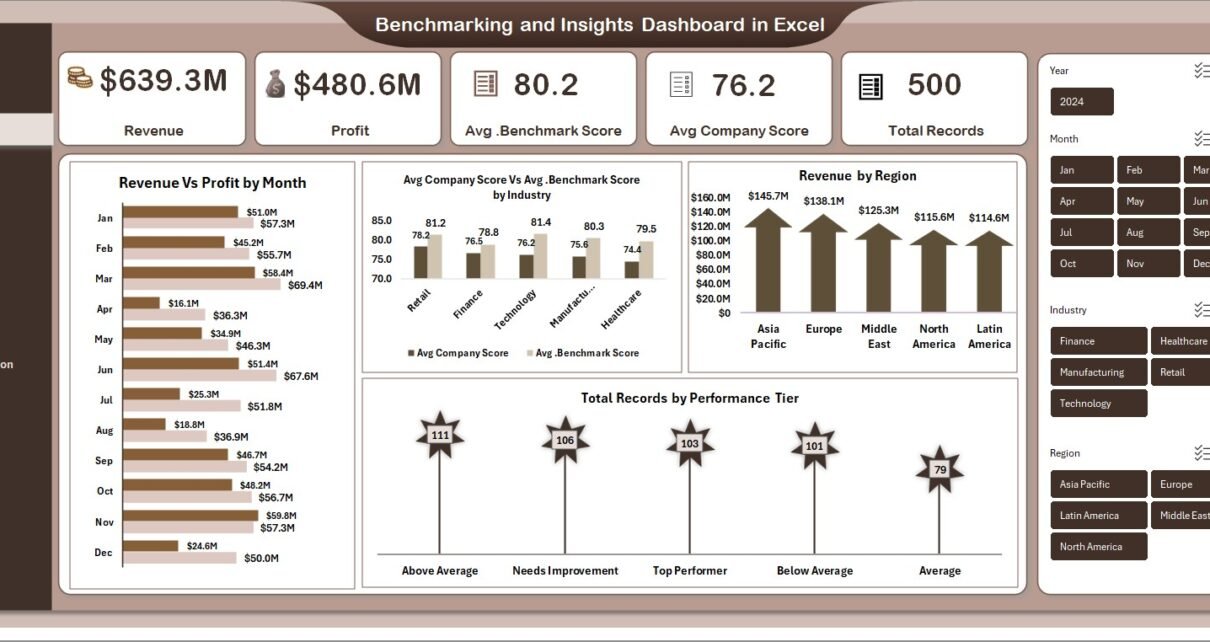
Overview Sheet: What Can You Learn at a Glance?
The Overview sheet provides a high-level summary of your business performance. It helps decision-makers quickly understand key metrics.
Key Metrics Displayed
- Revenue
- Profit
- Average Benchmark Score
- Average Company Score
- Total Records
Charts and Insights
- Revenue vs Profit by Month
→ Understand monthly performance trends - Avg Company Score vs Benchmark Score by Industry
→ Compare company performance with industry standards - Revenue by Region
→ Identify high-performing regions - Total Records by Performance Tier
→ Analyze performance distribution
As a result, this sheet acts as a quick decision-making hub.

Click to buy Benchmarking and Insights Dashboard in Excel
Industry Analysis: How Do Different Industries Perform?
The Industry Analysis sheet helps you understand how various industries perform.
Key Insights You Can Get
- Revenue vs Profit by Industry
- Average Market Share by Industry
- Profit Margin % by Industry
- Average Achievement Rate by Industry
Why This Matters?
With this sheet, you can:
- Identify profitable industries
- Compare performance across sectors
- Spot growth opportunities
Moreover, you can easily adjust strategies based on industry trends.

Click to buy Benchmarking and Insights Dashboard in Excel
KPI Deep Dive: How Are Your KPIs Performing?
The KPI Deep Dive sheet provides detailed insights into key performance indicators.
Metrics Covered
- Avg Benchmark Score vs Avg Company Score by KPI Category
- Cost by KPI Category
- Total Records by KPI Category
- Avg Achievement Rate by KPI Category
Benefits of KPI Analysis
- Understand which KPIs perform well
- Identify underperforming areas
- Optimize business processes
In addition, this sheet helps you focus on what truly matters.

Click to buy Benchmarking and Insights Dashboard in Excel
Region Analysis: Which Regions Drive Growth?
The Region Analysis sheet focuses on geographical performance.
Key Visuals
- Revenue vs Profit by Region
- Avg Company Score by Region
- Total Records by Region
- Profit Margin % by Region
Why is Regional Analysis Important?
Because not all regions perform equally, this sheet helps you:
- Identify top-performing regions
- Detect low-performing areas
- Allocate resources effectively
Therefore, you can improve overall performance.

Click to buy Benchmarking and Insights Dashboard in Excel
Company Comparison: How Does Your Company Compare?
The Company Comparison sheet allows you to compare different companies.
Key Metrics
- Profit Margin % by Company Name
- Revenue by Company Name
- Total Records by Company Name
Insights You Can Gain
- Identify leading companies
- Compare performance across competitors
- Benchmark your company effectively
As a result, you can position your business better in the market.

Click to buy Benchmarking and Insights Dashboard in Excel
How Does This Dashboard Improve Decision-Making?
Now you may wonder — how exactly does this dashboard help?
Key Advantages in Decision-Making
- Provides real-time insights
- Reduces manual work
- Improves data accuracy
- Enhances visibility across departments
Moreover, it allows you to make faster and smarter decisions.
Advantages of Benchmarking and Insights Dashboard in Excel
Let’s explore the major benefits of using this dashboard.
Key Advantages
- Centralized Data View
→ All important data in one place - Easy to Use
→ No advanced technical skills required - Time-Saving
→ Eliminates manual reporting - Better Comparisons
→ Compare performance across industries and regions - Improved Accuracy
→ Reduce human errors - Customizable
→ Modify according to business needs - Cost-Effective
→ No need for expensive tools
Opportunities for Improvement in Benchmarking
Even though this dashboard is powerful, there is always room for improvement.
Areas to Improve
- Update data regularly
- Add more KPIs if required
- Improve data quality
- Use automation for faster updates
- Integrate with external data sources
By doing so, you can enhance dashboard performance.
Best Practices for the Benchmarking and Insights Dashboard in Excel
To get the best results, you should follow these best practices.
Best Practices
- Keep Data Clean and Structured
→ Ensure accuracy - Use Consistent KPIs
→ Avoid confusion - Update Data Frequently
→ Keep insights relevant - Focus on Key Metrics Only
→ Avoid clutter - Use Visuals Effectively
→ Improve readability - Validate Data Regularly
→ Maintain reliability - Train Users
→ Ensure proper usage
Who Can Benefit from This Dashboard?
This dashboard works for various professionals and industries.
Target Users
- Business Analysts
- Managers and Executives
- Finance Teams
- Consultants
- Data Analysts
Industries
- Manufacturing
- Retail
- Healthcare
- IT Services
- Finance
Therefore, this dashboard suits almost every business type.
How to Use the Benchmarking Dashboard Effectively?
Let’s understand how you can use this dashboard step by step.
Step-by-Step Guide
- Input Your Data
→ Add company and industry data - Refresh the Dashboard
→ Update all visuals - Analyze the Overview Page
→ Check key metrics - Explore Detailed Pages
→ Dive into industry, KPI, and region analysis - Compare with Benchmarks
→ Identify gaps - Take Action
→ Improve performance
Common Challenges in Benchmarking (And How to Solve Them)
Even though benchmarking is useful, it comes with challenges.
Challenges
- Inconsistent data
- Lack of clear KPIs
- Data overload
- Poor visualization
Solutions
- Standardize data
- Define clear KPIs
- Focus on important metrics
- Use interactive dashboards
Why Choose Excel for Benchmarking Dashboards?
You may wonder why Excel is still a popular choice.
Key Reasons
- Widely available
- Easy to use
- Highly flexible
- Supports powerful visualizations
- Works well with large datasets
Moreover, Excel allows full customization without additional costs.
Conclusion: Why This Dashboard is a Game-Changer?
To sum up, the Benchmarking and Insights Dashboard in Excel is a powerful tool for modern businesses.
It not only simplifies data analysis but also improves decision-making. Moreover, it helps businesses compare performance, identify opportunities, and drive growth.
Therefore, if you want to make smarter decisions and stay competitive, this dashboard is a must-have.
Frequently Asked Questions (FAQs)
- What is benchmarking in Excel?
Benchmarking in Excel means comparing your business performance with industry standards using data and dashboards.
- Is this dashboard suitable for beginners?
Yes, absolutely. Since it is built in Excel, beginners can easily use and understand it.
- Can I customize this dashboard?
Yes, you can fully customize it based on your business needs and KPIs.
- How often should I update the dashboard?
You should update it regularly (daily, weekly, or monthly) depending on your business requirements.
- What type of data is required?
You need data related to revenue, profit, KPIs, regions, industries, and company performance.
- Does this dashboard support real-time data?
Excel dashboards do not update automatically. However, you can refresh the data manually or use automation tools.
- Can small businesses use this dashboard?
Yes, small businesses can use it to track performance and improve decision-making.
Click to buy Benchmarking and Insights Dashboard in Excel
Visit our YouTube channel to learn step-by-step video tutorials