Introduction
The Carbon Capture Firms Dashboard is a powerful, ready-to-use Excel dashboard designed to provide insightful analysis of carbon capture firms’ data. By simply updating the data in the Data sheet and refreshing the dashboard, users can monitor key metrics such as revenue, CO2 captured, funding, and more. This dashboard simplifies complex data into visual, interactive insights that help stakeholders make informed decisions.
Click to Purchases Carbon Capture Firms Dashboard in Excel
Key Features of Carbon Capture Firms Dashboard
- Ready-to-use with dynamic data refresh capability via Excel Ribbon.
- Multiple pages tailored to different aspects of carbon capture firm analysis.
- High-level overview cards summarizing key metrics.
- Interactive charts with slicers for quick filtering and detailed data segmentation.
- Divided into logical tabs: Overview, Capture Analysis, Financial Overview, Compliance Report, Project Pipeline, Data Sheet, and Support Sheet.
Dashboard Pages Explanation
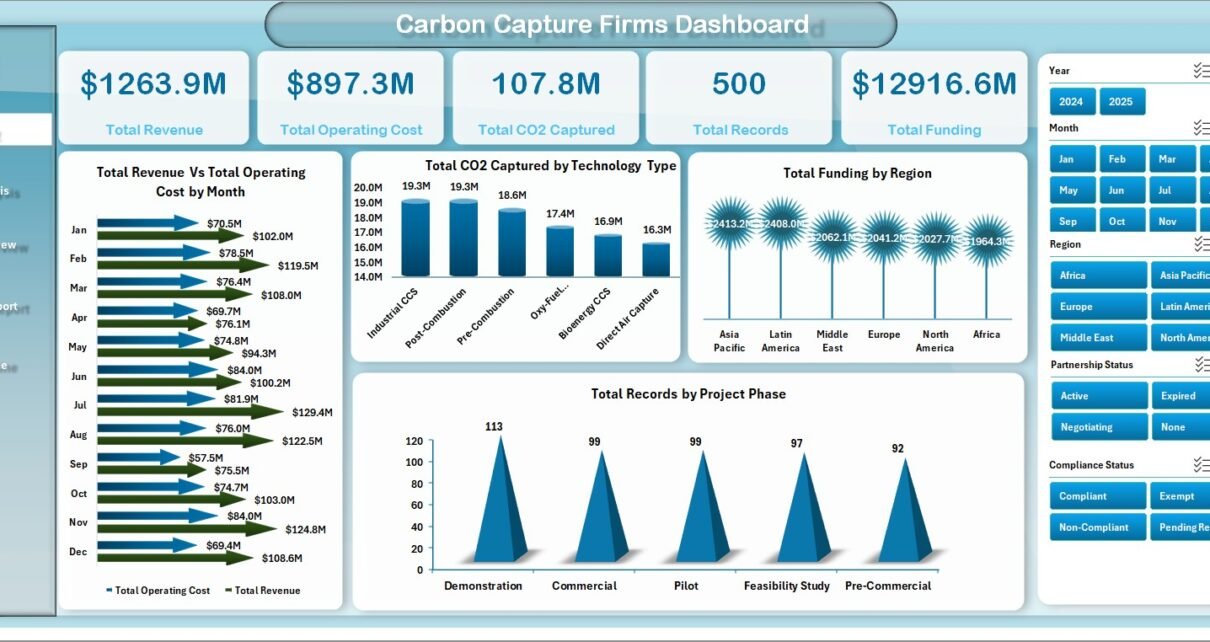
1. Overview Page
The Overview page provides a snapshot of the dashboard’s key metrics through cards and charts, making it easy to grasp overall performance quickly.
- Cards: Display Total Revenue, Total Operating Cost, Total CO2 Captured, Total Records, and Total Funding Raised.
- Revenue and Operating Cost by Month: Tracks monthly trends, highlighting periods of high costs or revenue.
- CO2 Captured by Technology Type: Breaks down carbon capture volumes based on technology, identifying the most effective methods.
- Total Funding by Region: Visualizes regional capital investments, pinpointing funding hotspots.
- Records by Project Phase: Shows the distribution of projects across different stages for better pipeline understanding.
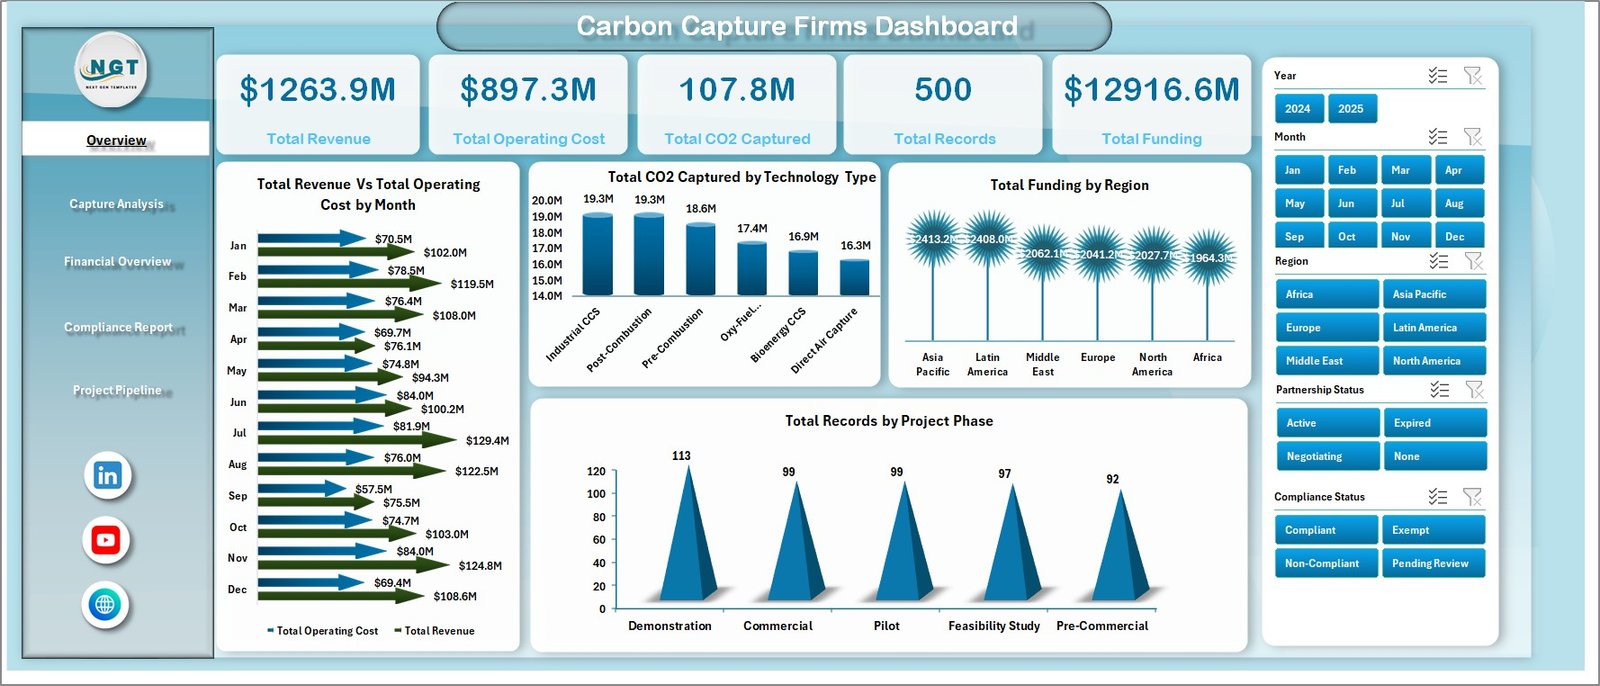
Carbon Capture Firms Dashboard
2. Capture Analysis
- CO2 Captured and Capture Capacity by Technology: Compares how much carbon each technology captures versus its total capacity.
- CO2 Captured by Storage Method: Highlights which storage methods are most utilized across projects.
- Capture Rate % by Region: Shows effectiveness of capture efforts on a regional basis.
- CO2 Captured by Project Phase: Indicates how carbon capture evolves with project maturity stages.
-
Click to Purchases Carbon Capture Firms Dashboard in Excel
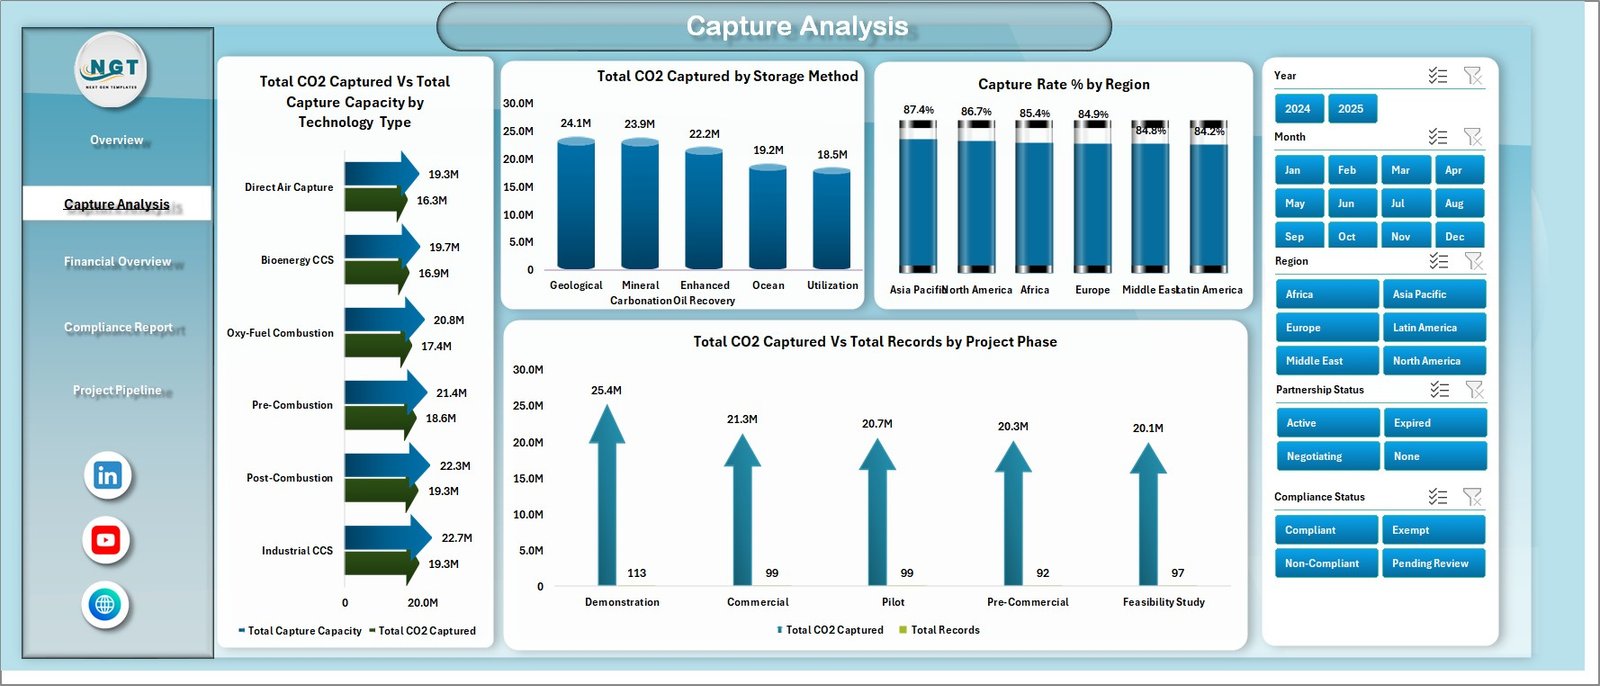
Capture Analysis
3. Financial Overview
- Revenue and Operating Cost by Region: Details financial performance geographic breakdown.
- Revenue and Operating Cost by Technology Type: Compares financial outcomes of different carbon capture technologies.
- Operating Cost by Region: Pinpoints costly areas to optimize.
- Records by Technology Type: Shows the count of projects by technology for business insights.
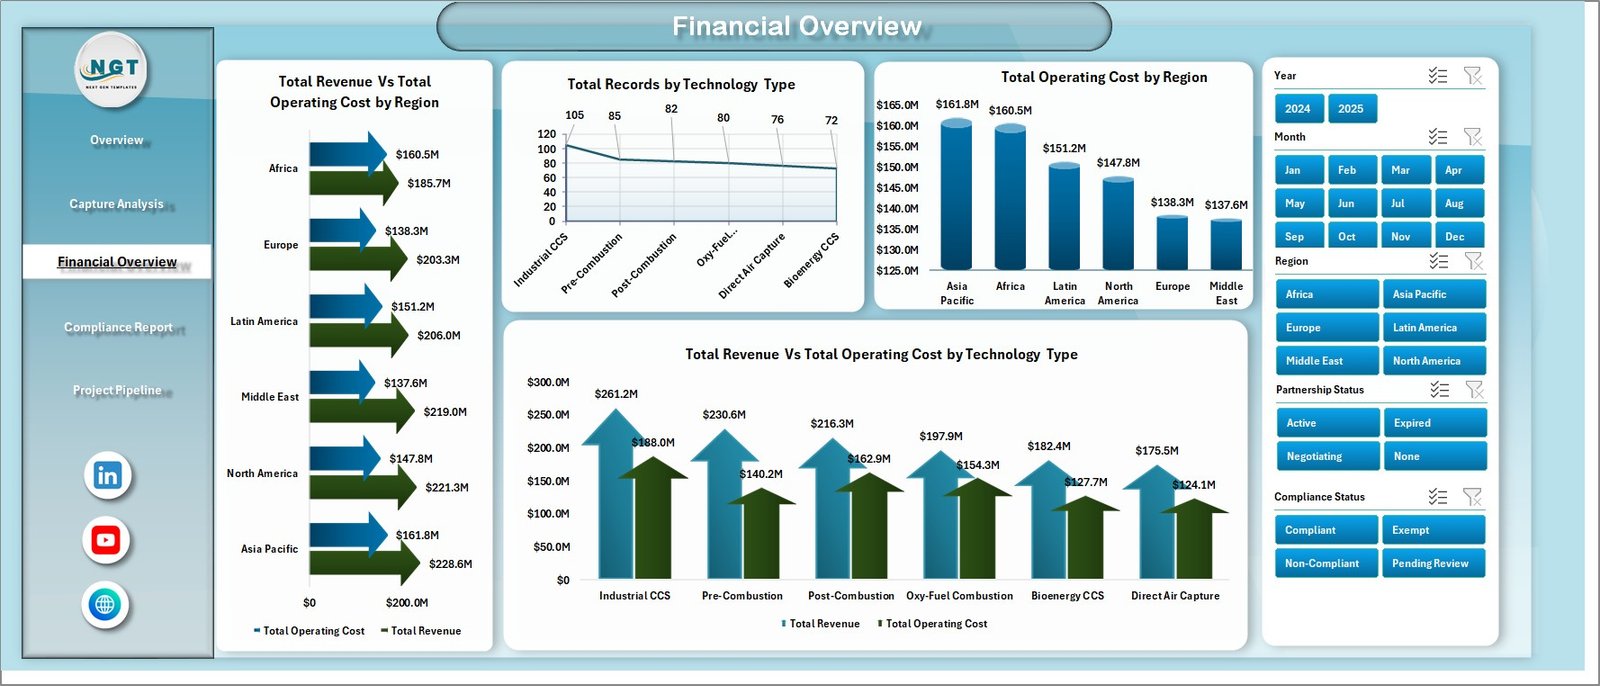
Financial Overview
4. Compliance Report
- Total Compliant by Region: Measures compliance rates geographically.
- Total Compliant and Total Records by Technology Type: Examines regulatory adherence per technology.
- Total Compliant by Project Phase: Tracks compliance as projects progress.
- Total Revenue Vs Total Operating Cost by Firm Name: Provides firm-level financial and compliance insights.
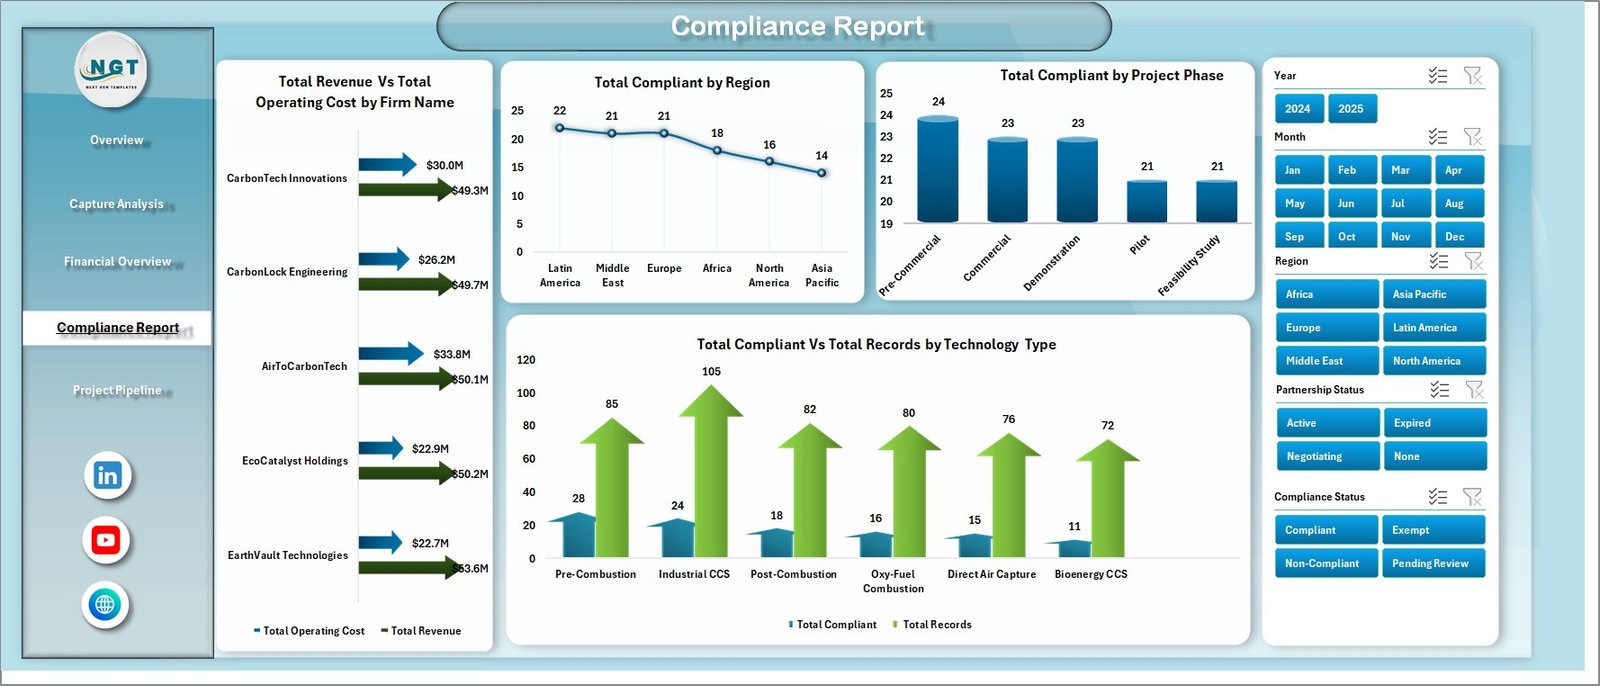
Compliance Report
5. Project Pipeline
- Total Funding by Project Phase in a Bar Chart: Visualizes investment levels across project stages.
- Total Records by Partnership Status: Highlights collaboration activity.
- Total Commercial by Region: Displays active commercial projects by geography.
-
Click to Purchases Carbon Capture Firms Dashboard in Excel
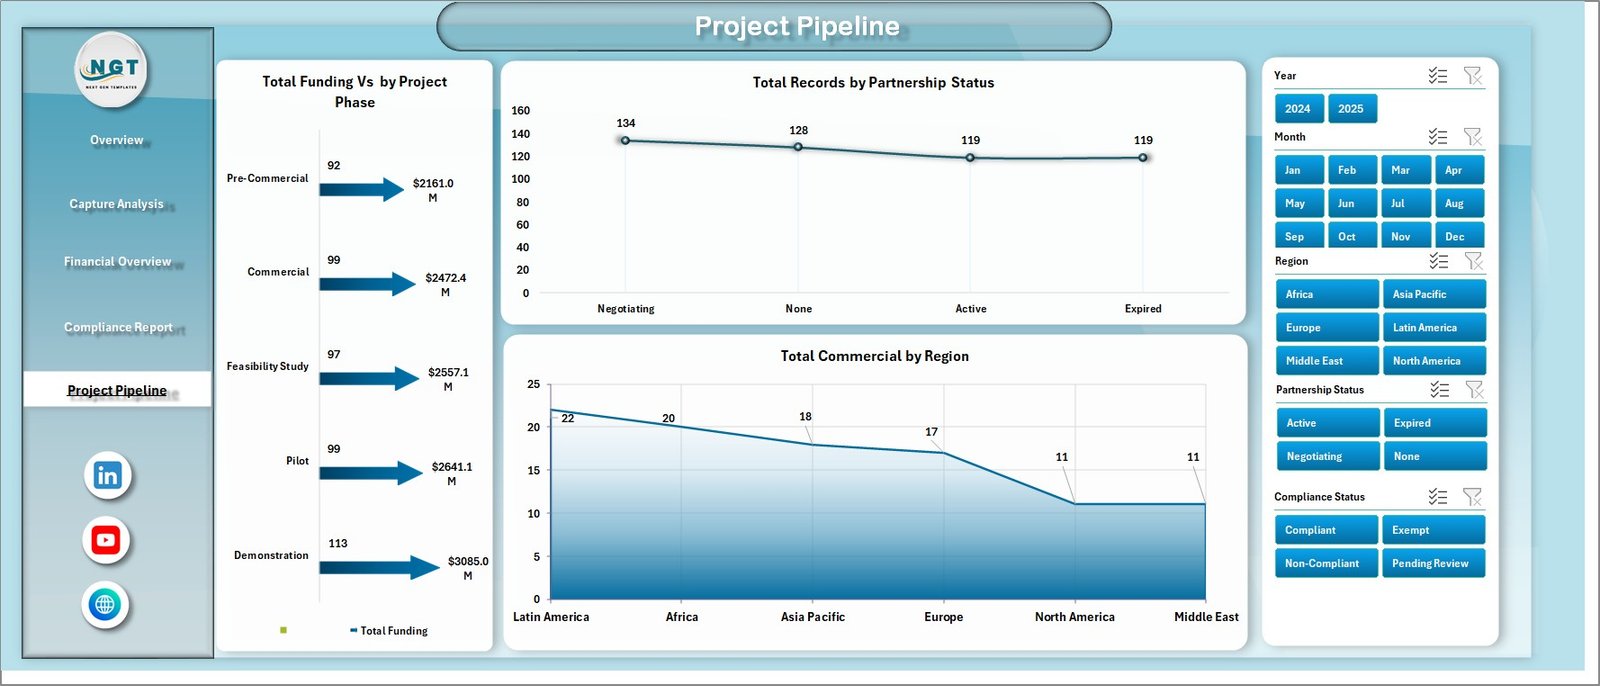
Project Pipeline
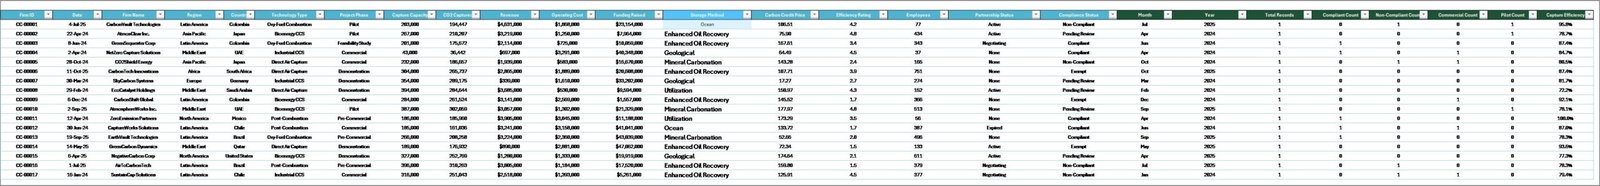
6. Data Sheet Tab
This tab holds the raw data, which is key for accurate dashboard performance. Users must input data in the specified format for seamless refreshing.

Data Sheet tab
7. Support Sheet
The backbone of the dashboard, this sheet contains pivot tables supporting dynamic visuals. Refreshing data here leads to the dashboard’s automated updates. It’s typically kept hidden for better user experience.
Support sheet tab
Advantages of Carbon Capture Firms Dashboard
- Ease of Use: Simple data update process with immediate dashboard refresh.
- Comprehensive Analysis: Multi-dimensional data insights spanning financials, operational stats, compliance, and project pipelines.
- Interactive Filtering: Slicers allow custom views tailored to user needs.
- Visual Clarity: Intuitive charts and cards enable at-a-glance understanding.
- Time-saving: Automates complex data aggregation and reporting.
Opportunities for Improvement
- Integrate real-time data connectivity with external databases or APIs.
- Add predictive analytics for forecasting funding needs or capture rates.
- Incorporate scenario modeling to assess impact of technological shifts.
- Expand geographical granularity, e.g., country or site-level views.
- Implement mobile-friendly dashboard versions for on-the-go access.
Best Practices
- Always backup your data before refreshing or making significant changes.
- Ensure consistent data formatting in the Data Sheet to avoid refresh errors.
- Use slicers to explore specific segments without altering raw data.
- Regularly update the Support Sheet pivots by using the ‘Refresh All’ function.
- Train key stakeholders on interpreting charts for maximum impact.
FAQs
- How do I update the dashboard with new data?
Simply enter your new data into the Data Sheet tab, then go to the Data tab in the Excel ribbon and click Refresh All. The dashboard will update automatically.
- Can I customize the charts?
Yes, since this dashboard is built in Excel, you can modify charts and slicers as needed.
- Is this dashboard compatible with Excel Online?
Some features like pivot refresh may be limited in Excel Online. Desktop Excel is recommended for full functionality.
- Can I add more metrics?
You can expand the Data Sheet and create additional pivot tables or charts in the Support Sheet to support new metrics.
- Is the dashboard printable?
Yes, but formatting might need adjustment to ensure all visuals fit correctly.
Conclusion
The Carbon Capture Firms Dashboard is an indispensable tool for businesses and analysts looking to monitor and optimize carbon capture initiatives. By aggregating financial, operational, and compliance data into interactive, user-friendly visuals, it empowers users to make data-driven decisions effectively. Its ready-to-use nature combined with powerful analysis capabilities makes it ideal for accelerating carbon capture project insights.
For more advanced data management techniques, explore Microsoft Excel Support. To see the dashboard in action, visit our YouTube channel to watch the demo.
Click to Purchases Carbon Capture Firms Dashboard in Excel