In today’s competitive business world, companies must make faster and smarter decisions. However, many organizations still rely on scattered spreadsheets and manual reports. As a result, they struggle to track performance, compare benchmarks, and identify growth opportunities.
So, how can you analyze performance across industries, regions, and KPIs in one place?
The answer is simple: Benchmarking and Insights Dashboard in Power BI
This powerful and interactive dashboard helps businesses compare their performance against industry standards. Moreover, it provides clear insights into revenue, profit, cost, and KPI performance. As a result, decision-makers can act quickly and confidently.
In this complete guide, you will learn everything about this dashboard, including its features, benefits, best practices, and frequently asked questions.
Click to buy Benchmarking and Insights Dashboard in Power BI
What is a Benchmarking and Insights Dashboard in Power BI?
A Benchmarking and Insights Dashboard in Power BI is a data visualization tool that allows businesses to compare their performance with industry benchmarks.
Instead of using multiple reports, this dashboard brings everything into one centralized view. Therefore, users can easily track key metrics such as revenue, cost, profit, and performance scores.
Why is Benchmarking Important?
Benchmarking helps businesses understand where they stand in the market. In addition:
- It highlights strengths and weaknesses
- It improves decision-making
- It identifies growth opportunities
- It ensures better performance tracking
Because of these reasons, companies across industries use benchmarking dashboards to stay competitive.
Why Should You Use Power BI for Benchmarking?
Power BI offers powerful features that make benchmarking easy and effective. Let’s explore why it is the best choice.
Key Reasons to Use Power BI
- Interactive Visuals: Users can explore data using charts and graphs
- Real-Time Updates: Data refresh ensures up-to-date insights
- Custom Filters (Slicers): Easily filter data by region, KPI, or industry
- Trend Analysis: Track performance over time
- Data Integration: Connect multiple data sources seamlessly
Therefore, Power BI becomes an ideal tool for creating benchmarking dashboards.
What Are the Key Features of Benchmarking and Insights Dashboard in Power BI?
This dashboard includes 5 powerful pages, each designed to provide specific insights. Let’s explore each page in detail.
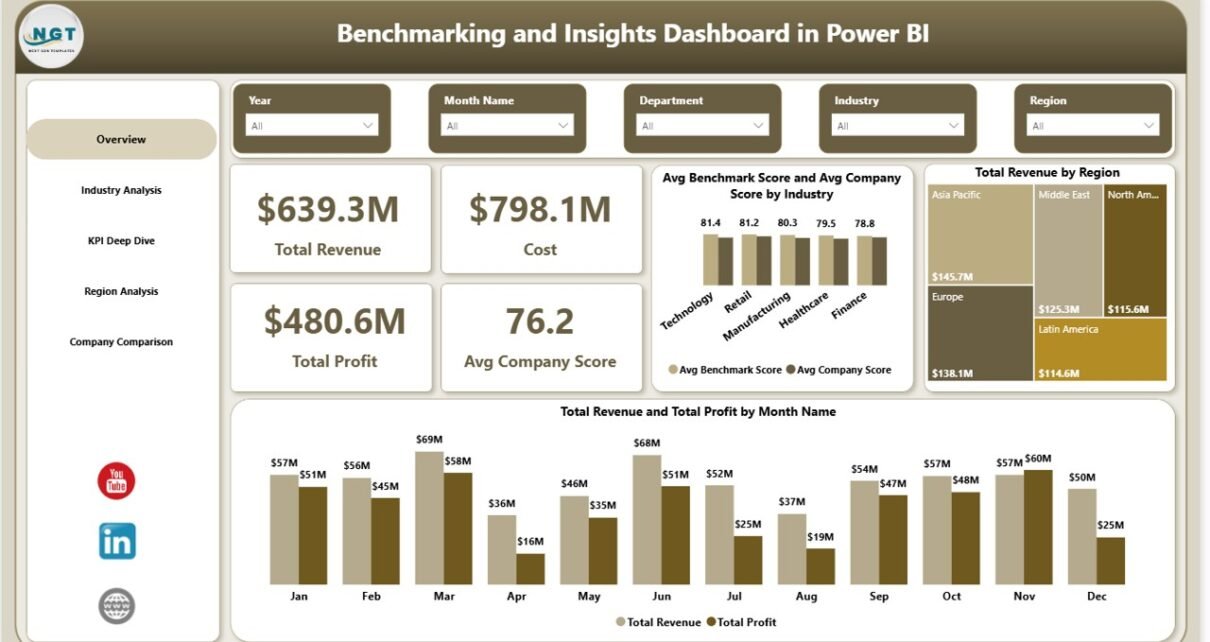
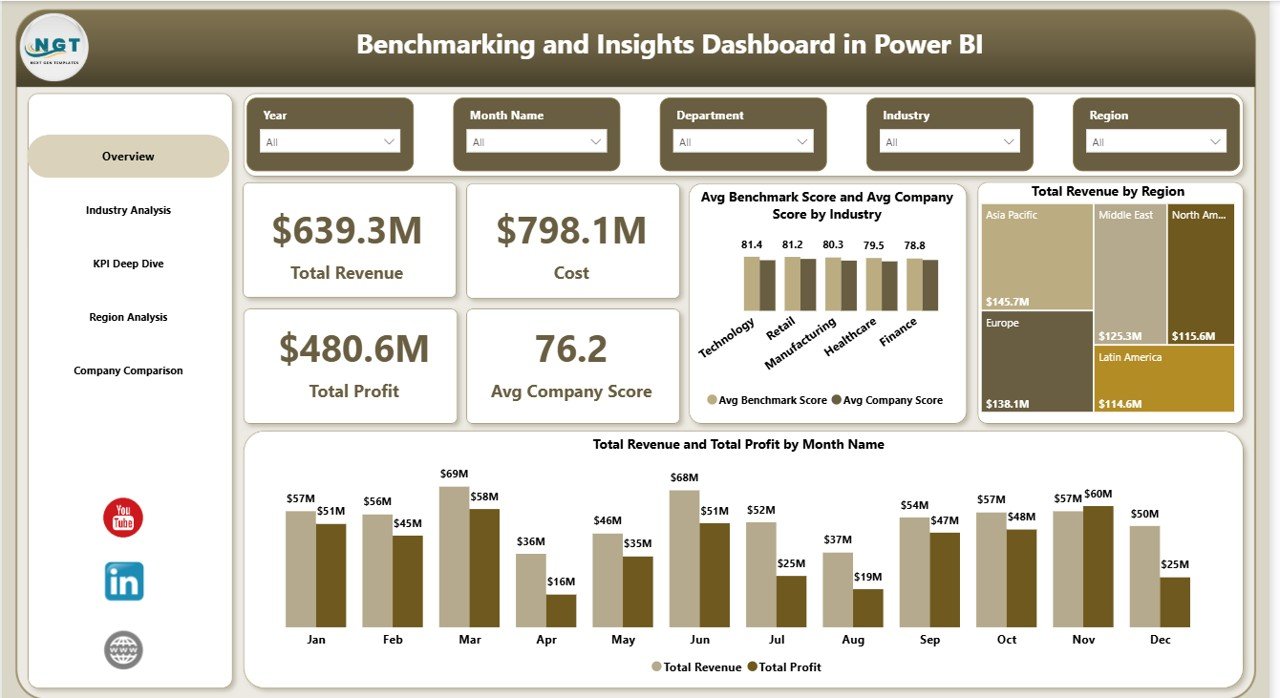
Overview Page: How Does It Provide a Quick Snapshot?
The Overview Page acts as the main dashboard. It gives a high-level summary of business performance.
Key KPIs (Cards)
- Total Revenue – Displays overall income
- Cost – Shows total expenses
- Total Profit – Calculates profit after cost deduction
- Average Company Score – Indicates overall performance rating
Charts Included
- Average Benchmark Score vs Company Score by Industry
- Total Revenue by Region
- Total Revenue and Profit by Month
Because of this layout, users can quickly understand performance without going into details.
Click to buy Benchmarking and Insights Dashboard in Power BI
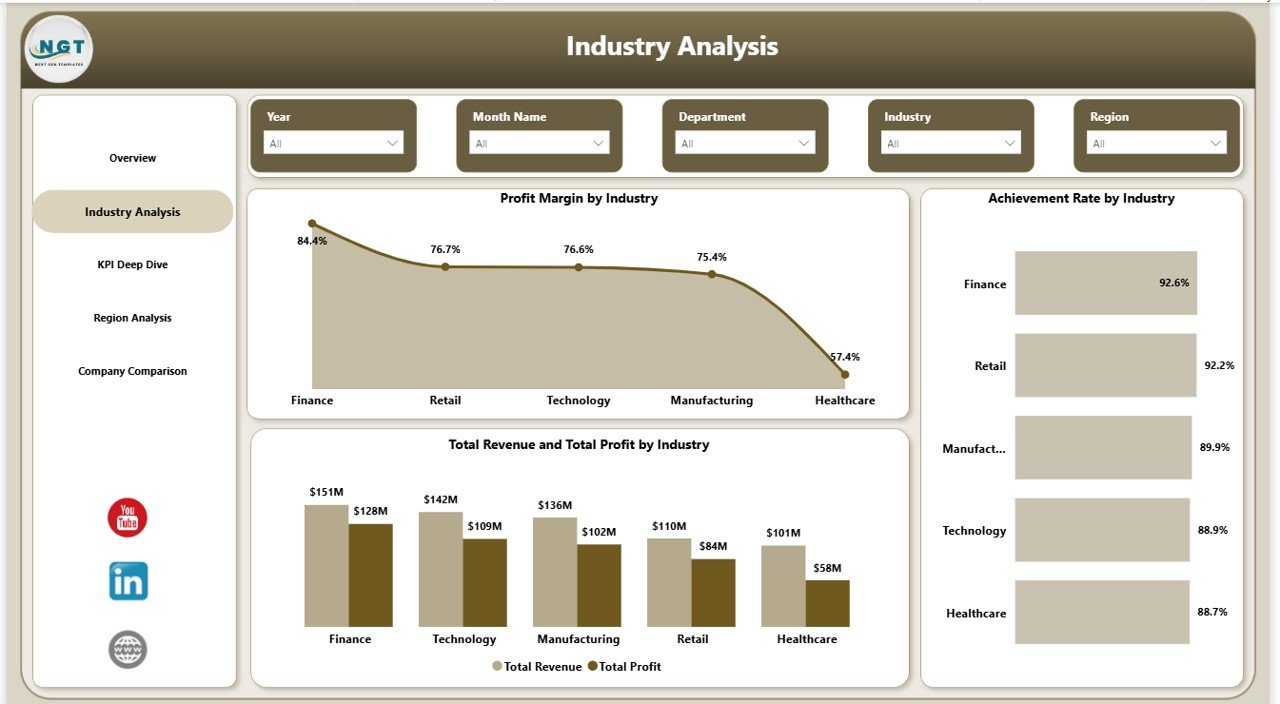
Industry Analysis: How Does It Help Compare Industries?
The Industry Analysis Page focuses on comparing performance across different industries.
Charts Included
- Profit Margin by Industry
- Achievement Rate by Industry
- Total Revenue and Profit by Industry
Why This Page Matters
This page helps you:
- Identify high-performing industries
- Compare profitability across sectors
- Understand where your company stands
As a result, businesses can make better strategic decisions.
Click to buy Benchmarking and Insights Dashboard in Power BI
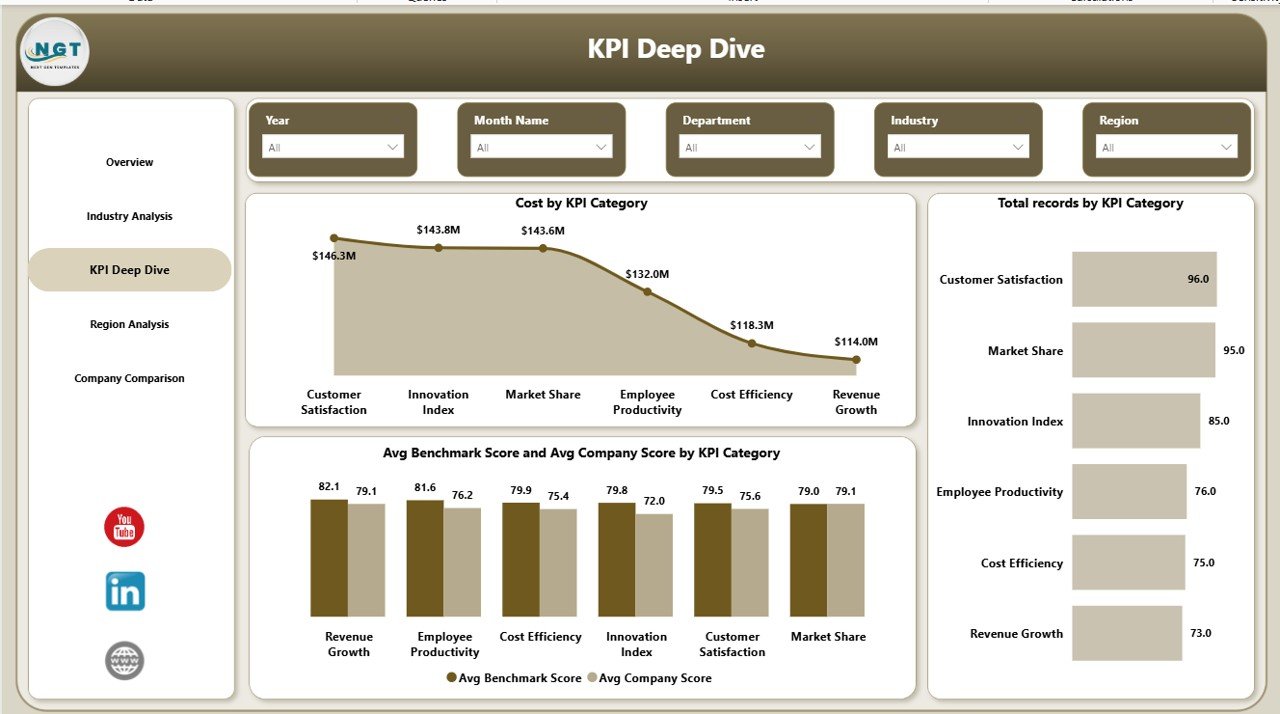
KPI Deep Dive: How Can You Analyze KPIs Effectively?
The KPI Deep Dive Page provides detailed insights into different KPI categories.
Charts Included
- Cost by KPI Category
- Total Records by KPI Category
- Average Benchmark Score vs Company Score by KPI Category
Benefits of KPI Deep Dive
- Understand which KPIs drive performance
- Identify areas with high costs
- Compare company performance with benchmarks
Therefore, this page helps improve operational efficiency.
Click to buy Benchmarking and Insights Dashboard in Power BI
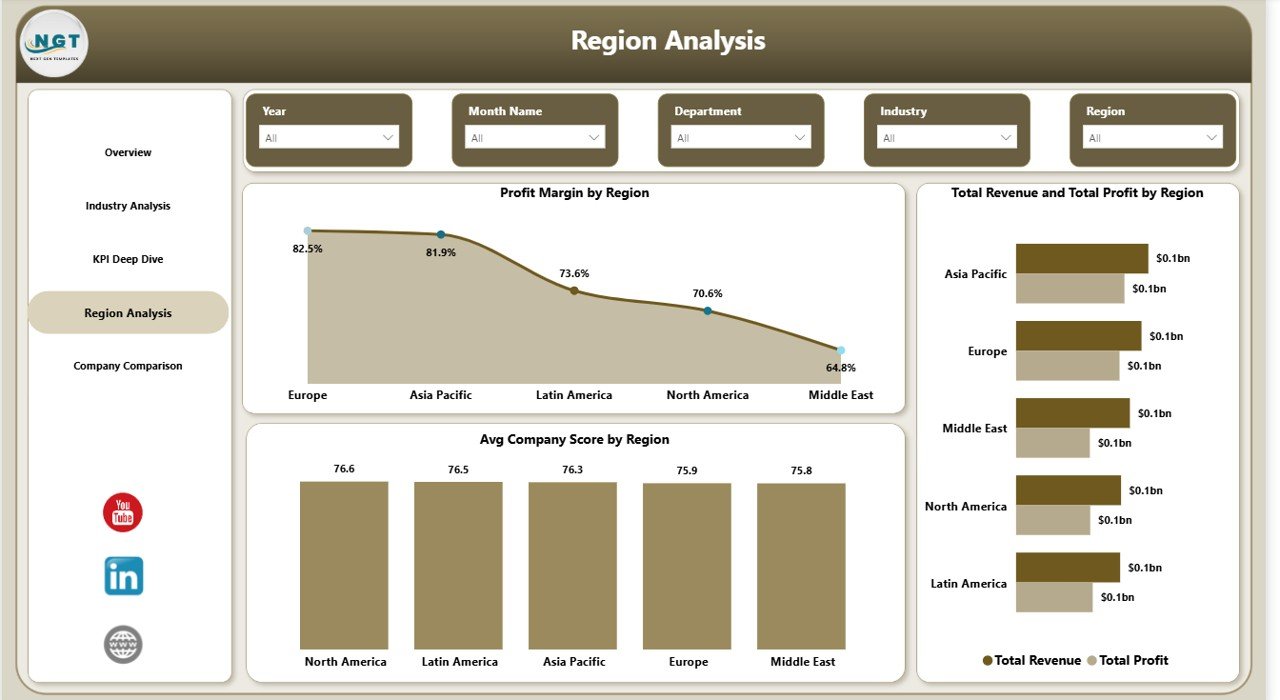
Region Analysis: How Does It Help in Regional Comparison?
The Region Analysis Page allows businesses to analyze performance across different regions.
Charts Included
- Profit Margin by Region
- Total Revenue and Profit by Region
- Average Company Score by Region
Why Regional Analysis is Important
- Identify top-performing regions
- Understand regional challenges
- Allocate resources effectively
As a result, businesses can optimize their regional strategies.
Click to buy Benchmarking and Insights Dashboard in Power BI
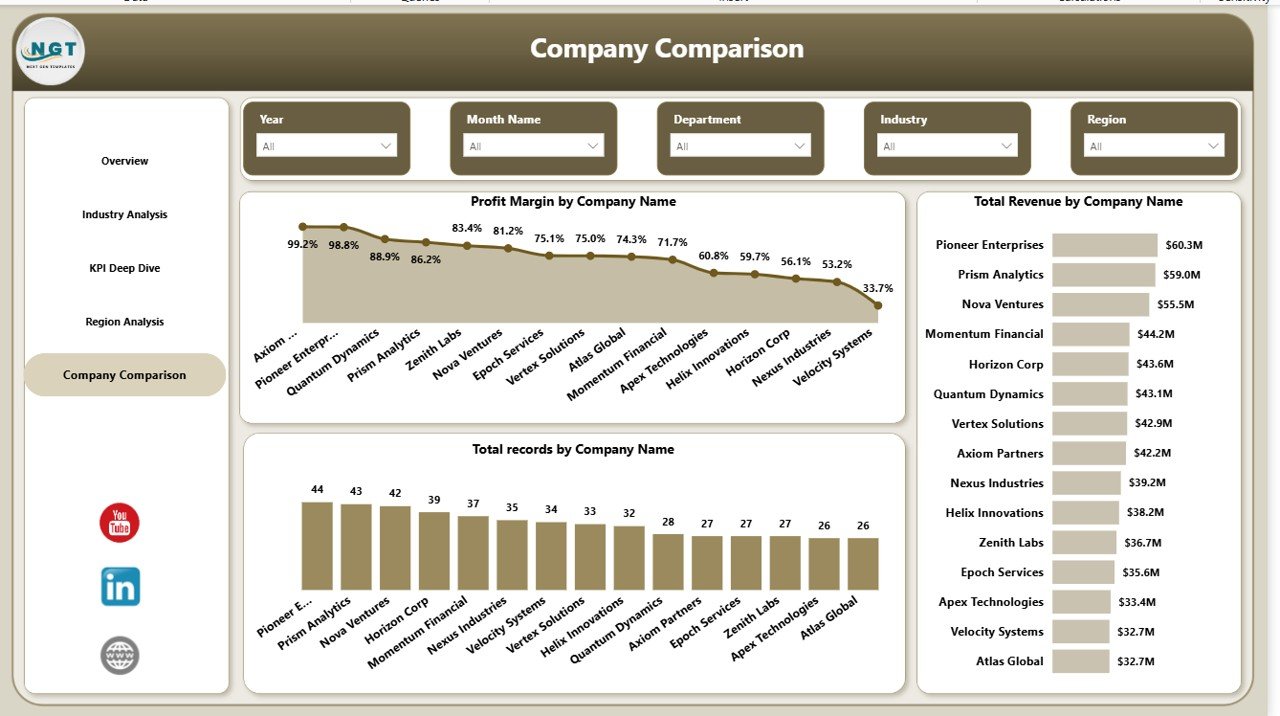
Company Comparison: How Can You Compare Companies?
The Company Comparison Page provides insights into company-level performance.
Charts Included
- Profit Margin by Company Name
- Total Revenue by Company Name
- Total Records by Company Name
Benefits of This Page
- Compare competitors easily
- Identify top-performing companies
- Benchmark your company against others
Therefore, this page plays a key role in competitive analysis.
Click to buy Benchmarking and Insights Dashboard in Power BI
Advantages of Benchmarking and Insights Dashboard in Power BI
Using this dashboard provides multiple benefits. Let’s explore them in detail.
Advantages
- Better Decision-Making
You can make informed decisions using real-time data. - Improved Performance Tracking
You can monitor KPIs regularly and accurately. - Clear Data Visualization
Charts and visuals make data easy to understand. - Competitive Advantage
Benchmarking helps you stay ahead of competitors. - Time-Saving
Automated reports reduce manual effort. - Centralized Data Management
All data stays in one place for easy access.
Opportunities for Improvement in Benchmarking Dashboards
Although the dashboard is powerful, you can still improve it further.
Opportunities for Improvement
- Add predictive analytics for future trends
- Include more KPIs for deeper insights
- Improve data refresh frequency
- Add drill-through features for detailed analysis
- Integrate AI-based insights
By making these improvements, you can enhance dashboard performance.
Best Practices for the Benchmarking and Insights Dashboard
To get the best results, you should follow these best practices.
Best Practices
- Use Clean and Structured Data
Always ensure your data is accurate and organized. - Update Data Regularly
Frequent updates ensure reliable insights. - Use Meaningful KPIs
Choose KPIs that align with your business goals. - Apply Proper Filters (Slicers)
Use slicers to make analysis easier. - Focus on User-Friendly Design
Keep the dashboard simple and easy to navigate. - Use Consistent Colors and Themes
This improves readability and user experience. - Validate Data Before Analysis
Always check data accuracy before making decisions.
How to Use Benchmarking Dashboard Effectively?
Using the dashboard correctly ensures better results.
Step-by-Step Usage
- Upload or Connect Data Source
- Refresh the Dashboard
- Use Slicers to Filter Data
- Analyze KPIs on Overview Page
- Explore Detailed Pages (Industry, KPI, Region)
- Compare Company Performance
- Take Action Based on Insights
By following these steps, you can maximize the dashboard’s value.
Why Businesses Need Benchmarking Dashboards Today?
Today’s business environment is highly competitive. Therefore, companies must rely on data-driven decisions.
Key Reasons
- Faster decision-making
- Better performance comparison
- Improved efficiency
- Increased profitability
Because of these benefits, benchmarking dashboards have become essential tools.
Conclusion: Why Should You Use This Dashboard?
The Benchmarking and Insights Dashboard in Power BI is a must-have tool for modern businesses. It helps you track performance, compare benchmarks, and make smarter decisions.
Moreover, it simplifies complex data into clear visuals. As a result, you gain better control over your business operations.
So, if you want to improve performance and stay competitive, this dashboard is the perfect solution.
Frequently Asked Questions (FAQs)
- What is benchmarking in Power BI?
Benchmarking in Power BI means comparing your company’s performance with industry standards using data visualization.
- Who can use this dashboard?
Business analysts, managers, executives, and decision-makers can use this dashboard.
- Can I customize this dashboard?
Yes, you can easily customize KPIs, charts, and filters based on your business needs.
- How often should I update the data?
You should update the data regularly, preferably daily or weekly, depending on your business requirements.
- Does this dashboard support multiple industries?
Yes, it supports multiple industries and allows comparison across them.
- Is Power BI required to use this dashboard?
Yes, you need Power BI Desktop or Power BI Service to use and refresh the dashboard.
- Can I track real-time data?
Yes, if your data source supports real-time updates, Power BI can display live insights.
- What are slicers in Power BI?
Slicers are filters that allow you to interactively filter data in the dashboard.
Click to buy Benchmarking and Insights Dashboard in Power BI
Visit our YouTube channel to learn step-by-step video tutorials