The global energy industry is rapidly shifting toward renewable and sustainable energy sources. Among these alternatives, biofuels play a critical role in reducing carbon emissions and supporting energy security. Governments, energy companies, and biofuel producers continuously monitor production levels, feedstock efficiency, plant operations, and revenue performance.
However, managing biofuel production data can become extremely challenging when organizations rely on scattered spreadsheets, disconnected systems, or manual reporting processes. Decision-makers often struggle to track plant performance, evaluate production capacity, and analyze revenue trends.
Therefore, businesses need a centralized analytics solution that converts raw operational data into meaningful insights.
This is exactly where the Biofuels Dashboard in Power BI becomes extremely powerful.
The Biofuels Dashboard in Power BI is a ready-to-use interactive reporting tool designed to help energy companies, plant managers, and business analysts track biofuel production performance, analyze feedstock efficiency, evaluate plant capacity utilization, and monitor revenue trends.
Because Power BI offers powerful visualization, filtering, and data modeling capabilities, organizations can transform complex biofuel production data into clear, interactive dashboards that support faster decision-making.
In this comprehensive guide, we will explore the Biofuels Dashboard in Power BI, including its features, dashboard structure, advantages, best practices, and practical use cases.
Click to buy Biofuels Dashboard in Power BI
What is a Biofuels Dashboard in Power BI?
A Biofuels Dashboard in Power BI is an analytical reporting solution that visualizes key performance indicators related to biofuel production and plant operations.
Instead of manually analyzing multiple spreadsheets, users can track all operational metrics through a single interactive dashboard.
The dashboard helps organizations monitor:
- Biofuel production volumes
- Plant operational performance
- Feedstock efficiency
- Production capacity utilization
- Regional production performance
- Revenue generated from biofuel products
As a result, decision-makers gain real-time insights into operational efficiency and financial performance.
Furthermore, Power BI dashboards allow users to apply filters, slicers, and drill-down analysis, which helps teams identify performance trends and operational issues quickly.
Why Do Biofuel Companies Need a Dashboard?
Biofuel production operations involve multiple variables such as feedstock supply, plant capacity, operational efficiency, and market demand.
Without a proper reporting system, companies face several challenges.
Common Challenges in Biofuel Data Management
- Production data stored across multiple spreadsheets
- Difficulty tracking plant capacity utilization
- Lack of real-time operational insights
- Limited visibility into feedstock performance
- Inconsistent reporting across different regions
- Slow decision-making due to manual reporting
Therefore, organizations require a centralized analytics system that provides a complete overview of production operations.
The Biofuels Dashboard in Power BI solves these problems by providing an interactive data visualization environment.
Key Features of the Biofuels Dashboard in Power BI
The Biofuels Dashboard in Power BI includes multiple pages that analyze production performance from different perspectives.
This dashboard consists of five analytical pages, each designed to provide valuable operational insights.
Overview Page – What Does the Dashboard Summary Show?
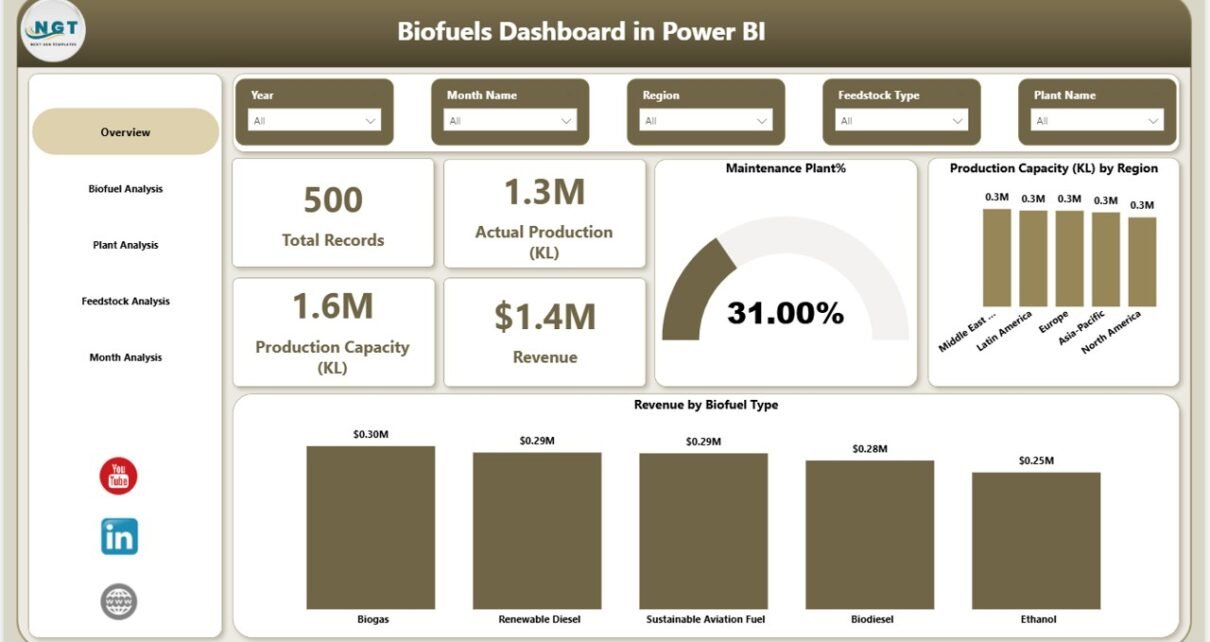
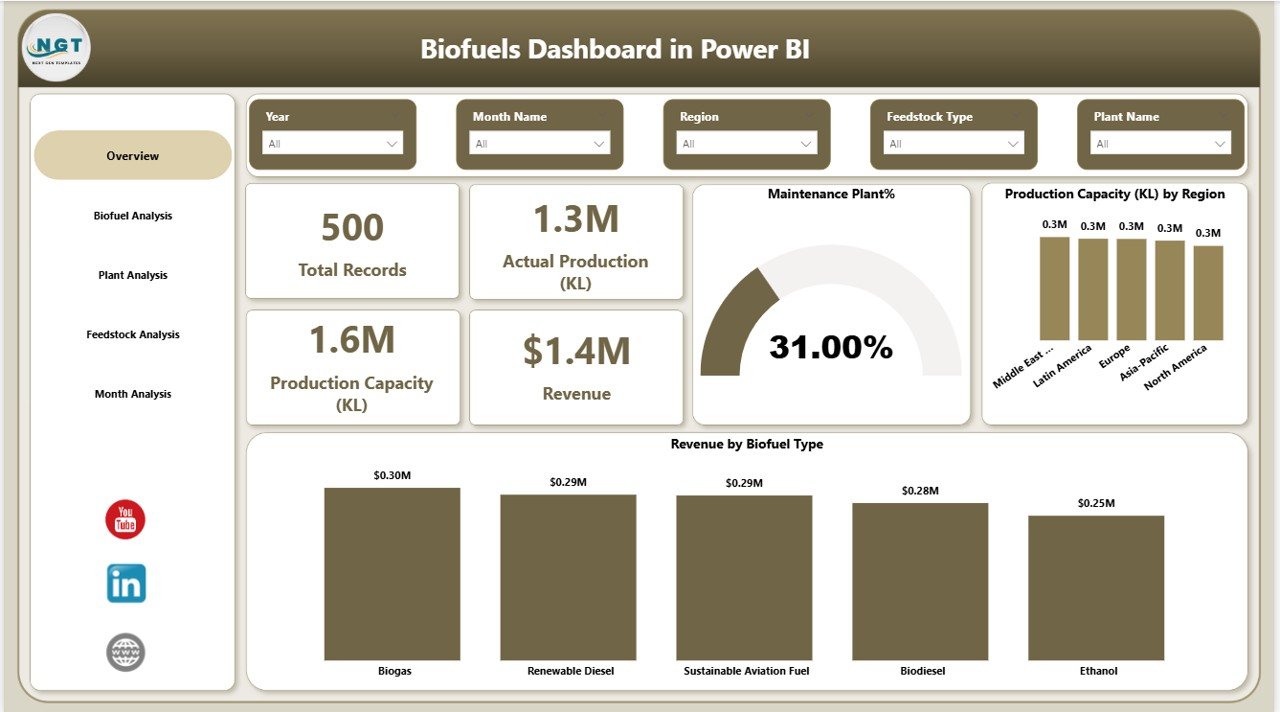
The Overview Page serves as the main dashboard interface. It provides a quick summary of biofuel production and operational performance.
Users can immediately understand overall plant performance without navigating through multiple reports.
KPI Cards Displayed
The overview page includes five key performance indicator cards:
- Total Records – Total number of operational records in the dataset
- Actual Production (KL) – Total biofuel production in kiloliters
- Production Capacity (KL) – Total available production capacity
- Revenue – Total revenue generated from biofuel production
- Operational Plants % – Percentage of operational plants
These KPI indicators provide an instant snapshot of overall production performance.
Charts Available in the Overview Page
The dashboard also includes several charts that visualize operational data.
Maintenance Plant %
- Displays the percentage of plants under maintenance
- Helps identify operational downtime
Production Capacity (KL) by Region
- Shows how production capacity distributes across different regions
- Helps managers understand regional capacity utilization
Revenue by Biofuel Type
- Displays revenue generated from different types of biofuels
- Helps identify high-performing products
Operational Plants by Biofuel Type
- Shows operational plants for each biofuel category
- Helps track plant efficiency by product type
Click to buy Biofuels Dashboard in Power BI
Biofuel Analysis – How Can You Compare Biofuel Production?
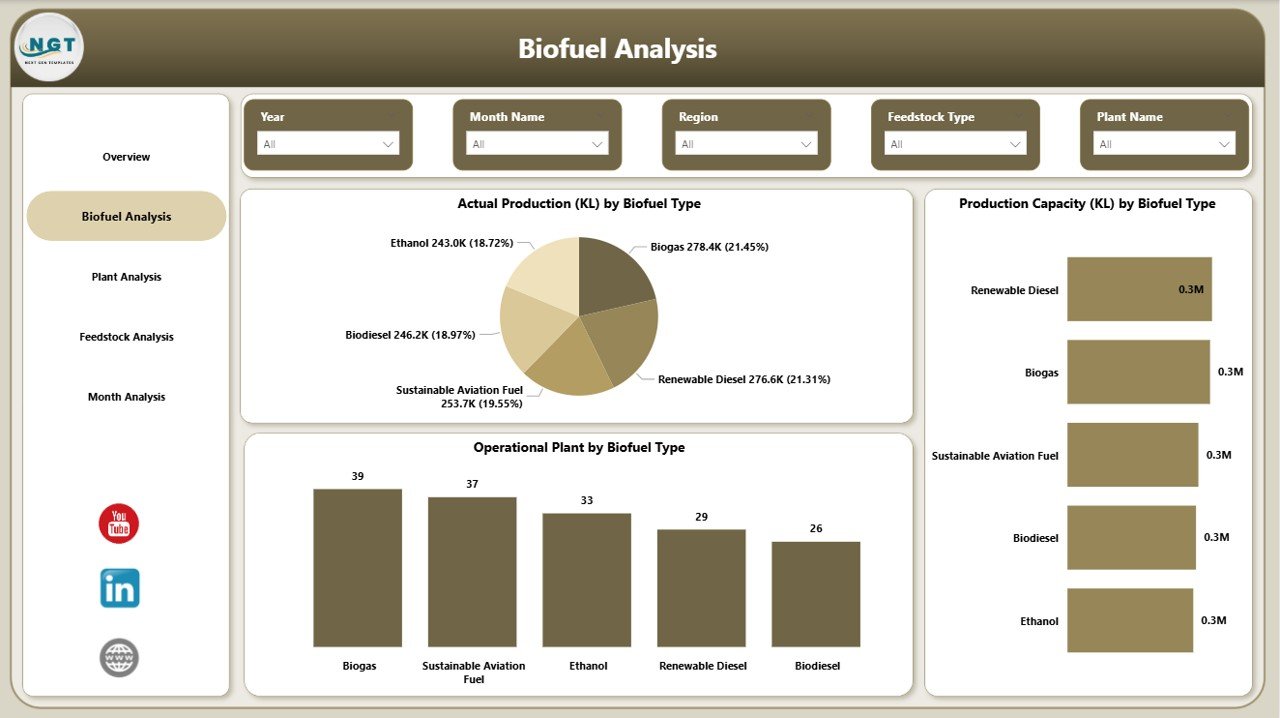
The Biofuel Analysis Page focuses on analyzing production metrics based on different biofuel types.
Because biofuel production includes multiple categories such as ethanol, biodiesel, and renewable diesel, organizations must track production performance separately.
Charts Available in Biofuel Analysis
Actual Production (KL) by Biofuel Type
- Displays production volume for each biofuel type
- Helps identify top-producing fuels
Production Capacity (KL) by Biofuel Type
- Shows available capacity for each biofuel category
- Helps managers evaluate production potential
This page helps decision-makers compare production performance across different fuel types.
Click to buy Biofuels Dashboard in Power BI
Plant Analysis – How Are Individual Plants Performing?
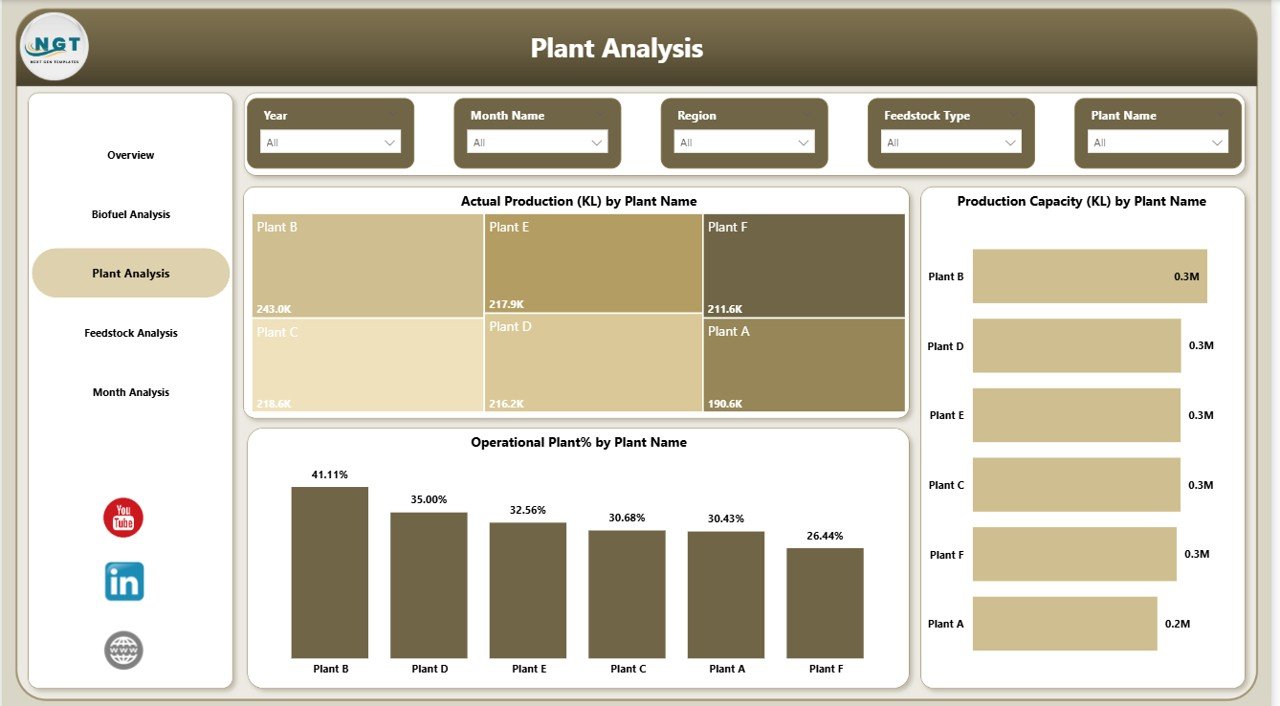
Biofuel companies usually operate multiple production plants across different locations. Therefore, plant-level monitoring becomes extremely important.
The Plant Analysis Page provides detailed insights into individual plant performance.
Charts Available in Plant Analysis
Actual Production (KL) by Plant Name
- Shows production output of each plant
- Helps identify high-performing facilities
Production Capacity (KL) by Plant Name
- Displays maximum production capacity of each plant
- Helps evaluate utilization rates
Operational Plant % by Plant Name
- Shows operational efficiency of each plant
- Helps detect underperforming facilities
With this analysis, plant managers can quickly identify production bottlenecks and capacity issues.
Click to buy Biofuels Dashboard in Power BI
Feedstock Analysis – Why is Feedstock Performance Important?
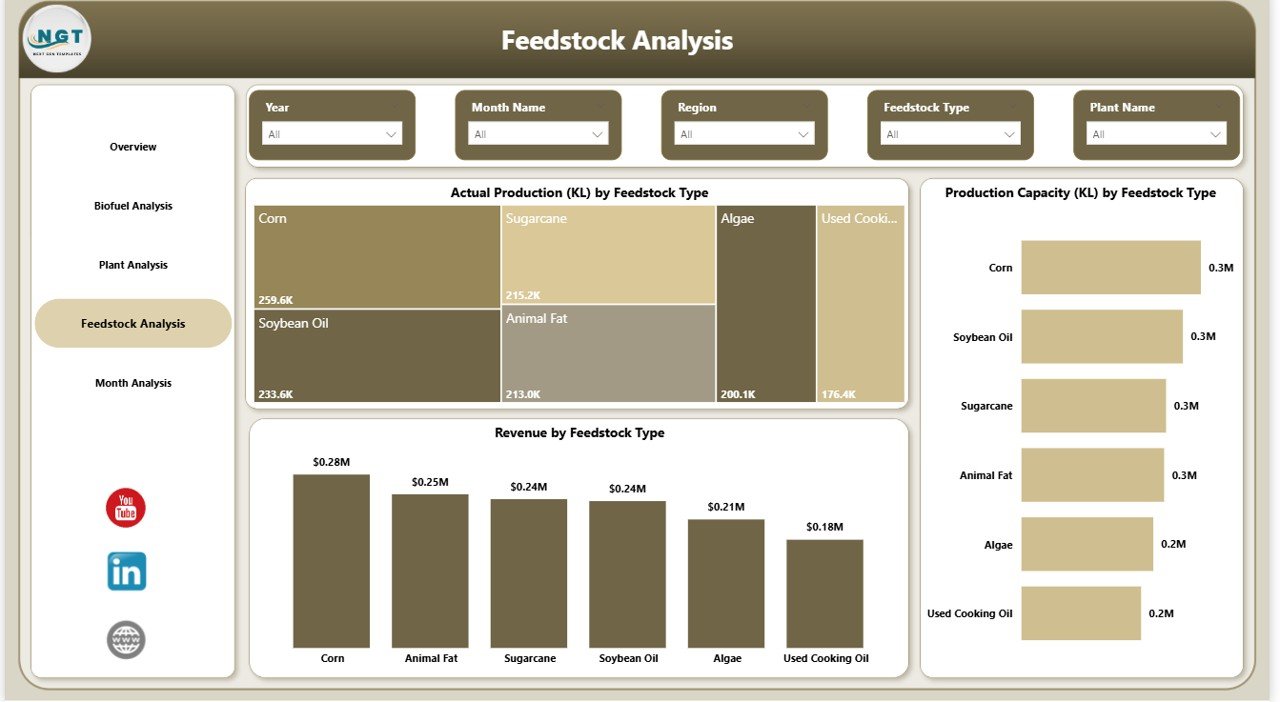
Feedstock plays a crucial role in biofuel production. Different feedstocks such as corn, sugarcane, soybean oil, or waste oils influence production efficiency and cost.
The Feedstock Analysis Page provides insights into how feedstock affects production and revenue.
Charts Available in Feedstock Analysis
Actual Production (KL) by Feedstock Type
- Displays production volume based on feedstock
- Helps evaluate feedstock productivity
Production Capacity (KL) by Feedstock Type
- Shows capacity associated with different feedstocks
- Helps understand resource allocation
Revenue by Feedstock Type
- Displays revenue contribution of each feedstock
- Helps identify profitable feedstock sources
This analysis allows organizations to optimize feedstock selection for better profitability.
Click to buy Biofuels Dashboard in Power BI
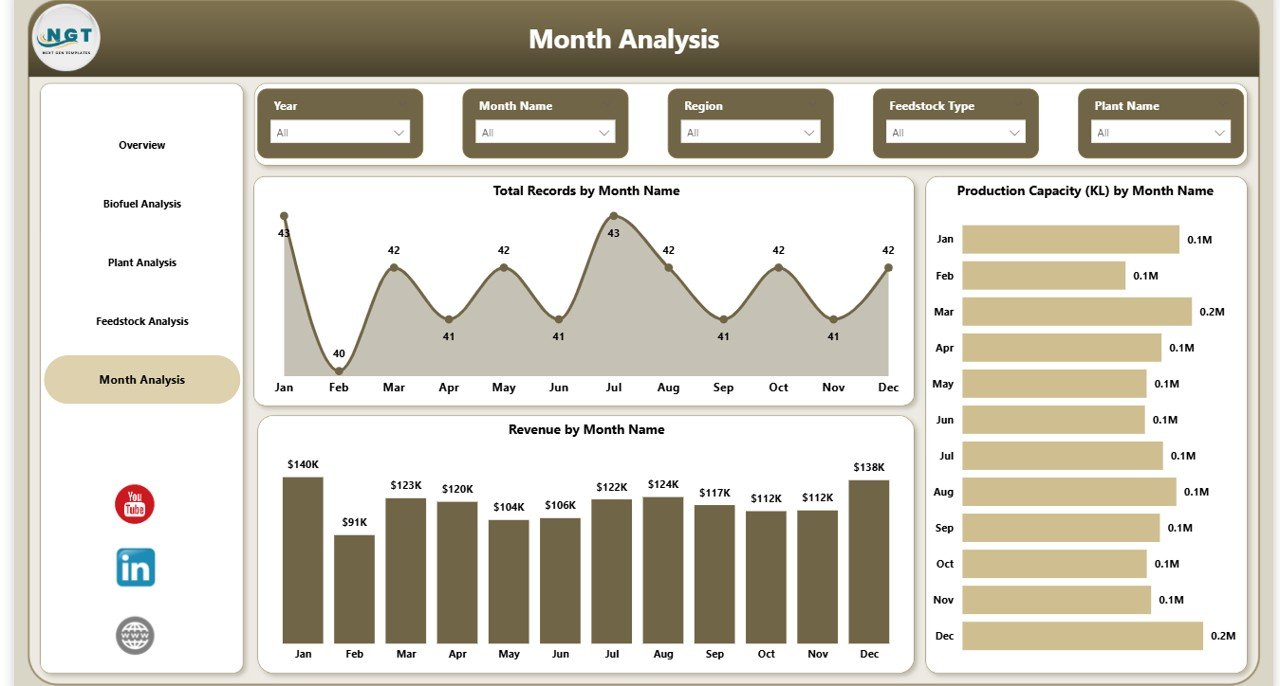
Monthly Analysis – What Production Trends Exist Over Time?
Understanding monthly production trends helps organizations forecast demand and manage production schedules.
The Month Analysis Page focuses on time-based performance.
Charts Available in Month Analysis
Total Records by Month
- Displays operational records across months
- Helps track reporting activity
Production Capacity (KL) by Month
- Shows how capacity changes over time
- Helps detect seasonal production patterns
Revenue by Month
- Displays monthly revenue trends
- Helps monitor business growth
Through this analysis, companies can identify seasonal patterns and revenue fluctuations.
Advantages of the Biofuels Dashboard in Power BI
A well-designed Power BI dashboard provides numerous benefits to energy companies and biofuel producers.
- Centralized Data Monitoring
The dashboard combines production, plant performance, and financial metrics in one place.
As a result, managers can access critical information quickly.
- Real-Time Decision Making
Power BI allows organizations to connect dashboards to live data sources.
Therefore, decision-makers receive real-time operational insights.
- Improved Production Efficiency
Because the dashboard tracks production performance, managers can detect inefficiencies and take corrective actions.
- Better Plant Management
Plant-level analysis helps organizations monitor individual plant performance.
Consequently, teams can identify underperforming facilities quickly.
- Feedstock Optimization
Feedstock analysis helps companies determine which feedstock produces the best output and revenue.
- Revenue Performance Insights
Revenue analysis helps businesses track profitability across biofuel types and regions.
- Faster Reporting
Automated dashboards eliminate the need for manual reporting.
Therefore, teams save valuable time.
Opportunities for Improvement in Biofuel Analytics
While dashboards provide powerful insights, organizations can further improve their analytics capabilities.
- Integrating IoT Sensors
Plants can connect operational machines with IoT sensors to capture real-time production data.
- Predictive Analytics
Advanced analytics models can forecast production levels and demand trends.
- Automated Alerts
Power BI alerts can notify managers when production falls below target levels.
- Supply Chain Integration
Integrating feedstock supply chain data can improve procurement planning.
- Environmental Impact Tracking
Organizations can also monitor carbon emissions and sustainability metrics.
Best Practices for the Biofuels Dashboard in Power BI
To build a highly effective dashboard, organizations should follow these best practices.
- Define Clear KPIs
First, define clear metrics such as production volume, capacity utilization, and revenue.
- Use Clean Data Sources
Always ensure data accuracy before loading it into Power BI.
- Design Simple Visualizations
Avoid overcrowded charts. Instead, use clear and simple visuals.
- Use Interactive Filters
Add slicers to allow users to filter data by region, plant, biofuel type, and feedstock.
- Monitor Data Refresh
Schedule automatic data refresh to keep dashboards updated.
- Focus on Business Questions
Design charts that answer important business questions.
- Use Consistent Formatting
Consistent color schemes and layout improve readability.
Who Can Use the Biofuels Dashboard?
The Biofuels Dashboard in Power BI serves multiple stakeholders in the renewable energy industry.
Biofuel Manufacturers
Manufacturers can monitor production levels and plant efficiency.
Plant Managers
Plant managers can track plant performance and operational status.
Operations Teams
Operations teams can analyze feedstock utilization and capacity planning.
Financial Analysts
Financial teams can monitor revenue trends and profitability.
Government Agencies
Regulatory bodies can track renewable fuel production statistics.
How Does the Dashboard Improve Business Decisions?
Data-driven decision-making has become essential for modern energy companies.
A Biofuels Dashboard in Power BI supports decision-making by:
- Identifying production inefficiencies
- Monitoring plant performance
- Improving feedstock selection
- Tracking revenue trends
- Forecasting production demand
Consequently, companies can optimize operations and increase profitability.
Conclusion
The renewable energy sector continues to grow rapidly, and biofuels play a major role in the global energy transition. However, biofuel production operations generate large volumes of complex data.
Without proper analytics tools, organizations struggle to track plant performance, production capacity, and revenue trends.
The Biofuels Dashboard in Power BI solves this problem by converting operational data into clear, interactive visual insights.
Through its five analytical pages — Overview, Biofuel Analysis, Plant Analysis, Feedstock Analysis, and Monthly Analysis — the dashboard provides a comprehensive view of production performance.
Furthermore, the dashboard helps organizations improve operational efficiency, optimize feedstock usage, and make data-driven decisions.
Therefore, any biofuel company looking to improve reporting and operational transparency should consider implementing a Power BI biofuel analytics dashboard.
Frequently Asked Questions (FAQs)
What is a Biofuels Dashboard in Power BI?
A Biofuels Dashboard in Power BI is a data visualization tool that tracks biofuel production metrics, plant performance, feedstock efficiency, and revenue trends through interactive reports.
Why should biofuel companies use Power BI dashboards?
Power BI dashboards help biofuel companies monitor production data, analyze plant efficiency, and make faster data-driven decisions.
What metrics should a biofuel dashboard track?
A biofuel dashboard should track key metrics such as:
- Actual production volume
- Production capacity
- Plant operational status
- Feedstock performance
- Revenue by biofuel type
- Regional production performance
Can Power BI connect with biofuel production databases?
Yes. Power BI can connect with various databases such as SQL Server, Excel, cloud databases, and ERP systems used by biofuel companies.
Is the Biofuels Dashboard customizable?
Yes. Organizations can customize the dashboard by adding new KPIs, charts, filters, and advanced analytics models.
Visit our YouTube channel to learn step-by-step video tutorials
Watch the step-by-step video tutorial:
Click to buy Biofuels Dashboard in Power BI