In today’s fast-growing event industry, book fairs generate massive amounts of data every single day. Organizers manage visitor attendance, vendor performance, ticket revenue, and profitability all at once. However, when this data stays scattered across multiple tools, it becomes difficult to gain clear insights.
So, how can you track performance, improve decision-making, and increase profitability—all in one place?
👉 The answer is the Book Fairs Dashboard in Power BI.
This powerful and interactive dashboard helps event organizers, managers, and analysts monitor key metrics in real time. Moreover, it transforms raw data into visually appealing charts and KPIs. As a result, you can quickly understand trends and take action.
In this complete guide, you will learn everything about this dashboard, including features, benefits, best practices, and FAQs.
Click to Purchases Book Fairs Dashboard in Power BI
📘 What is a Book Fairs Dashboard in Power BI?
A Book Fairs Dashboard in Power BI is a business intelligence tool designed to track, analyze, and visualize all key performance indicators related to book fair events.
Instead of using multiple spreadsheets, you can centralize all your data into one interactive dashboard. Therefore, you can:
-
📊 Track revenue and profit margins
-
👥 Monitor visitor attendance
-
🏪 Analyze vendor performance
-
🌦️ Understand the impact of weather on events
-
📅 Identify monthly trends
In addition, Power BI enables dynamic filtering and drill-down analysis. So, you can explore data from different angles without any complexity.
❓ Why Do Book Fair Organizers Need a Dashboard?
Book fairs involve multiple stakeholders, including visitors, vendors, exhibitors, and sponsors. Because of this complexity, managing data manually becomes challenging.
However, with a Power BI dashboard:
-
You gain real-time insights
-
You reduce manual reporting efforts
-
You improve operational efficiency
-
You make faster decisions
Therefore, this dashboard becomes an essential tool for modern event management.
🚀 Key Features of the Book Fairs Dashboard in Power BI
This dashboard includes 5 powerful pages, each designed to provide deep insights into different areas of your book fair operations.
📊 1. Overview Page – Get a Quick Snapshot
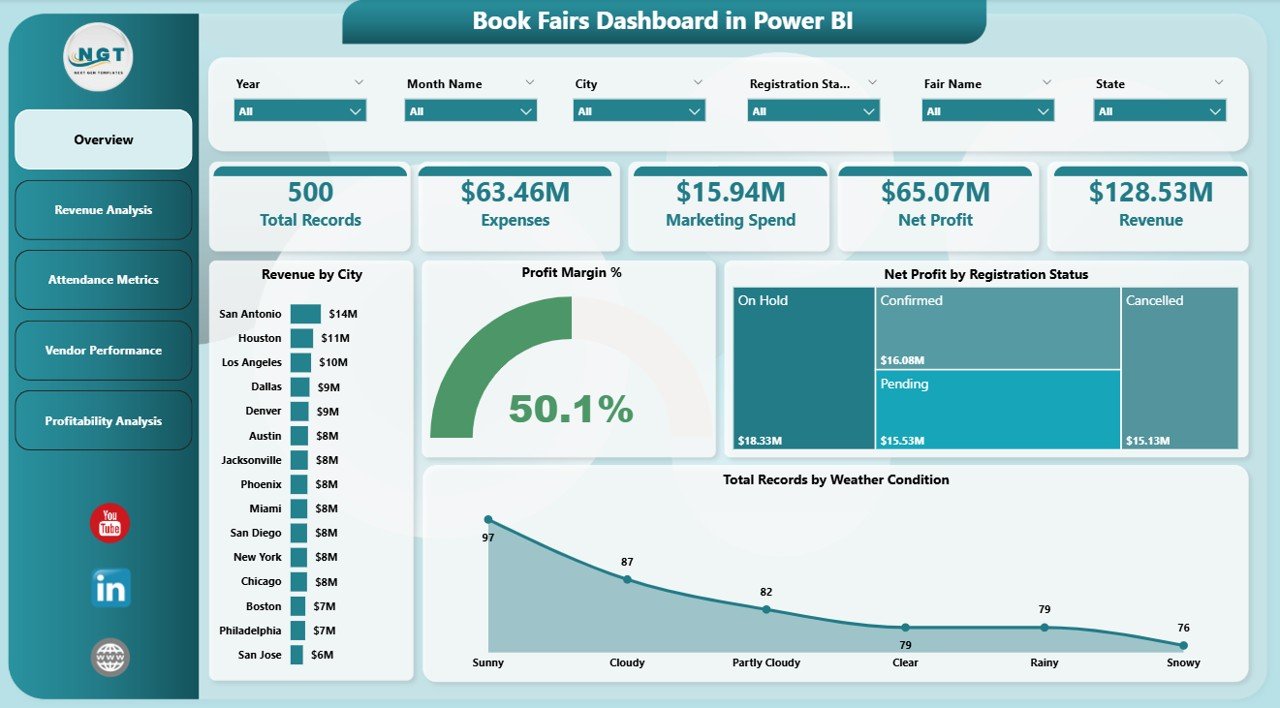
The Overview Page acts as the central hub of the dashboard. It provides a high-level summary of all key metrics.
🔹 KPI Cards Included:
-
Revenue by City
-
Profit Margin %
-
Net Profit by Registration Status
-
Total Records by Weather Condition
- Click to Purchases Book Fairs Dashboard in Power BI
📈 Visual Insights:
-
Compare performance across cities
-
Understand profitability trends
-
Analyze how weather affects attendance and revenue
👉 As a result, you can quickly identify what is working and what needs attention.
💰 2. Revenue Analysis – Understand Your Earnings
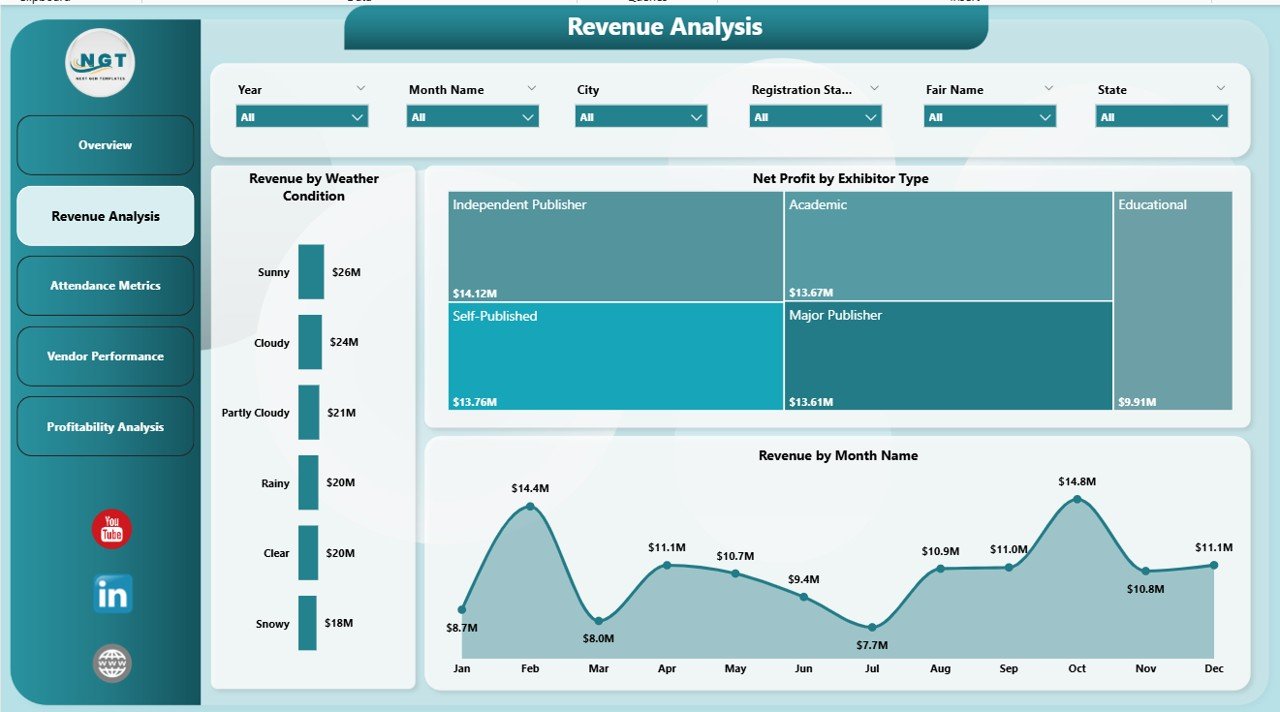
The Revenue Analysis page focuses on financial performance.
📊 Charts Included:
-
Revenue by Weather Condition
-
Net Profit by Exhibitor Type
-
Revenue by Month
🔍 Insights You Get:
-
Identify high-performing months
-
Understand how weather impacts sales
-
Compare exhibitor contribution
Therefore, you can optimize pricing strategies and event planning.
👥 3. Attendance Metrics – Track Visitor Engagement
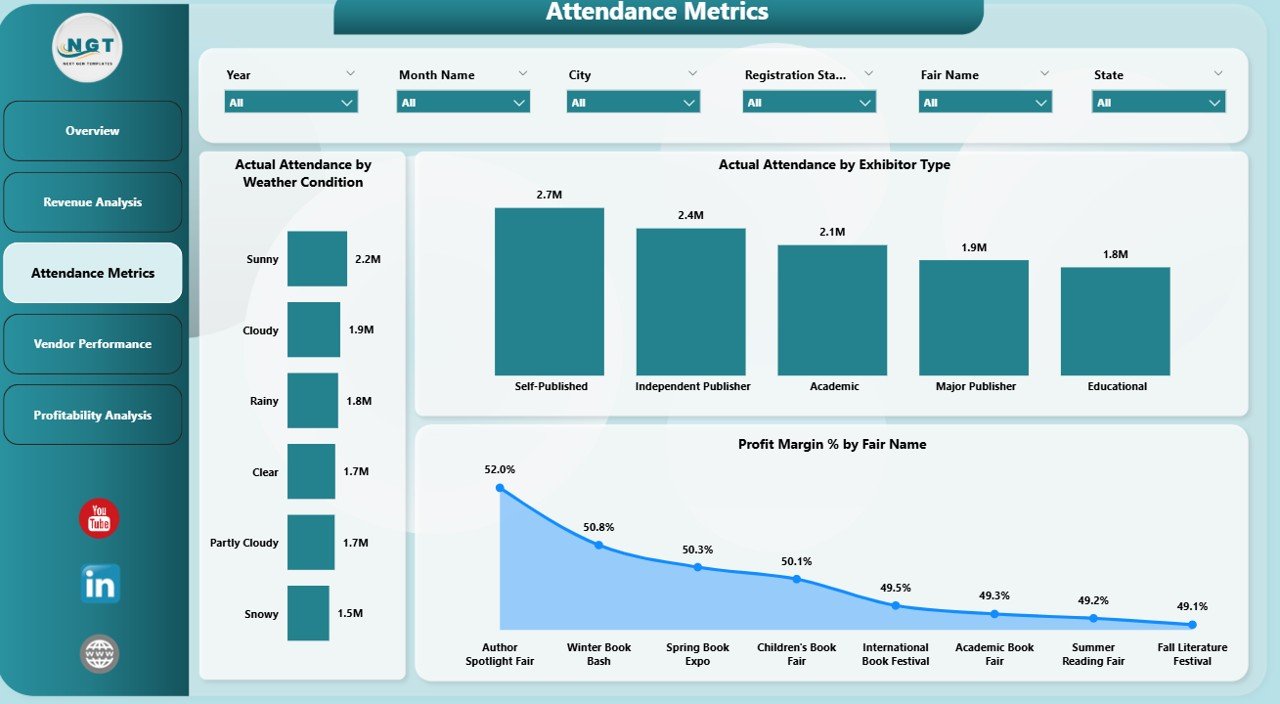
Attendance plays a key role in the success of any book fair. This page helps you monitor visitor behavior.
📊 Charts Included:
-
Actual Attendance by Weather Condition
-
Actual Attendance by Exhibitor Type
-
Profit Margin % by Fair Name
- Click to Purchases Book Fairs Dashboard in Power BI
🎯 Key Benefits:
-
Analyze visitor trends
-
Understand audience preferences
-
Measure event success
As a result, you can improve marketing campaigns and increase attendance.
🏪 4. Vendor Performance – Evaluate Exhibitors
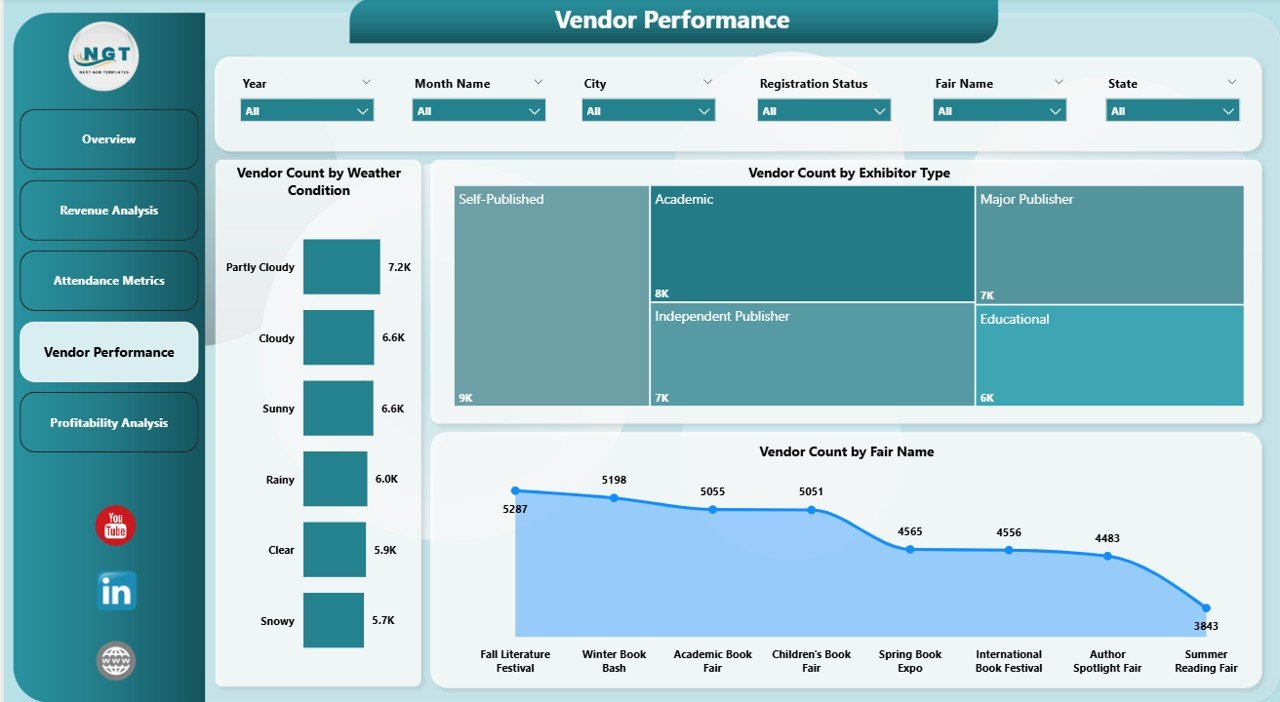
Vendors and exhibitors drive both revenue and engagement. Therefore, tracking their performance is crucial.
📊 Charts Included:
-
Vendor Count by Weather Condition
-
Vendor Count by Exhibitor Type
-
Vendor Count by Fair Name
💡 Insights:
-
Identify top-performing vendor categories
-
Track exhibitor participation trends
-
Improve vendor onboarding strategies
Thus, you can build stronger relationships with vendors.
Click to Purchases Book Fairs Dashboard in Power BI
📈 5. Profitability Analysis – Measure Financial Success
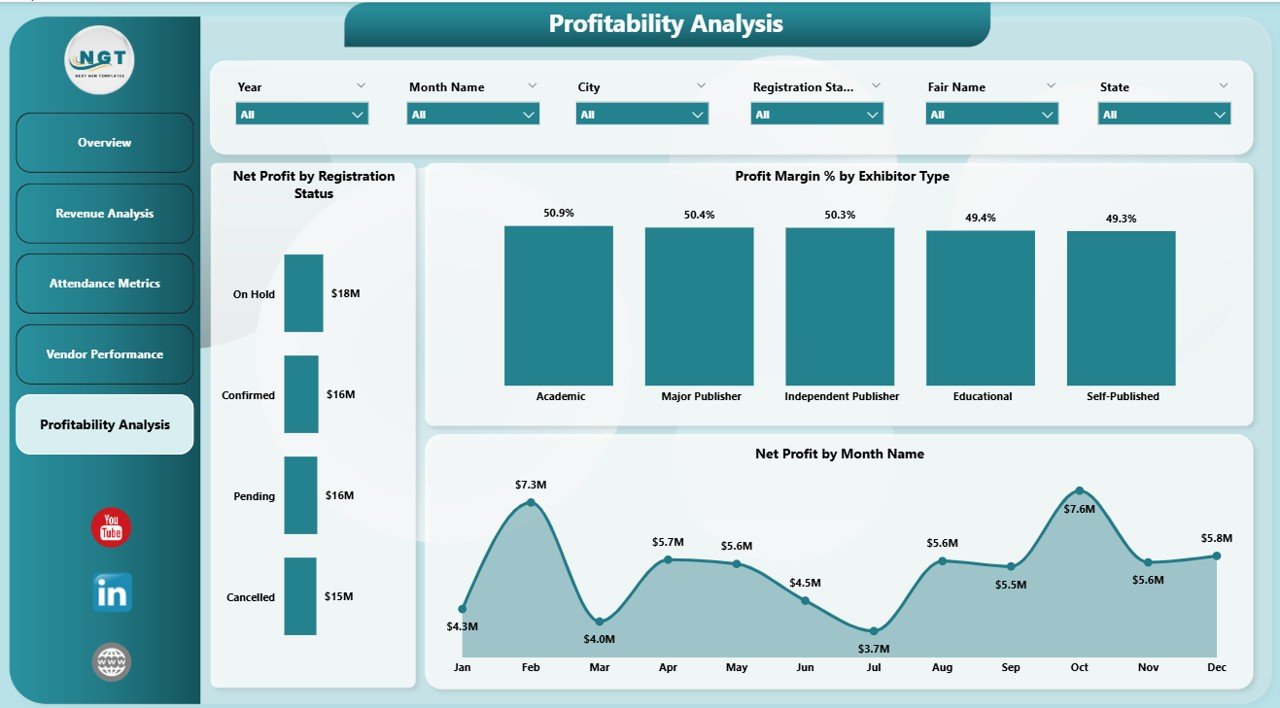
This page focuses on profit-related metrics to help you evaluate overall performance.
📊 Charts Included:
-
Net Profit by Registration Status
-
Profit Margin % by Exhibitor Type
-
Net Profit by Month
📌 What You Learn:
-
Which segments generate the most profit
-
How profitability changes over time
-
Which strategies deliver better ROI
Therefore, you can maximize returns and reduce unnecessary costs.
🌟 Advantages of Book Fairs Dashboard in Power BI
Using this dashboard offers several benefits that can transform your event management process.
✅ Improved Decision-Making
-
You get real-time insights
-
You identify trends quickly
-
You act on data instantly
✅ Time-Saving Automation
-
You eliminate manual reporting
-
You reduce errors
-
You save valuable time
✅ Better Financial Control
-
You track revenue and profit
-
You monitor expenses
-
You optimize pricing
✅ Enhanced Vendor Management
-
You evaluate vendor performance
-
You improve partnerships
-
You increase exhibitor satisfaction
✅ Data Visualization
-
You understand complex data easily
-
You use interactive charts
-
You improve reporting quality
⚙️ How to Use the Book Fairs Dashboard in Power BI?
Using this dashboard is simple and user-friendly.
Step 1: Import Your Data
First, upload your dataset into Power BI. Ensure your data includes fields like revenue, attendance, vendor details, and dates.
Step 2: Connect Data Sources
Next, connect your Excel or database files to Power BI.
Step 3: Apply Filters (Slicers)
Then, use slicers to filter data by:
-
Month
-
City
-
Exhibitor Type
-
Weather Condition
Step 4: Analyze Visuals
After that, explore charts and KPIs to understand performance.
Step 5: Make Data-Driven Decisions
Finally, use insights to improve planning and execution.
🧠 Best Practices for the Book Fairs Dashboard in Power BI
To get the best results, you should follow these best practices:
✔ Keep Data Clean
-
Remove duplicates
-
Ensure consistency
-
Validate data regularly
✔ Use Clear KPIs
-
Focus on important metrics
-
Avoid unnecessary data
-
Keep visuals simple
✔ Update Data Frequently
-
Use real-time data when possible
-
Schedule automatic refresh
✔ Optimize Visuals
-
Use clear charts
-
Avoid clutter
-
Highlight key insights
✔ Train Your Team
-
Ensure users understand the dashboard
-
Provide guidance on filters and reports
📊 Who Can Benefit from This Dashboard?
This dashboard serves multiple users across the event industry.
👨💼 Event Organizers
-
Track performance
-
Improve planning
📊 Data Analysts
-
Analyze trends
-
Generate reports
🏪 Vendors & Exhibitors
-
Evaluate performance
-
Optimize strategies
💼 Business Owners
-
Monitor profitability
-
Make strategic decisions
- Click to Purchases Book Fairs Dashboard in Power BI
🔮 Future Scope of Book Fair Analytics
As technology evolves, analytics will play an even bigger role in event management.
In the future:
-
AI will predict attendance trends
-
Real-time dashboards will become standard
-
Data integration will improve
-
Personalized insights will increase
Therefore, adopting Power BI dashboards today gives you a competitive advantage.
🏁 Conclusion
The Book Fairs Dashboard in Power BI is a powerful solution for managing and analyzing event data. It simplifies complex information, improves decision-making, and enhances overall performance.
Moreover, it helps you track revenue, attendance, vendor performance, and profitability—all in one place.
So, if you want to run successful and data-driven book fairs, this dashboard is the perfect tool for you.
👉 Start using it today and transform your event management process!
❓ Frequently Asked Questions (FAQs)
1. What is a Book Fairs Dashboard in Power BI?
It is an interactive dashboard that helps track and analyze book fair data such as revenue, attendance, and vendor performance.
2. Is this dashboard suitable for small events?
Yes, it works for both small and large book fairs.
3. Can I customize the dashboard?
Yes, you can modify visuals, KPIs, and filters based on your needs.
4. Do I need Power BI knowledge to use it?
Basic knowledge helps, but the dashboard is user-friendly.
5. How often should I update the data?
You should update it regularly or use automatic refresh for real-time insights.
6. What data do I need for this dashboard?
You need data related to revenue, attendance, vendors, dates, and event details.
7. Can I share the dashboard with my team?
Yes, Power BI allows easy sharing and collaboration.
Visit our YouTube channel to learn step-by-step video tutorials
Click to Purchases Book Fairs Dashboard in Power BI