Modern buildings depend heavily on smart technologies. Systems such as HVAC, lighting control, energy monitoring, security systems, and facility automation generate large amounts of operational data every day. Therefore, organizations must monitor these systems carefully to maintain efficiency, reduce energy consumption, and improve operational performance.
However, managing building automation data through spreadsheets and scattered reports becomes difficult. Facility managers often struggle to identify performance trends, monitor targets, and evaluate system efficiency quickly.
This is exactly where a Building Automation KPI Dashboard in Power BI becomes extremely useful.
A Building Automation KPI Dashboard in Power BI provides a centralized analytical platform where organizations can monitor key performance indicators related to building systems. It transforms raw operational data into interactive charts, performance indicators, and insightful reports.
In this detailed guide, you will learn everything about the Building Automation KPI Dashboard in Power BI, including its features, dashboard structure, advantages, best practices, and practical implementation strategies.
Click to buy Building Automation KPI Dashboard in Power BI
What is a Building Automation KPI Dashboard in Power BI?
A Building Automation KPI Dashboard in Power BI is an interactive reporting tool that tracks performance indicators of building systems such as energy usage, equipment efficiency, system uptime, operational cost, and maintenance performance.
Instead of reviewing separate reports, organizations can analyze all KPIs in one place.
Because Power BI provides powerful data visualization capabilities, users can easily:
- Track monthly and yearly performance
- Compare targets vs actual results
- Monitor performance trends
- Identify operational inefficiencies
- Make data-driven decisions
Moreover, Power BI dashboards allow facility managers, engineers, and executives to monitor building performance in real time.
As a result, organizations improve energy efficiency, reduce maintenance costs, and ensure optimal system performance.
Why Do Organizations Need a Building Automation KPI Dashboard?
Modern buildings operate with multiple automated systems. Therefore, organizations must track performance metrics continuously.
However, without a structured dashboard, decision-making becomes difficult.
A Building Automation KPI Dashboard solves this problem by providing clear insights into system performance.
Key reasons organizations use KPI dashboards include:
- Monitoring energy consumption
- Tracking equipment performance
- Evaluating maintenance efficiency
- Comparing targets with actual results
- Improving facility management decisions
Furthermore, when managers use Power BI dashboards, they quickly identify operational problems and take corrective actions.
Key Features of the Building Automation KPI Dashboard in Power BI
The Building Automation KPI Dashboard in Power BI is a ready-to-use analytical dashboard designed for performance monitoring.
The dashboard captures data from an Excel data source and converts it into interactive visual reports.
The Power BI file includes three main pages, each designed for a specific analytical purpose.
Let us explore each dashboard page in detail.
Overview of Dashboard Pages
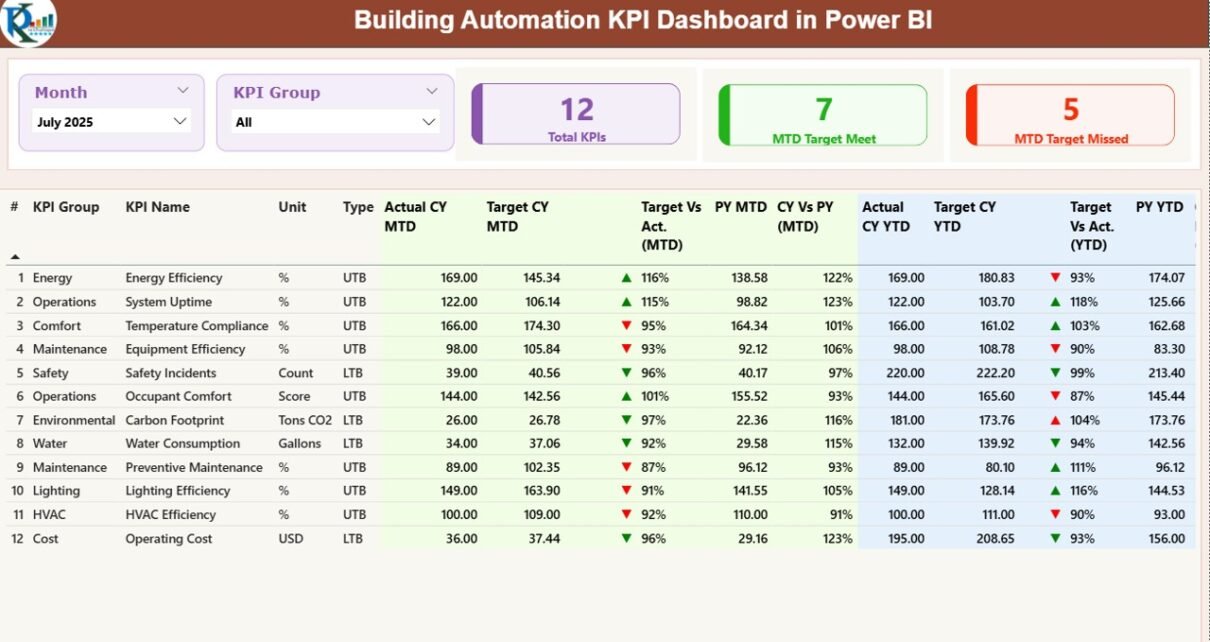
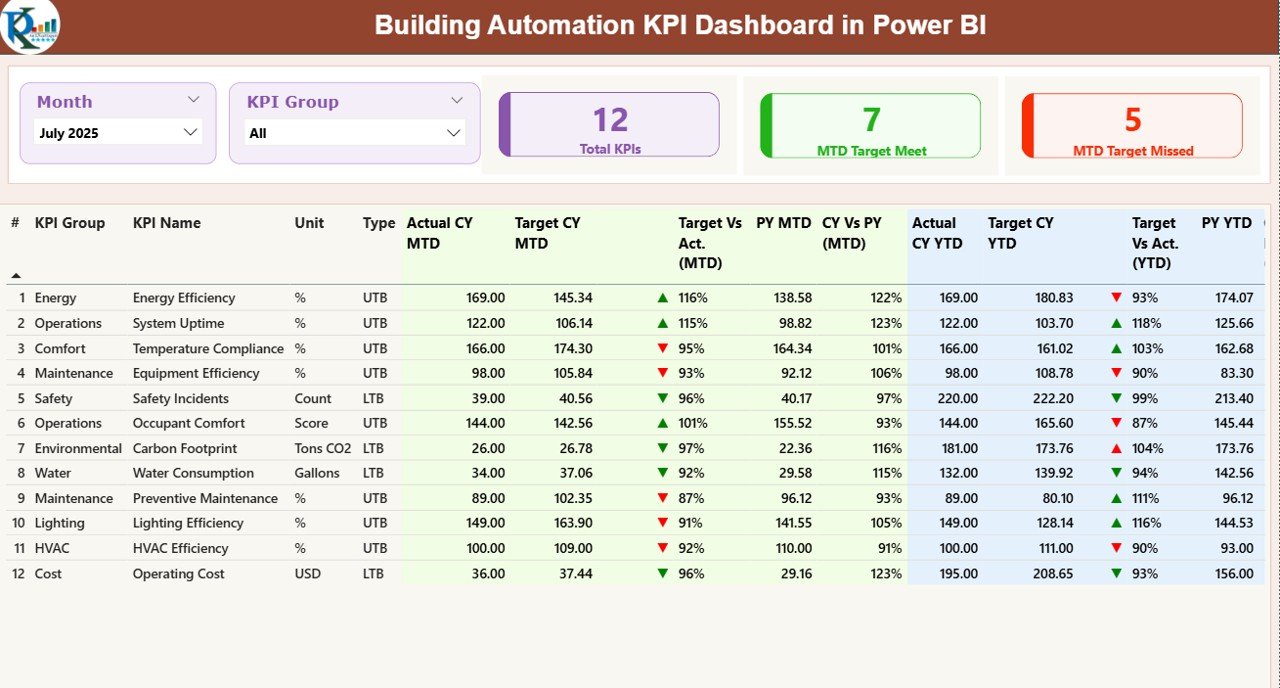
Summary Page – Main Dashboard Overview
The Summary Page acts as the main dashboard of the report. It provides a quick overview of all building automation KPIs.
At the top of the dashboard, users will find interactive slicers that help filter data easily.
Slicers available on the dashboard:
- Month Slicer – Allows users to select a specific month
- KPI Group Slicer – Filters KPIs by category or group
These slicers instantly update the entire dashboard.
KPI Performance Cards
The summary page also displays three key KPI cards that highlight overall performance:
- Total KPIs Count – Shows the total number of KPIs being monitored
- MTD Target Meet Count – Displays KPIs that achieved their monthly targets
- MTD Target Missed Count – Shows KPIs that failed to meet targets
These indicators help managers quickly understand system performance.
Detailed KPI Table
Below the KPI cards, the dashboard displays a detailed performance table containing several KPI metrics.
This table provides comprehensive KPI analysis including:
KPI Number
This represents the sequence number assigned to each KPI.
KPI Group
This shows the category or group of the KPI.
KPI Name
This represents the name of the performance indicator.
Unit
This shows the unit used to measure the KPI.
Type (LTB or UTB)
This defines the KPI direction.
- LTB (Lower the Better) – Lower values indicate better performance
- UTB (Upper the Better) – Higher values indicate better performance
MTD Performance Indicators
The dashboard also displays several Month-to-Date performance indicators.
These include:
Actual CY MTD
This shows the current year actual value for the month.
Target CY MTD
This shows the target value for the month.
MTD Status Icon
The dashboard displays visual indicators using arrows:
- ▲ Green arrow → Target achieved
- ▼ Red arrow → Target missed
These icons quickly show performance status.
Target vs Actual (MTD)
This metric shows the percentage difference between target and actual values.
Formula used:
Actual Value / Target Value
Previous Year MTD
This metric shows the KPI value for the same month in the previous year.
Current Year vs Previous Year (MTD)
This shows performance comparison between current and previous year.
Formula used:
Current Year MTD / Previous Year MTD
YTD Performance Indicators
The dashboard also includes Year-to-Date KPI analysis.
These metrics help organizations evaluate long-term performance.
Actual CY YTD
Shows current year YTD actual performance.
Target CY YTD
Shows target YTD performance.
YTD Status Icon
Displays visual indicators showing whether targets are met.
Target vs Actual (YTD)
This metric compares YTD actual values with YTD targets.
Formula used:
Actual YTD / Target YTD
Previous Year YTD
Shows KPI performance for the same period in the previous year.
Current Year vs Previous Year (YTD)
This metric compares current YTD performance with previous year performance.
Formula used:
Current YTD / Previous Year YTD
Because of these insights, managers quickly evaluate operational efficiency.
Click to buy Building Automation KPI Dashboard in Power BI
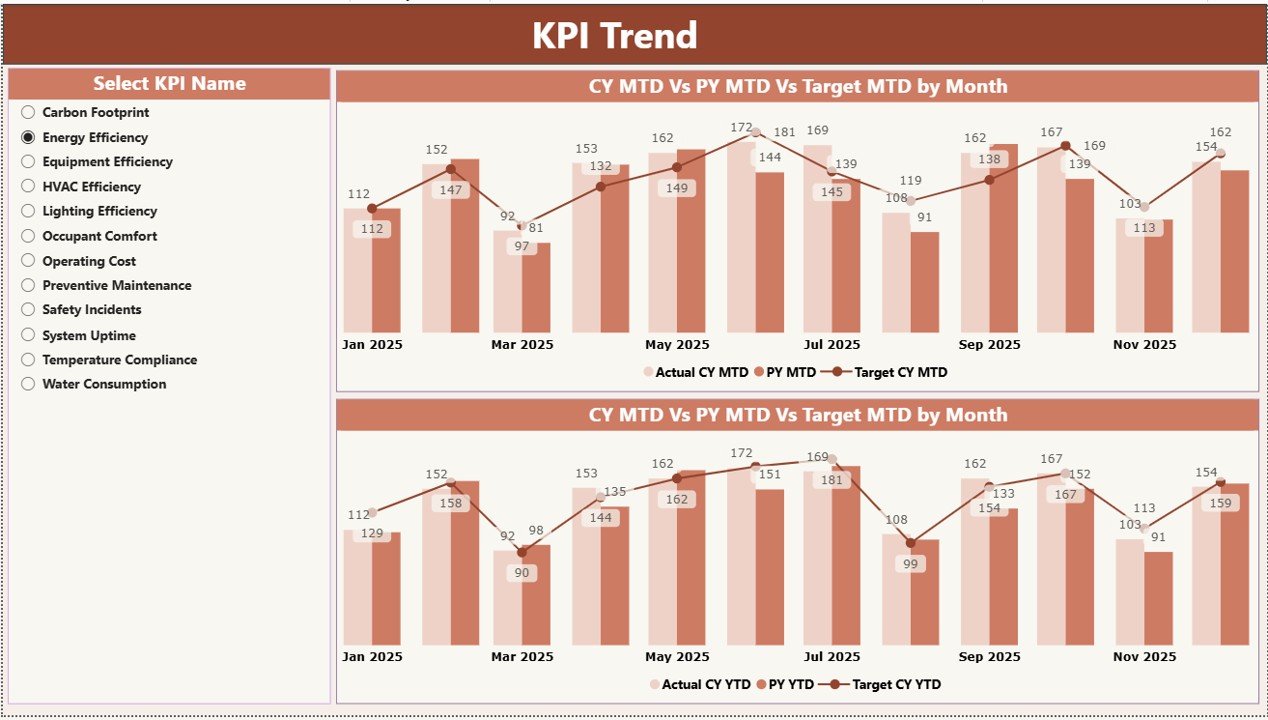
KPI Trend Page – Performance Analysis Over Time
The KPI Trend Page helps users analyze KPI performance trends.
This page focuses on historical comparisons.
Users can analyze how KPIs perform across months.
Key Features of the KPI Trend Page
This page includes two combo charts.
These charts display:
- Current Year Actual Values
- Previous Year Values
- Target Values
The charts show both MTD trends and YTD trends.
Therefore, managers can easily evaluate whether performance improves or declines over time.
KPI Selection Slicer
The left side of the page contains a KPI Name slicer.
Users can select a specific KPI to analyze its trend.
Once selected, the charts automatically update.
Because of this feature, users can perform deep KPI analysis easily.
Click to buy Building Automation KPI Dashboard in Power BI
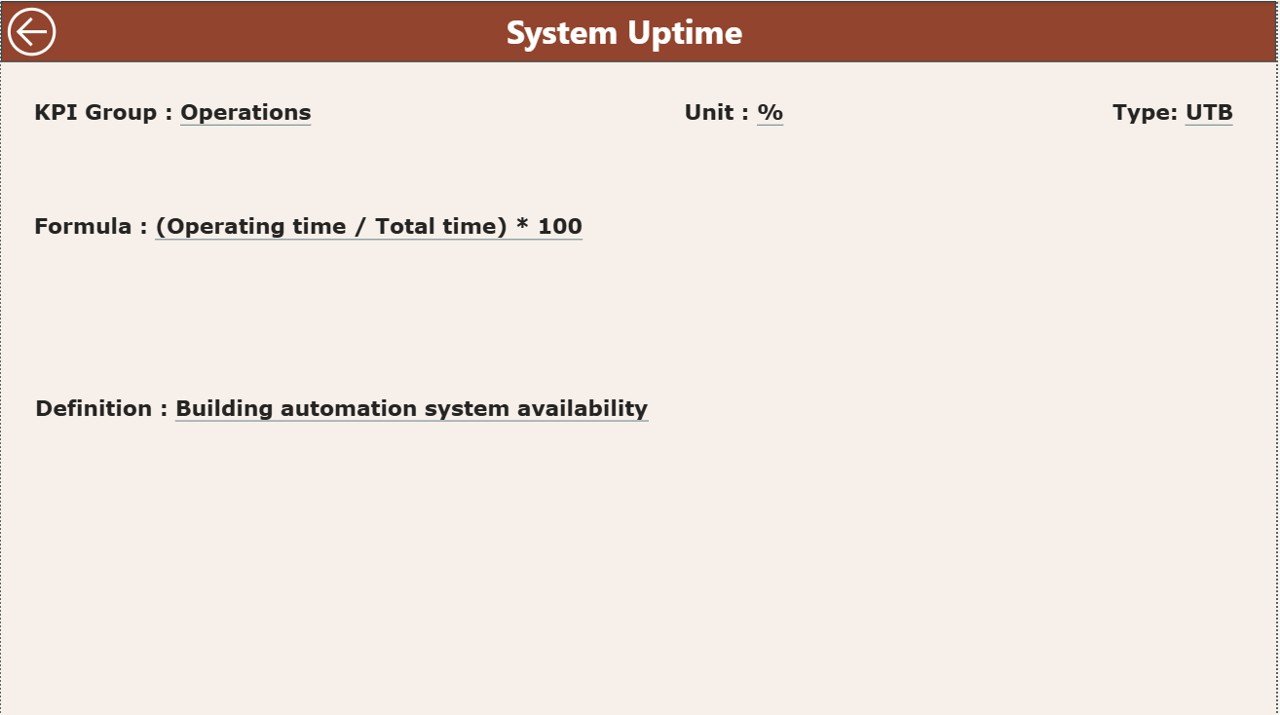
KPI Definition Page – Detailed KPI Information
The KPI Definition Page provides detailed information about each KPI.
This page acts as a drill-through page.
Users can access it directly from the summary page.
However, the page remains hidden by default.
Information Available on the KPI Definition Page
This page displays the following information:
- KPI Number
- KPI Name
- KPI Formula
- KPI Definition
- KPI Group
- KPI Measurement Unit
- KPI Type
Therefore, users can understand how each KPI is calculated.
Navigation Feature
To return to the main dashboard, users simply click the Back Button located in the top-left corner.
Click to buy Building Automation KPI Dashboard in Power BI
Excel Data Source Used in the Dashboard
The Building Automation KPI Dashboard in Power BI uses Excel as the data source.
Users must enter KPI data in an Excel file before loading it into Power BI.
The Excel file contains three worksheets.
Input_Actual Worksheet
This sheet stores actual KPI values.
Users must enter the following data:
- KPI Name
- Month (Use first day of month)
- MTD Value
- YTD Value
These values represent actual KPI performance.

Click to buy Building Automation KPI Dashboard in Power BI
Input_Target Worksheet
This sheet stores KPI target values.
Users must enter:
- KPI Name
- Month
- MTD Target
- YTD Target
Power BI uses these values to compare targets with actual results.
KPI Definition Worksheet
This worksheet stores detailed KPI definitions.
Users must fill the following fields:
- KPI Number
- KPI Group
- KPI Name
- Unit
- Formula
- Definition
- Type (LTB or UTB)
This information helps the dashboard generate meaningful insights.
Advantages of Building Automation KPI Dashboard in Power BI
Organizations gain multiple benefits when they use a Building Automation KPI Dashboard in Power BI.
- Centralized Performance Monitoring
Managers can monitor all building KPIs in one place.
Therefore, decision-making becomes faster and easier.
- Real-Time Data Insights
Power BI dashboards update automatically when data changes.
Consequently, managers always see the latest performance information.
- Better Decision Making
Interactive dashboards provide clear visual insights.
Thus, leaders make more informed decisions.
- Improved Operational Efficiency
When managers identify underperforming KPIs quickly, they take corrective action.
As a result, operational efficiency improves.
- Easy Data Analysis
Power BI simplifies complex data analysis through visual charts and reports.
Therefore, even non-technical users can understand performance data.
How Can Organizations Use This Dashboard Effectively?
Organizations can use this dashboard in several ways.
For example:
- Facility managers can monitor energy efficiency
- Maintenance teams can track equipment performance
- Executives can review building operational KPIs
- Engineers can analyze system performance trends
Because of these insights, organizations improve building operations significantly.
Best Practices for the Building Automation KPI Dashboard
Organizations must follow several best practices when implementing KPI dashboards.
Define Clear KPIs
Organizations must define meaningful KPIs that reflect operational performance.
For example:
- Energy consumption per square meter
- HVAC efficiency
- Maintenance response time
- Maintain Accurate Data
Data accuracy plays a critical role in KPI dashboards.
Therefore, teams must regularly update Excel data sources.
- Use Consistent KPI Definitions
All teams must use consistent KPI formulas.
This ensures reliable performance comparisons.
- Monitor Trends Regularly
Managers must review KPI trends regularly.
Trend analysis helps identify performance issues early.
- Automate Data Updates
Organizations should automate data integration whenever possible.
Automation improves reporting efficiency.
Common KPIs for Building Automation Systems
Organizations often track the following KPIs in building automation dashboards.
Energy KPIs
- Energy Consumption
- Energy Cost per Unit
- Energy Efficiency Index
Maintenance KPIs
- Preventive Maintenance Compliance
- Equipment Downtime
- Maintenance Cost
Operational KPIs
- System Uptime
- Response Time
- Equipment Performance Ratio
These KPIs help organizations maintain efficient building operations.
Future of Building Automation Analytics
Building automation technology continues to evolve rapidly.
Therefore, organizations increasingly rely on advanced analytics platforms like Power BI.
Future building analytics will include:
- IoT-based monitoring
- AI-driven predictive maintenance
- Real-time energy optimization
- Smart building automation systems
Consequently, KPI dashboards will become even more important for facility management.
Conclusion
The Building Automation KPI Dashboard in Power BI provides a powerful solution for monitoring building system performance.
Instead of analyzing scattered reports, organizations can track KPIs, analyze trends, and evaluate operational performance in one centralized dashboard.
Because the dashboard integrates Excel data with Power BI visualizations, users can easily monitor targets, compare historical performance, and identify operational improvements.
Moreover, the dashboard simplifies complex building data and transforms it into meaningful insights.
Therefore, organizations that implement KPI dashboards improve operational efficiency, reduce costs, and enhance building performance.
Frequently Asked Questions (FAQs)
What is a Building Automation KPI Dashboard?
A Building Automation KPI Dashboard is an analytical tool that tracks performance indicators related to building systems such as energy usage, equipment performance, and maintenance efficiency.
Why should organizations use Power BI for KPI dashboards?
Power BI offers powerful data visualization tools, interactive reports, and automated analytics. Therefore, organizations can analyze complex data easily.
What data source does the dashboard use?
The dashboard uses Excel files as the primary data source.
Users enter KPI data in Excel, and Power BI converts it into interactive reports.
What are MTD and YTD metrics?
- MTD (Month-to-Date) measures KPI performance for the current month.
- YTD (Year-to-Date) measures KPI performance from the beginning of the year until the current date.
What is the difference between LTB and UTB KPIs?
- LTB (Lower the Better) – Lower KPI values indicate better performance.
- UTB (Upper the Better) – Higher KPI values indicate better performance.
Can organizations customize the dashboard?
Yes. Organizations can modify KPIs, add new charts, and customize reports based on their operational requirements.
Visit our YouTube channel to learn step-by-step video tutorials
Watch the step-by-step video tutorial:
Click to buy Building Automation KPI Dashboard in Power BI