In today’s competitive business environment, organizations must track sales performance, revenue growth, deal progress, and market opportunities continuously. Companies that rely only on static reports often struggle to understand performance trends. As a result, decision-makers fail to respond quickly to changing business conditions.Therefore, businesses need a smart and interactive solution that converts raw sales data into meaningful insights. This is exactly where the Business Development Dashboard in Power BI becomes essential.A Business Development Dashboard helps organizations monitor deal pipelines, evaluate revenue performance, analyze lead sources, and improve sales strategies using visual analytics. Moreover, Power BI transforms complex data into easy-to-understand charts and KPIs, allowing leaders to make faster and smarter decisions.
In this comprehensive guide, you will learn everything about the Business Development Dashboard in Power BI, including its purpose, features, dashboard pages, benefits, implementation process, best practices, and frequently asked questions.
Click to buy Business Development Dashboard in Power BI
What Is a Business Development Dashboard in Power BI?
A Business Development Dashboard in Power BI is an interactive analytics solution designed to track and analyze business growth activities using key performance indicators (KPIs).
Instead of reviewing multiple spreadsheets and disconnected reports, organizations can centralize all business development metrics into one dynamic dashboard. Consequently, sales teams, managers, and executives gain complete visibility into performance.
This dashboard typically tracks:
- Deal value and pipeline performance
- Expected and actual revenue
- Lead source effectiveness
- Win probability and conversion rates
- Sales cycle duration
- Industry and regional performance trends
Because Power BI provides interactive filtering and visualization features, users can analyze performance from multiple perspectives instantly.
Why Do Businesses Need a Business Development Dashboard?
Many organizations collect large volumes of sales data every day. However, without structured visualization, this data remains underutilized.
A Business Development Dashboard solves several challenges:
- Managers cannot track deal progress clearly.
- Sales teams struggle to identify high-performing lead sources.
- Leadership lacks real-time revenue visibility.
- Forecasting becomes inaccurate.
- Decision-making slows down.
Therefore, companies adopt Power BI dashboards to turn raw data into actionable intelligence.
Moreover, when teams monitor KPIs regularly, they improve planning, forecasting, and performance management.
Key Features of the Business Development Dashboard in Power BI
The Business Development Dashboard includes multiple analytical pages designed to provide deep insights into sales and growth performance.
The dashboard contains five interactive pages, each focusing on a specific business dimension.
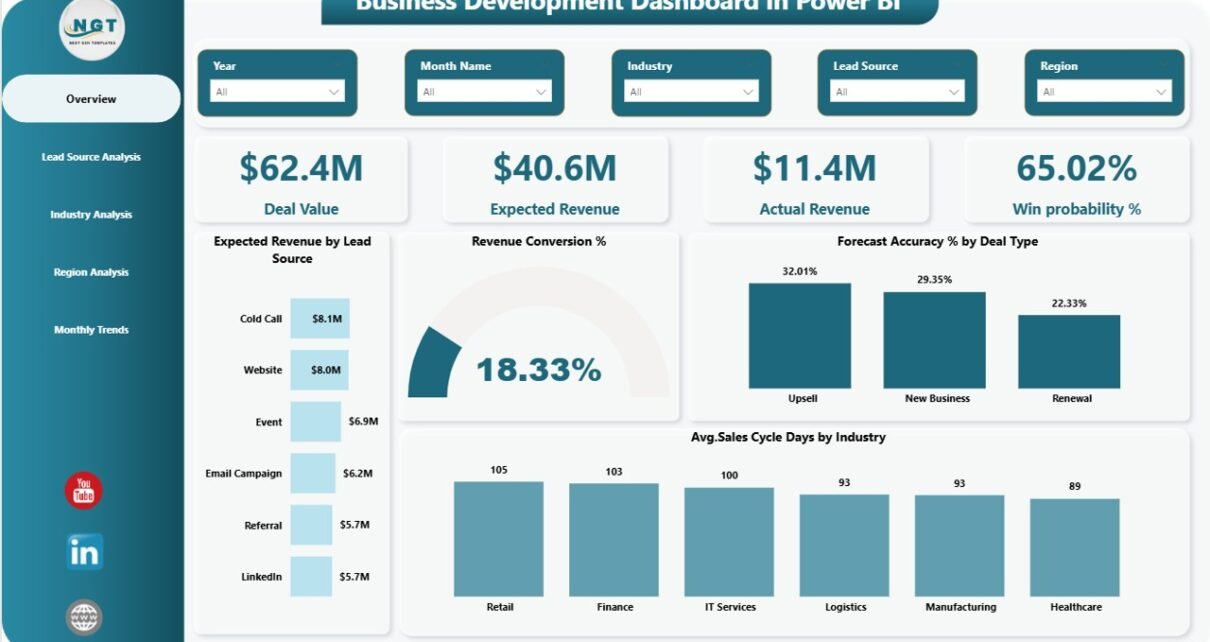
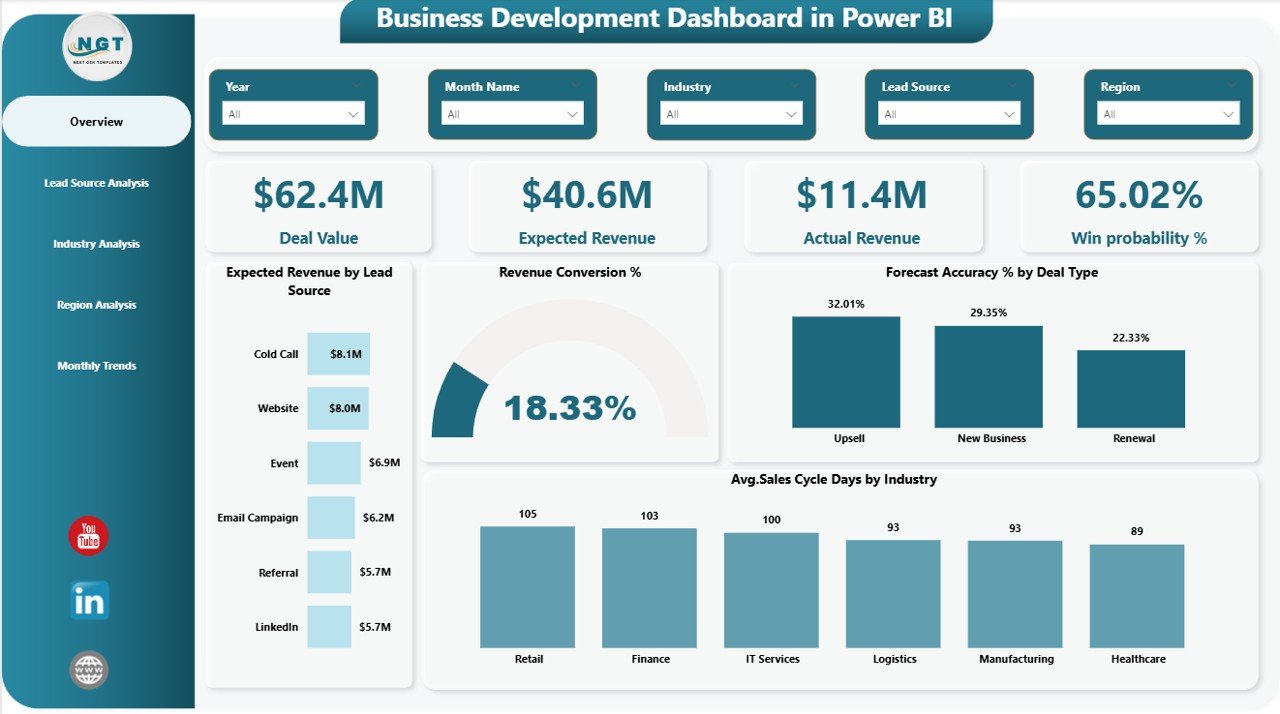
Overview Page – The Central Performance Hub
The Overview Page acts as the main interface of the dashboard. Users can quickly understand overall business performance without navigating through multiple reports.
KPI Cards Available
The dashboard displays four important KPI cards:
- Deal Value – Total value of active opportunities
- Expected Revenue – Forecasted income from deals
- Actual Revenue – Revenue already achieved
- Win Probability % – Likelihood of deal closure
These cards provide instant performance visibility. As a result, decision-makers immediately understand business health.
Charts Available on Overview Page
The page also includes four analytical charts:
- Expected Revenue by Lead Source
- Revenue Conversion %
- Forecast Accuracy % by Deal Type
- Average Sales Cycle Days by Industry
Because these visuals update dynamically using slicers, users can filter results by time period, category, or other dimensions.
Click to buy Business Development Dashboard in Power BI
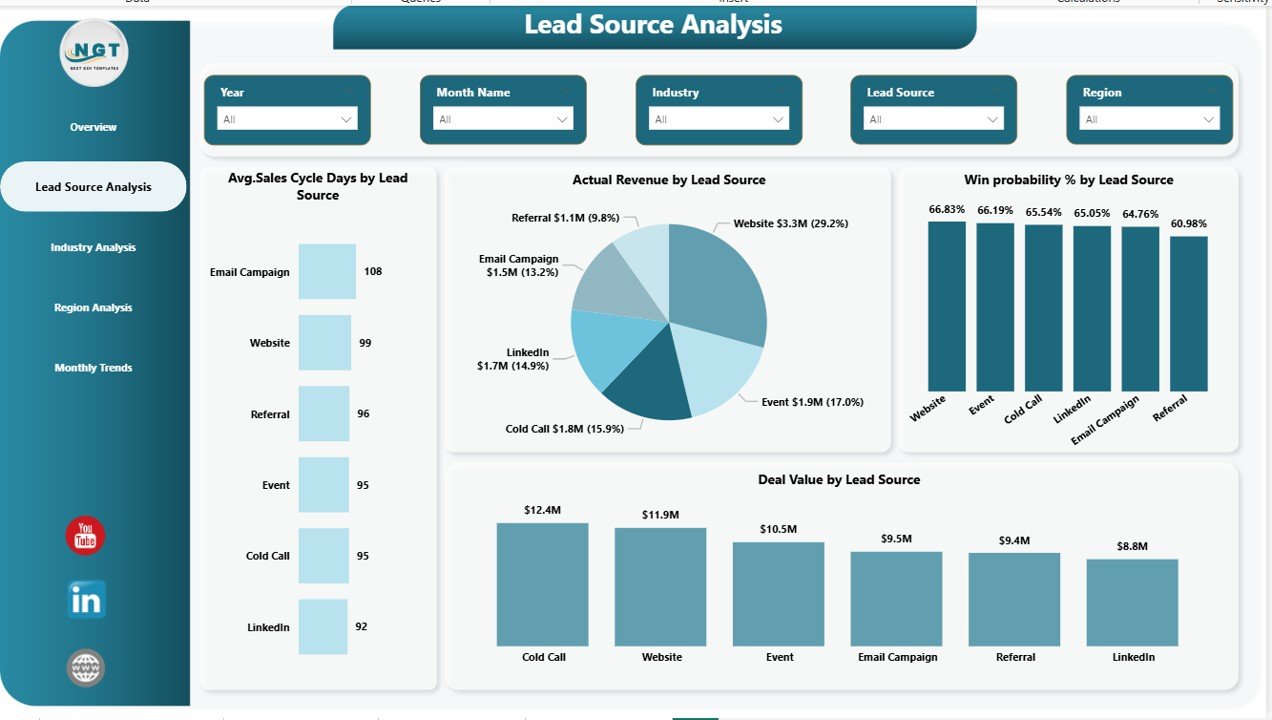
Lead Source Analysis – Which Channels Drive Growth?
Lead sources play a critical role in business development success. However, many organizations fail to evaluate which marketing channels deliver the best results.
The Lead Source Analysis Page helps teams measure source effectiveness clearly.
Key Charts Included
- Average Sales Cycle Days by Lead Source
- Actual Revenue by Lead Source
- Win Probability % by Lead Source
With these insights, businesses can:
- Invest more in profitable channels
- Reduce spending on low-performing sources
- Improve marketing ROI
Therefore, marketing and sales teams align strategies effectively.
Click to buy Business Development Dashboard in Power BI
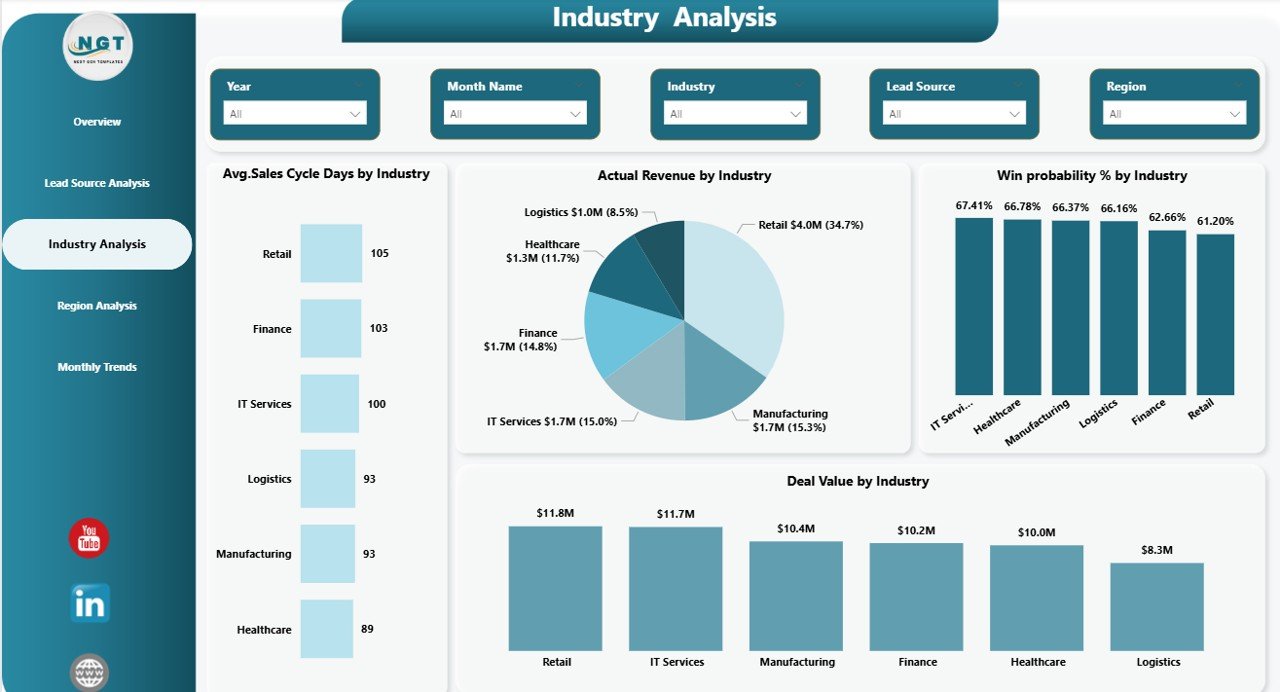
Industry Analysis – Understanding Market Performance
Different industries behave differently. Some industries close deals quickly, while others require longer negotiation cycles.
The Industry Analysis Page allows businesses to evaluate performance across sectors.
Charts Included
- Average Sales Cycle Days by Industry
- Actual Revenue by Industry
- Win Probability % by Industry
- Deal Value by Industry
Because of this analysis, companies identify high-value industries and prioritize resources accordingly.
Furthermore, sales leaders can tailor strategies for specific sectors.
Click to buy Business Development Dashboard in Power BI
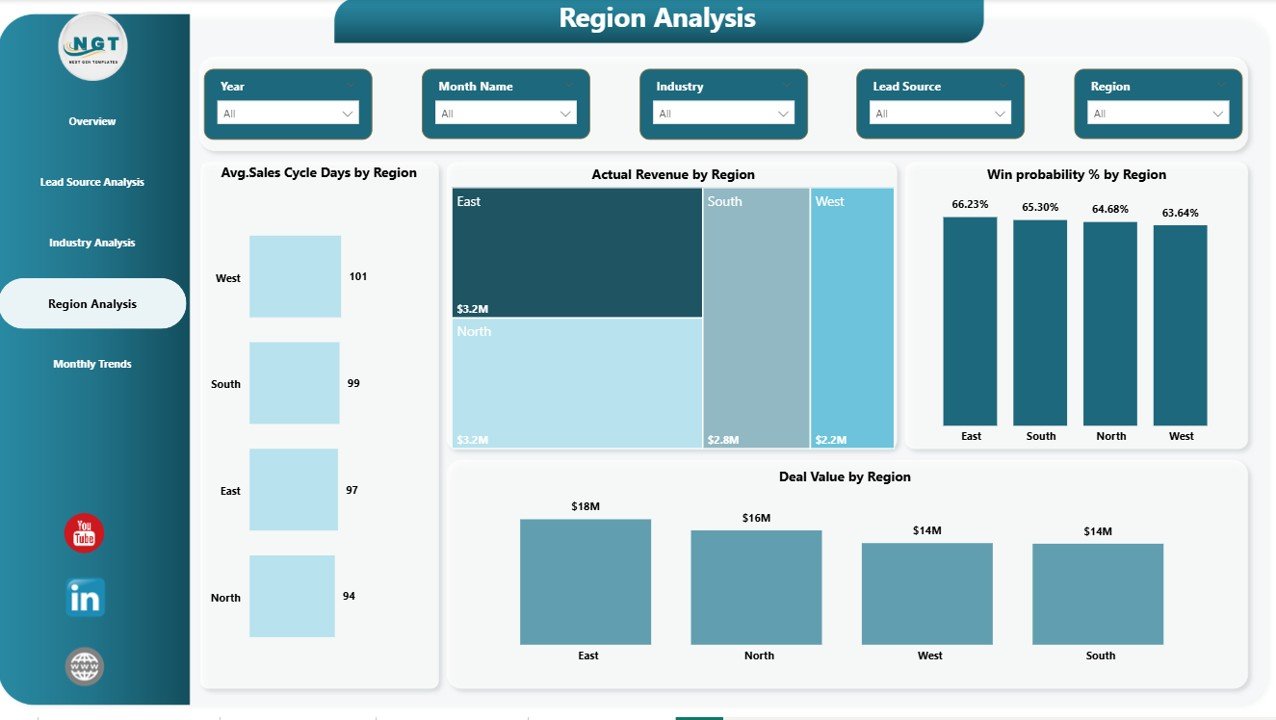
Region Analysis – Measuring Geographic Performance
Regional performance often determines overall business growth. Therefore, organizations must analyze results across territories.
The Region Analysis Dashboard focuses on geographic insights.
Key Charts
- Average Sales Cycle Days by Region
- Actual Revenue by Region
- Win Probability % by Region
- Deal Value by Region
These visuals help organizations:
- Identify top-performing regions
- Detect underperforming markets
- Allocate sales teams efficiently
As a result, regional managers make data-driven decisions confidently.
Click to buy Business Development Dashboard in Power BI
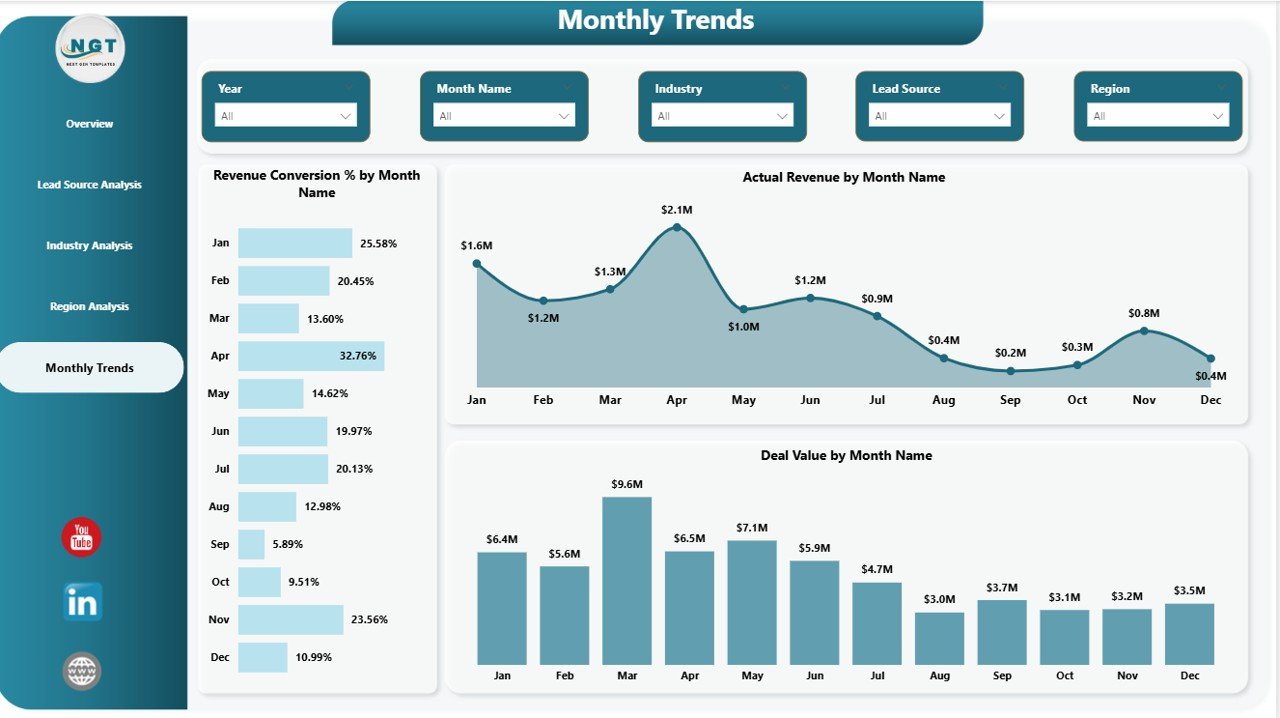
Monthly Trends – Tracking Performance Over Time
Trend analysis helps organizations understand growth patterns. Without historical comparison, teams cannot measure improvement accurately.
The Monthly Trends Page provides time-based analysis.
Charts Included
- Revenue Conversion % by Month
- Actual Revenue by Month
- Deal Value by Month
Because trends appear visually, users easily identify seasonal patterns, growth spikes, or performance declines.
Consequently, forecasting becomes more accurate.
Click to buy Business Development Dashboard in Power BI
What KPIs Does a Business Development Dashboard Track?
A typical Business Development Dashboard monitors essential KPIs such as:
- Total Deal Value
- Expected Revenue
- Actual Revenue
- Revenue Conversion Rate
- Win Probability Percentage
- Forecast Accuracy
- Average Sales Cycle Days
- Lead Source Performance
- Industry Contribution
- Regional Revenue Performance
These KPIs help organizations measure both operational efficiency and revenue success.
How Does Power BI Improve Business Development Analytics?
Power BI enhances analytics capabilities in several ways.
Interactive Visualizations
Users explore data through charts, filters, and slicers.
Real-Time Insights
Dashboards update automatically when data refreshes.
Centralized Reporting
All business metrics remain available in one location.
Data Integration
Power BI connects easily with Excel, CRM systems, and databases.
Faster Decision-Making
Leaders access insights instantly instead of waiting for reports.
Therefore, organizations improve responsiveness and agility.
Advantages of Business Development Dashboard in Power BI
Implementing this dashboard delivers several business advantages. Improved Revenue Visibility
Managers monitor actual and expected revenue continuously.
Better Sales Strategy Planning
Teams identify winning deal patterns quickly.
Enhanced Forecast Accuracy
Historical trends improve prediction reliability.
Stronger Lead Management
Organizations focus on high-performing lead sources.
Faster Decision-Making
Visual insights reduce analysis time.
Increased Team Productivity
Sales teams spend less time creating reports.
Data-Driven Culture
Employees rely on insights instead of assumptions.
How to Implement a Business Development Dashboard in Power BI?
Organizations can follow a structured process for implementation.
Step 1: Define Business KPIs
First, identify measurable performance indicators aligned with goals.
Step 2: Prepare Data Source
Collect data from CRM, Excel, or ERP systems.
Step 3: Clean and Transform Data
Use Power Query to remove errors and standardize formats.
Step 4: Create Data Model
Build relationships between tables for accurate calculations.
Step 5: Design Dashboard Pages
Develop Overview, Lead Source, Industry, Region, and Trend pages.
Step 6: Add Visualizations
Insert charts, cards, and slicers.
Step 7: Publish and Share
Upload dashboard to Power BI Service for collaboration.
Best Practices for the Business Development Dashboard in Power BI
To achieve maximum value, organizations should follow these best practices.
Keep KPIs Focused
Avoid adding too many metrics. Instead, track actionable KPIs.
Use Consistent Visual Design
Maintain uniform colors and layouts across pages.
Enable Interactive Filters
Allow users to analyze data dynamically.
Update Data Regularly
Schedule automatic data refresh.
Monitor Forecast Accuracy
Compare predicted revenue with actual performance.
Train Users Properly
Ensure teams understand how to interpret visuals.
Optimize Performance
Use efficient data models and DAX calculations.
Common Challenges and How to Overcome Them
Although dashboards provide powerful insights, organizations may face challenges.
Data Quality Issues
Poor data leads to incorrect insights. Therefore, validate data sources regularly.
User Adoption Problems
Provide training sessions to encourage usage.
Overloaded Visuals
Keep dashboards simple and focused.
Lack of KPI Alignment
Ensure KPIs match business objectives.
By addressing these issues early, companies maximize dashboard success.
Who Can Benefit from a Business Development Dashboard?
Many professionals benefit from this solution:
- Sales Managers
- Business Development Executives
- Marketing Teams
- Revenue Analysts
- Senior Management
- Startup Founders
- Consultants
Because the dashboard simplifies analytics, both technical and non-technical users can utilize it easily.
Future of Business Development Analytics with Power BI
Business analytics continues to evolve rapidly. Organizations increasingly rely on predictive analytics and AI-driven insights.
Power BI supports this evolution through:
- AI visuals and forecasting tools
- Automated insights generation
- Cloud-based collaboration
- Real-time dashboards
Therefore, businesses adopting Power BI today prepare themselves for future analytics transformation.
Conclusion
The Business Development Dashboard in Power BI provides a powerful solution for tracking revenue, analyzing deal performance, and improving strategic decision-making.
Instead of depending on manual reports, organizations gain real-time visibility into their business development activities. Moreover, interactive visuals allow teams to analyze performance across lead sources, industries, regions, and time periods effortlessly.
As businesses continue to compete in fast-changing markets, data-driven decision-making becomes essential. Therefore, implementing a Business Development Dashboard not only improves operational efficiency but also drives sustainable growth.
In short, this dashboard transforms business data into actionable insights that support smarter strategies and stronger results.
Frequently Asked Questions (FAQs)
- What is a Business Development Dashboard in Power BI?
It is an interactive reporting dashboard that tracks sales performance, revenue metrics, and deal analytics using Power BI visuals.
- Who should use this dashboard?
Sales managers, business development teams, executives, and analysts benefit the most from it.
- Can Power BI connect with Excel data?
Yes. Power BI connects easily with Excel, databases, and CRM systems.
- How often should the dashboard update?
Organizations should refresh data daily or weekly depending on business needs.
- Does this dashboard help improve forecasting?
Yes. Historical trends and KPI tracking improve forecast accuracy significantly.
- Is Power BI suitable for small businesses?
Absolutely. Power BI offers scalable analytics suitable for startups and enterprises.
- What are the most important KPIs in business development?
Deal value, revenue conversion rate, win probability, and sales cycle duration remain key metrics.
Visit our YouTube channel to learn step-by-step video tutorials
Watch the step-by-step video tutorial:
Click to buy Business Development Dashboard in Power BI