In today’s competitive business environment, understanding the true value of a company plays a critical role in decision-making. Whether you plan mergers, acquisitions, investments, or strategic growth, you must rely on accurate data. However, many professionals still use scattered spreadsheets and manual calculations. As a result, they miss insights and delay important decisions.
Therefore, businesses now shift toward smart and automated tools. One of the most effective solutions is the Business Valuation Dashboard in Excel.
Click to Purchases Business Valuation Dashboard in Excel
This powerful, ready-to-use dashboard helps you analyze financial performance, compare valuation metrics, and make data-driven decisions with ease. Moreover, it transforms complex financial data into clear visual insights.
In this detailed guide, you will learn everything about the Business Valuation Dashboard in Excel, including its features, structure, benefits, best practices, and frequently asked questions.
📌 What is a Business Valuation Dashboard in Excel?
A Business Valuation Dashboard in Excel is an interactive analytical tool that helps users evaluate the financial worth of a business.
Instead of relying on multiple sheets, you can monitor all key metrics in one centralized dashboard. Additionally, it uses Excel charts, slicers, and KPI indicators to present data in a visual and easy-to-understand format.
With this dashboard, you can:
-
Track company valuation metrics
-
Compare industry performance
-
Analyze risk factors
-
Monitor financial health
-
Evaluate growth trends
As a result, decision-makers gain better clarity and act faster.
🚀 Why Should You Use a Business Valuation Dashboard?
Many businesses struggle to understand their real value because data remains scattered. However, a dashboard solves this problem effectively.
Here’s why you should use it:
-
📊 Centralized financial insights
-
⚡ Faster decision-making
-
📈 Better investment analysis
-
🎯 Improved accuracy in valuation
-
🔍 Clear comparison across industries
Therefore, this dashboard becomes an essential tool for analysts, investors, and business owners.
🧩 Key Features of Business Valuation Dashboard in Excel
Click to Purchases Business Valuation Dashboard in Excel
This ready-to-use dashboard comes with a structured design and interactive elements. Let’s explore each component in detail.
🧭 Page Navigator
The Page Navigator, located on the left side, allows users to switch between different dashboard pages easily.
Because of this feature, users can quickly move from overview insights to detailed analysis without confusion.
📊 1. Overview Page – Get a Quick Snapshot
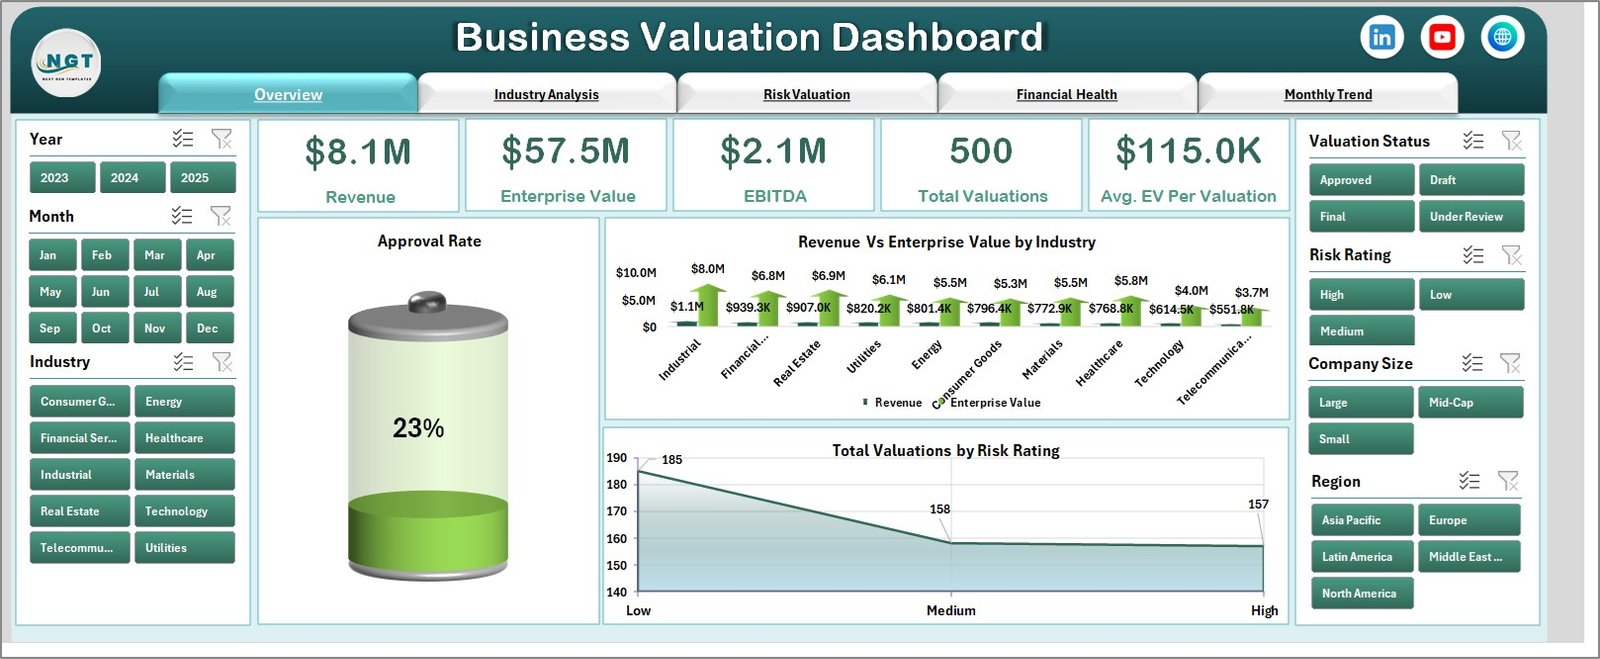
The Overview Page acts as the main dashboard. It provides a high-level summary of business valuation.
Key elements:
-
🔘 Slicer (Filter) on the right side for dynamic selection
-
📌 4 KPI Cards to show key metrics
-
📈 Charts:
-
Approved Rate
-
Revenue vs Enterprise Value by Industry
-
Total Valuation by Risk Rating
-
👉 As a result, users can quickly understand overall performance.
🏭 2. Industry Analysis – Compare Across Sectors
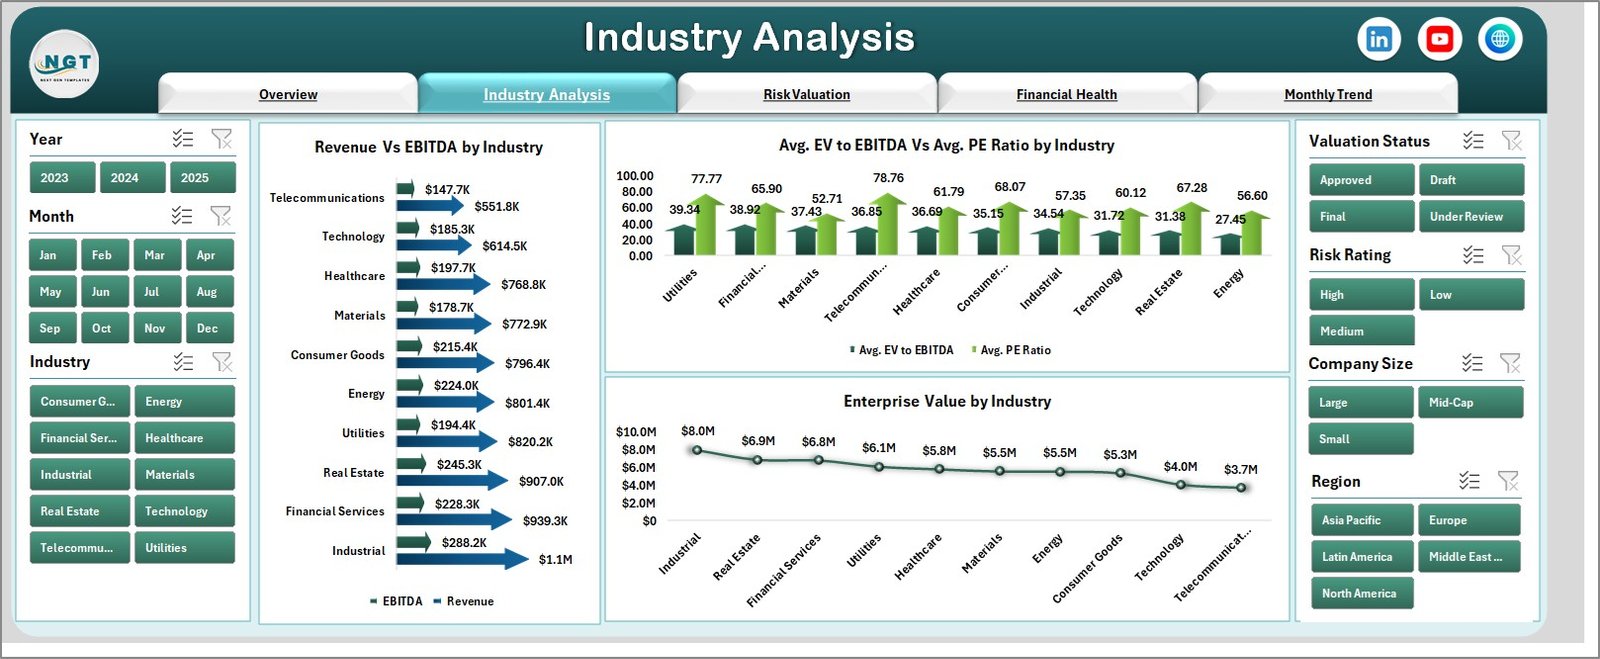
The Industry Analysis Page helps you compare valuation metrics across industries.
Key visuals:
-
📊 Revenue vs EBITDA by Industry
-
📊 Avg. EV to EBITDA vs Avg. PE Ratio
-
📊 Enterprise Value by Industry
Because of these charts, users can identify which industries perform better and where opportunities exist.
Click to Purchases Business Valuation Dashboard in Excel
⚠️ 3. Risk Valuation – Analyze Risk Impact
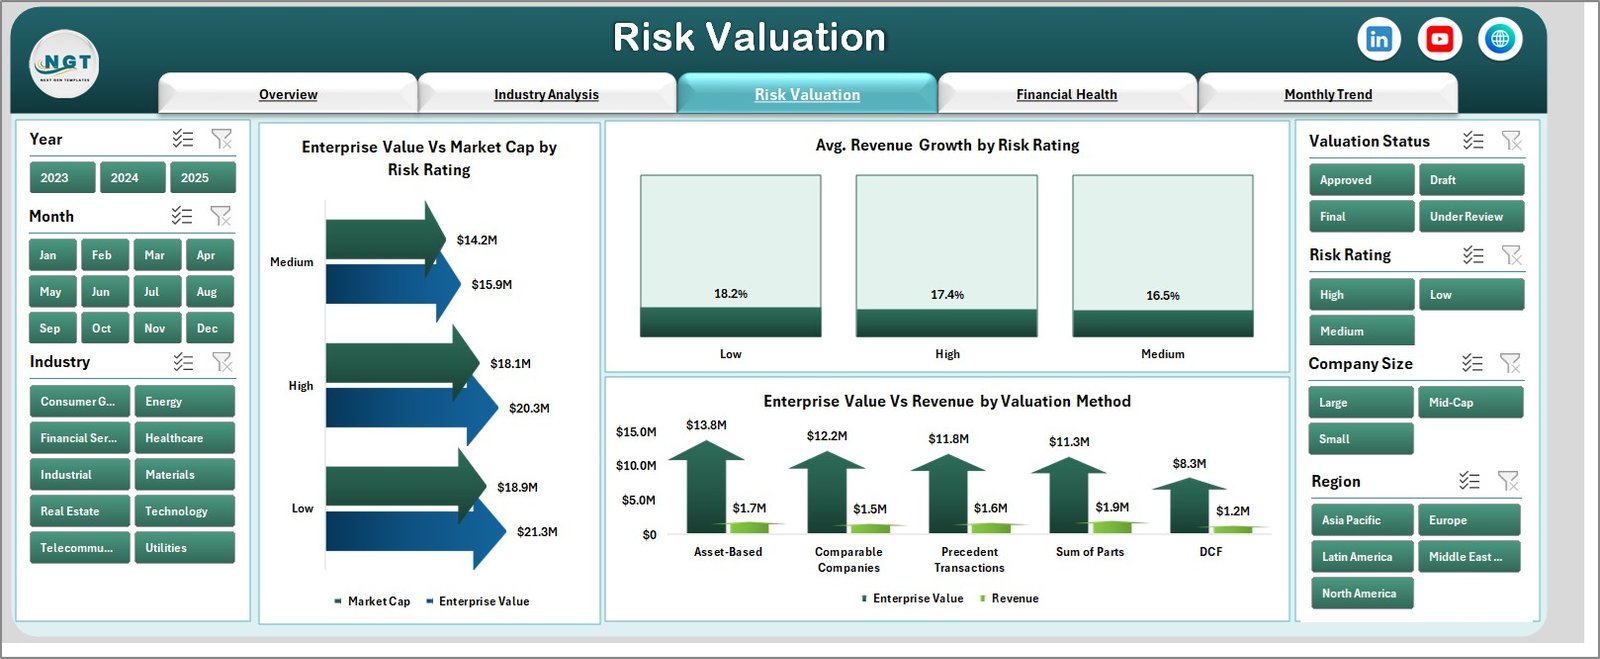
Understanding risk plays a key role in valuation. Therefore, this page focuses on risk-based insights.
Key charts:
-
📉 Enterprise Value vs Market Cap by Risk Rating
-
📈 Avg. Revenue Growth by Risk Rating
-
📊 Enterprise Value vs Revenue by Valuation Method
👉 This helps users evaluate how risk affects business value.
💰 4. Financial Health – Evaluate Stability
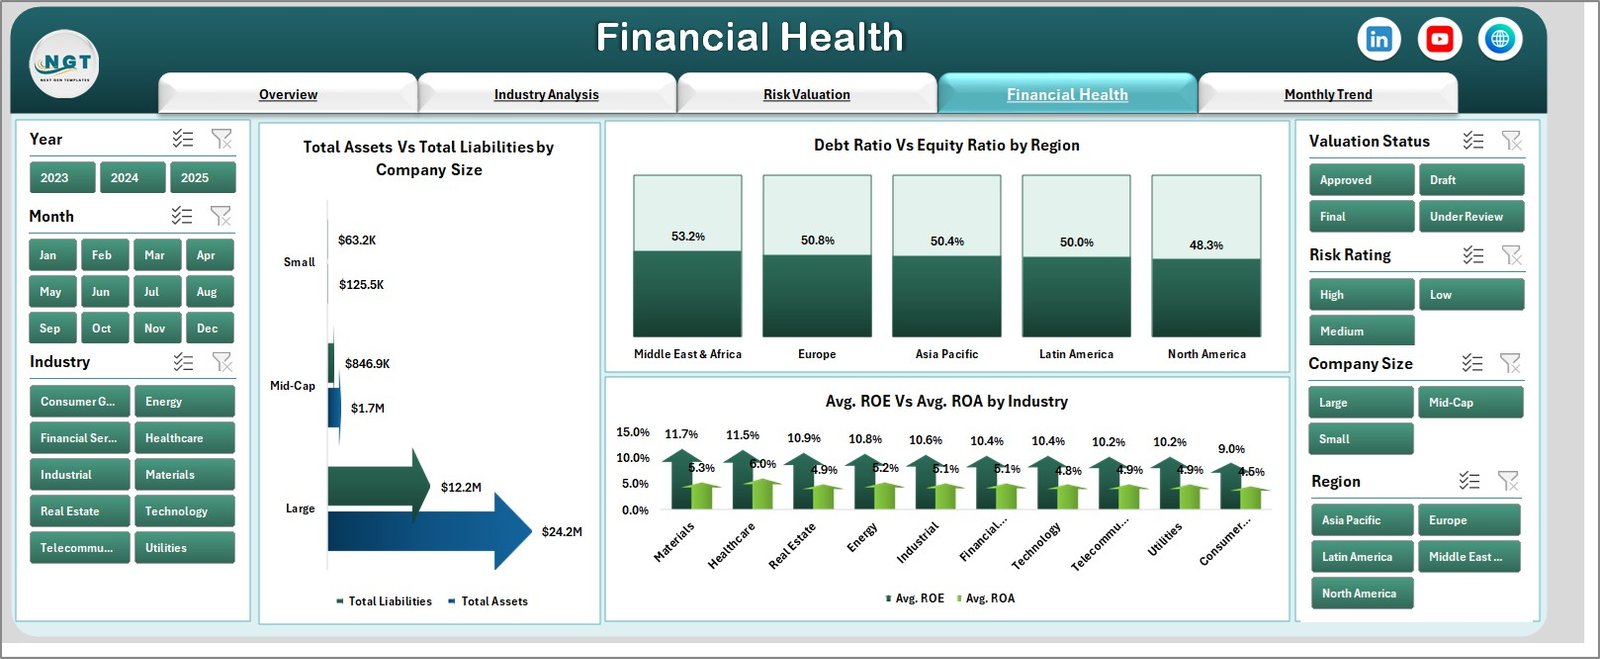
The Financial Health Page provides insights into the company’s financial strength.
Key charts:
-
📊 Total Assets vs Total Liabilities by Company Size
-
📊 Debt Ratio vs Equity Ratio by Region
-
📊 Avg. ROE vs Avg. ROA by Industry
Therefore, users can assess profitability, stability, and financial efficiency.
📅 5. Month Analysis – Track Trends Over Time
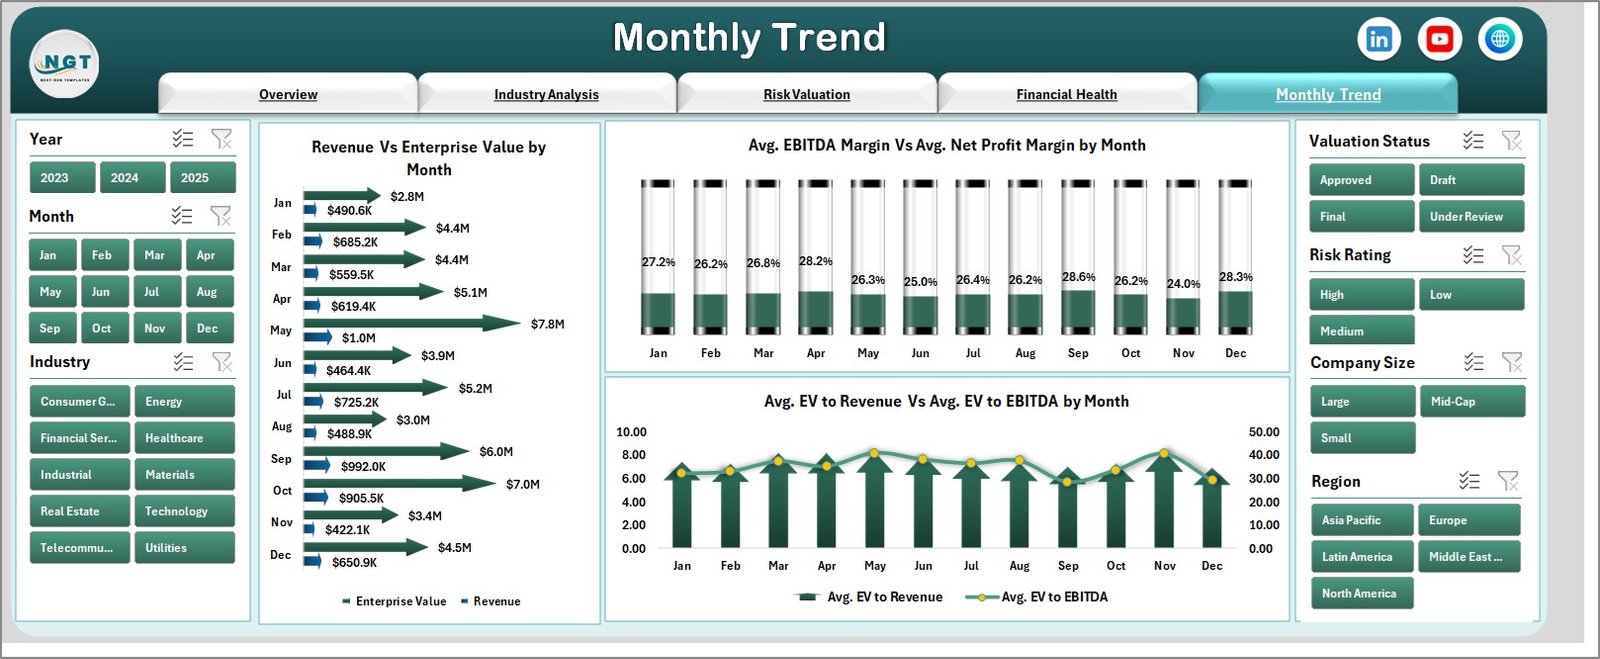
The Month Analysis Page focuses on time-based performance.
Key charts:
-
📈 Revenue vs Enterprise Value by Month
-
📊 Avg. EBITDA Margin vs Avg. Profit Margin
-
📊 Avg. EV to Revenue vs Avg. EV to EBITDA
👉 This allows users to identify trends and seasonal patterns.
Click to Purchases Business Valuation Dashboard in Excel
📂 Support Sheet & Data Sheet
-
Data Sheet: Stores all raw data
-
Support Sheet: Handles calculations and formulas
Because of this structure, the dashboard remains clean, efficient, and easy to maintain.
📈 How Does the Business Valuation Dashboard Work?
The dashboard works in a simple yet powerful way.
Step-by-step process:
-
Enter data in the Data Sheet
-
Calculations update automatically in the Support Sheet
-
Dashboard visuals update instantly
-
Use slicers to filter and analyze
As a result, users get real-time insights without manual effort.
🎯 What Metrics Are Tracked in This Dashboard?
This dashboard tracks essential valuation and financial metrics such as:
-
Enterprise Value (EV)
-
EBITDA
-
Revenue
-
Market Capitalization
-
EV to EBITDA Ratio
-
Price to Earnings (P/E) Ratio
-
Debt Ratio & Equity Ratio
-
Return on Equity (ROE)
-
Return on Assets (ROA)
-
Revenue Growth
-
Profit Margins
Therefore, it covers both valuation and financial performance.
💡 Advantages of Business Valuation Dashboard in Excel
Using this dashboard offers multiple benefits. Let’s explore them.
✅ Key Advantages:
-
📊 Centralized Data View – All metrics in one place
-
⚡ Real-Time Analysis – Instant updates with data changes
-
🎯 Improved Accuracy – Reduces manual errors
-
📈 Better Insights – Visual representation of data
-
🔍 Easy Comparison – Industry, risk, and time analysis
-
💼 Professional Reporting – Ideal for presentations
👉 As a result, businesses can make smarter financial decisions.
🛠️ Best Practices for the Business Valuation Dashboard in Excel
To get the best results, you should follow these best practices.
⭐ Best Practices:
-
📌 Keep data clean and structured
-
📅 Update data regularly
-
🔍 Use consistent formats for financial metrics
-
📊 Avoid unnecessary charts to maintain clarity
-
🎯 Focus on key KPIs only
-
⚡ Optimize formulas for better performance
-
📂 Maintain backup copies
Because of these practices, your dashboard will stay accurate and efficient.
⚠️ Common Mistakes to Avoid
Although dashboards are powerful, mistakes can reduce their effectiveness.
❌ Avoid these errors:
-
Using inconsistent data formats
-
Ignoring data validation
-
Overloading the dashboard with visuals
-
Not updating data regularly
-
Misinterpreting financial ratios
Therefore, always ensure proper data handling.
📊 Who Can Benefit from This Dashboard?
This dashboard suits multiple professionals and industries.
👥 Ideal Users:
-
Financial Analysts
-
Investment Bankers
-
Business Owners
-
Consultants
-
CFOs & Finance Teams
-
Startup Founders
👉 In short, anyone involved in financial decision-making can use it.
🔄 How to Customize This Dashboard?
One of the biggest advantages of Excel is flexibility.
You can easily customize:
-
Add new KPIs
-
Modify charts
-
Change slicers
-
Include additional data fields
-
Adjust formulas
Therefore, the dashboard adapts to your business needs.
Click to Purchases Business Valuation Dashboard in Excel
🌟 Future Scope of Business Valuation Dashboards
As technology evolves, dashboards become more powerful.
Future trends include:
-
Integration with Power BI
-
Automation with VBA
-
AI-based insights
-
Cloud-based dashboards
Therefore, businesses should adopt dashboards early.
🧾 Conclusion
The Business Valuation Dashboard in Excel provides a powerful and practical solution for analyzing company value. Instead of relying on manual calculations, you can use this dashboard to gain clear insights and make faster decisions.
Moreover, it simplifies complex financial data into easy visuals. Because of its flexibility and efficiency, it becomes an essential tool for modern businesses.
If you want to improve financial analysis and decision-making, this dashboard will help you achieve your goals effectively.
❓ Frequently Asked Questions (FAQs)
1. What is the purpose of a Business Valuation Dashboard?
It helps analyze and visualize the financial value of a business using key metrics and charts.
2. Can beginners use this dashboard?
Yes, the dashboard is user-friendly and requires basic Excel knowledge.
3. Do I need advanced Excel skills?
No, you only need basic skills to use it. However, advanced skills help in customization.
4. Can I customize the dashboard?
Yes, you can modify KPIs, charts, and data fields based on your needs.
5. How often should I update the data?
You should update the data regularly, preferably monthly or weekly.
6. Is this dashboard useful for investors?
Yes, investors can use it to evaluate company performance and make better decisions.
7. What industries can use this dashboard?
All industries can use it, including finance, manufacturing, healthcare, and startups.
8. Does it support real-time data?
It updates instantly when you enter new data in Excel.
9. Can I integrate it with Power BI?
Yes, you can connect Excel data to Power BI for advanced analytics.
10. Is it suitable for large datasets?
Yes, but you should optimize formulas for better performance.
Visit our YouTube channel to learn step-by-step video tutorials