The car rental industry is becoming more competitive every year. With rising customer expectations, fluctuating fuel costs, and an increasing demand for digital experiences, companies need a reliable way to measure performance. Spreadsheets and manual reports no longer provide timely insights. This is where a Car Rental KPI Dashboard in Power BI comes in.
A Power BI dashboard brings your car rental data to life with interactive visuals, real-time updates, and drill-through analysis. Instead of juggling multiple files, you can track business performance at a glance. In this article, we’ll explore everything you need to know about the Car Rental KPI Dashboard in Power BI—its structure, features, advantages, best practices, and how you can use it to drive business growth.
What Is a Car Rental KPI Dashboard in Power BI?
A Car Rental KPI Dashboard is a pre-built, ready-to-use reporting solution that consolidates car rental business data into interactive dashboards. It uses Excel files as data input and transforms them into real-time insights in Power BI.
This dashboard allows you to:
-
Track fleet utilization rates.
-
Monitor customer satisfaction scores.
-
Compare actual vs. target performance for both MTD (Month-to-Date) and YTD (Year-to-Date).
-
Identify areas where your car rental operations are exceeding targets or falling behind.
Instead of waiting for monthly reports, decision-makers can view performance instantly and take quick action.
Structure of the Car Rental KPI Dashboard in Power BI
This dashboard consists of three key pages that provide different levels of analysis.
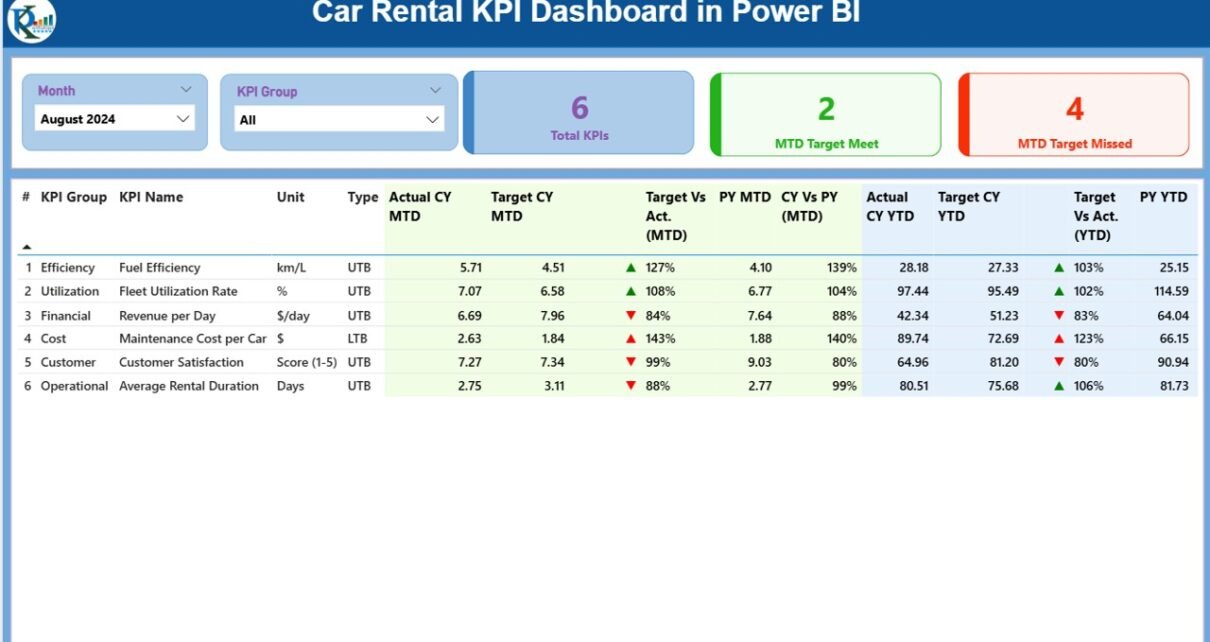
Summary Page
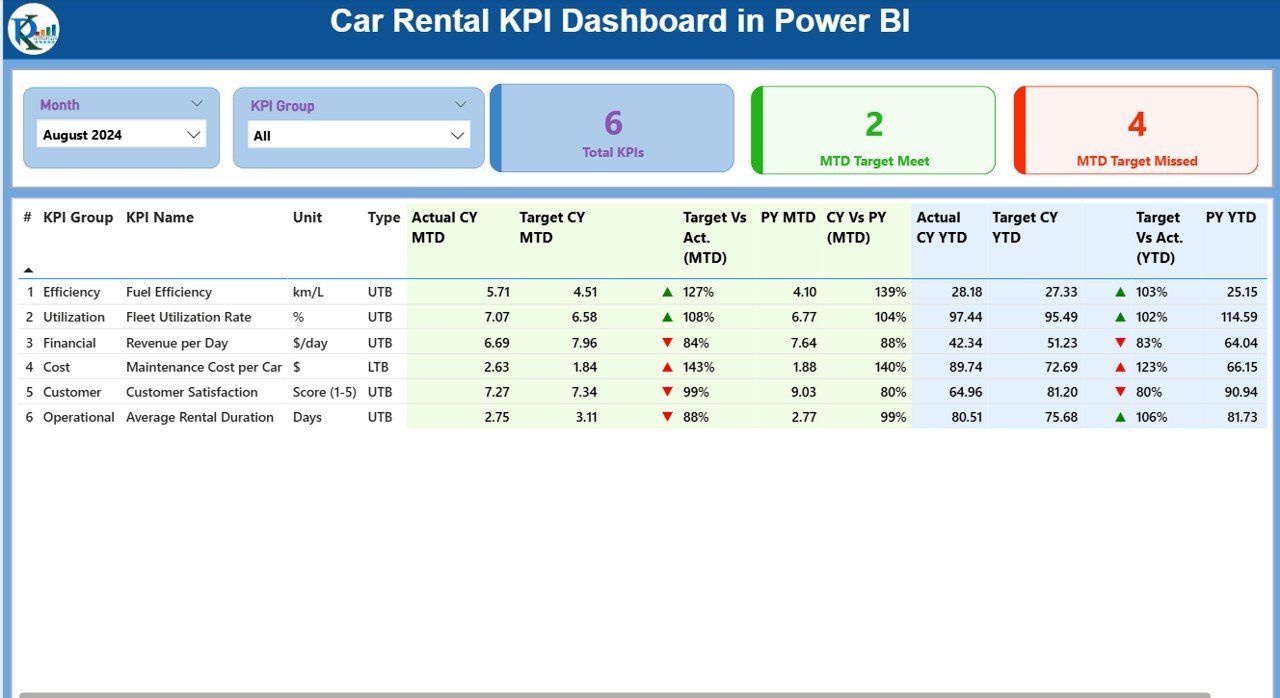
The Summary Page is the main control center of the dashboard. It gives a high-level snapshot of your car rental KPIs.
Key Features:
-
Slicers for Month and KPI Group to filter results quickly.
Cards at the top:
- Total KPIs Count
- MTD Target Met Count
- MTD Target Missed Count
Detailed KPI Table showing:
- KPI Number (sequence ID)
- KPI Group (e.g., Operations, Finance, Customer Service)
- KPI Name
- Unit of Measurement
- Type (UTB – Upper the Better, LTB – Lower the Better)
- Actual CY MTD (Current Year, Month-to-Date)
- Target CY MTD
- MTD Icon (▲/▼ with green/red color)
- Target vs. Actual % (MTD)
- Previous Year MTD
- CY vs. PY % (MTD)
- Actual CY YTD (Year-to-Date)
- Target CY YTD
- YTD Icon (▲/▼)
- Target vs. Actual % (YTD)
- Previous Year YTD
- CY vs. PY % (YTD)
This table allows managers to instantly see which KPIs are on track and which need attention.
KPI Trend Page
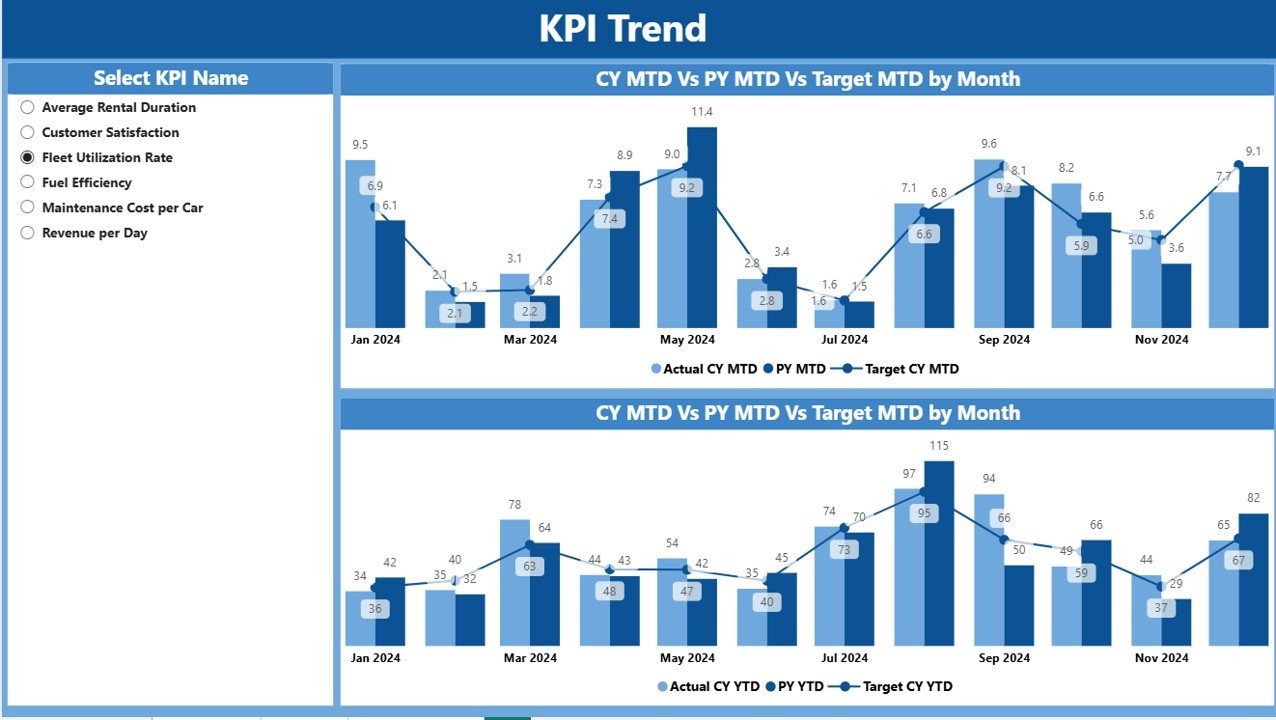
The KPI Trend Page focuses on performance analysis over time.
Key Features:
-
Two combo charts for visualizing Actuals vs. Targets for both MTD and YTD.
-
Slicer to select KPI Name for deeper analysis.
-
Ability to compare Current Year vs. Previous Year trends.
This page is especially useful for tracking long-term performance and seasonal variations in rental demand.
KPI Definition Page
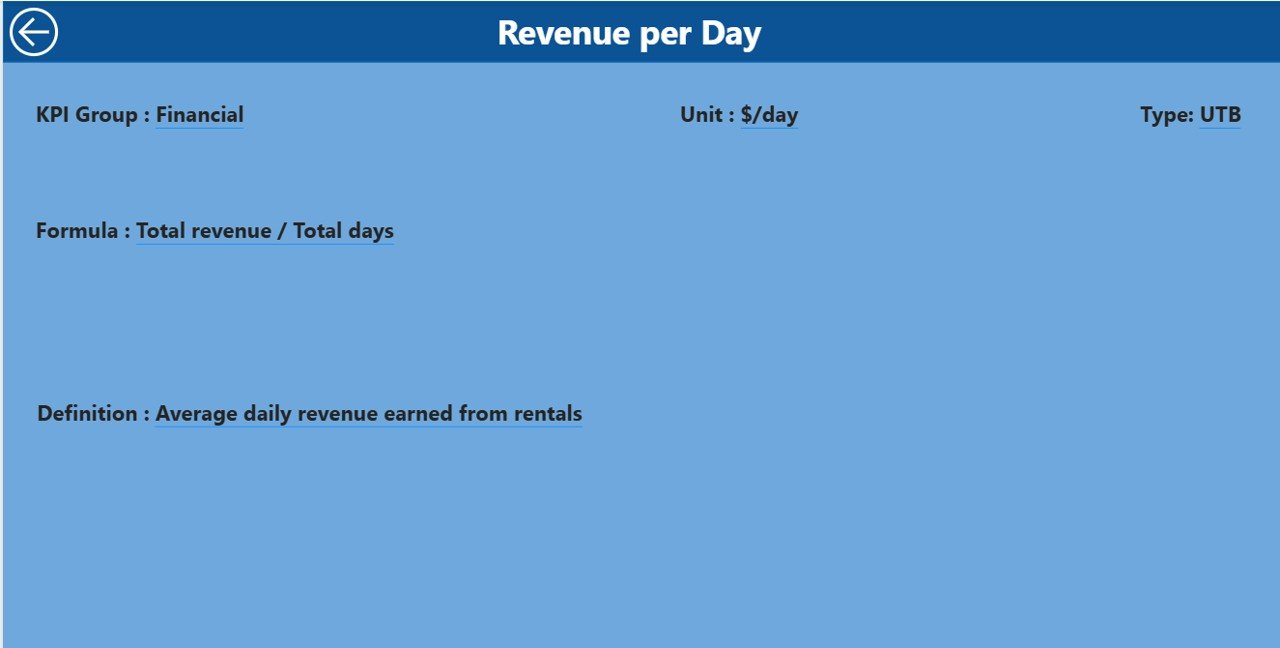
The KPI Definition Page is a hidden drill-through page for advanced users.
Key Features:
-
Shows KPI details such as Formula, Definition, and KPI Type.
-
Accessible by drilling through from the Summary Page.
-
Includes a Back Button to return to the Summary Page.
This page ensures that every KPI is clearly defined, reducing confusion and standardizing performance measurement.
Data Input for the Dashboard
The dashboard is powered by an Excel file with three worksheets:
-
Input_Actual
-
Fields: KPI Name, Month (first date of the month), MTD Numbers, YTD Numbers.
-
Captures the actual business performance data.
-
-
Input_Target
-
Fields: KPI Name, Month, Target MTD Numbers, Target YTD Numbers.
-
Stores planned targets for each KPI.
-
-
KPI Definition
-
Fields: KPI Number, KPI Group, KPI Name, Unit, Formula, Definition, Type (UTB/LTB).
-
Ensures consistency in KPI measurement.
-
By updating these sheets regularly, your dashboard will always reflect the latest performance metrics.
Why Use a Car Rental KPI Dashboard in Power BI?
Power BI transforms raw car rental data into actionable insights. With this dashboard, you can:
-
Improve operational efficiency by identifying underutilized cars.
-
Enhance customer service by tracking satisfaction metrics.
-
Boost profitability by analyzing cost vs. revenue KPIs.
-
Make faster decisions with real-time performance data.
This dashboard eliminates manual reporting errors and ensures that decision-making is based on facts, not assumptions.
Key KPIs to Track in a Car Rental Dashboard
A well-designed car rental KPI dashboard tracks a variety of metrics. Here are some essential ones:
-
Fleet Utilization Rate – % of vehicles currently rented out.
-
Average Rental Duration – Average number of days customers keep vehicles.
-
Revenue per Vehicle – Total revenue generated per car.
-
Customer Satisfaction Score (CSAT) – Feedback-based metric.
-
On-Time Vehicle Return Rate – % of vehicles returned on or before the due date.
-
Accident/Breakdown Rate – Number of incidents per 100 rentals.
-
Maintenance Cost per Vehicle – Average cost of servicing vehicles.
-
Target vs. Actual Revenue – Financial performance against planned goals.
These KPIs cover operations, finance, and customer experience, providing a 360° view of your car rental business.
Advantages of Car Rental KPI Dashboard in Power BI
🚗 Centralized Insights – All key performance metrics in one place.
📊 Real-Time Tracking – Instant access to updated data.
🔍 Data Accuracy – Eliminates human error from manual reporting.
⏱️ Time-Saving – No more preparing multiple spreadsheets.
📈 Better Decision-Making – Quick identification of weak areas.
🛠️ Customization – Flexible structure to add or modify KPIs.
🌎 Scalability – Suitable for both small rental agencies and large fleets.
Best Practices for Using Car Rental KPI Dashboard in Power BI
To get the most out of this dashboard, follow these best practices:
-
Keep KPIs Relevant
-
Track only the most important metrics that directly impact your business goals.
-
-
Update Data Regularly
-
Ensure Actual and Target Excel sheets are updated weekly or monthly.
-
-
Use Slicers Effectively
-
Leverage slicers to filter KPIs by time period, branch, or category.
-
-
Validate KPI Definitions
-
Clearly define KPI formulas to avoid confusion across departments.
-
-
Involve Teams in Analysis
-
Share dashboard insights with operations, finance, and customer service teams.
-
-
Leverage Drill-Throughs
-
Use the KPI Definition page to investigate performance deeper when needed.
-
-
Automate Data Refresh
-
Connect Power BI to a live data source for automatic updates.
-
Opportunities for Improvement in Car Rental KPI Dashboards
-
Predictive Analytics – Integrate AI models to forecast rental demand.
-
Mobile-Friendly Dashboards – Ensure dashboards are optimized for smartphones.
-
Customer Segmentation Analysis – Track performance by customer type.
-
Integration with CRM – Connect with customer databases for deeper insights.
-
Dynamic Pricing Analysis – Measure how pricing strategies impact revenue.
Conclusion
A Car Rental KPI Dashboard in Power BI is more than just a reporting tool—it is a strategic decision-making system. By combining operational, financial, and customer KPIs in one interactive platform, rental companies can enhance fleet utilization, reduce costs, and improve customer satisfaction.
With the right setup and best practices, this dashboard can transform the way you manage your car rental business. Whether you run a small rental agency or a large-scale operation, this solution ensures that you make data-driven decisions every single time.
Frequently Asked Questions (FAQs)
1. What is a KPI in car rental business?
A KPI (Key Performance Indicator) is a measurable value that shows how effectively your car rental business is achieving goals. Examples include fleet utilization rate, customer satisfaction, and revenue per vehicle.
2. Why should I use Power BI for car rental KPIs?
Power BI allows you to track, visualize, and analyze KPIs in real time. It saves time, improves accuracy, and helps you make faster decisions compared to manual reporting.
3. How often should I update the dashboard data?
You should update Actual and Target data at least once a month. For high-volume rental businesses, weekly updates are recommended.
4. Can I add new KPIs to the dashboard?
Yes, the dashboard is fully customizable. You can add new KPIs by updating the KPI Definition sheet in Excel.
5. Is the Car Rental KPI Dashboard suitable for small businesses?
Absolutely. Even small car rental companies benefit from KPI dashboards by gaining visibility into fleet utilization, costs, and customer satisfaction.
Visit our YouTube channel to learn step-by-step video tutorials