The global career coaching market is projected to reach $20 billion by 2026, with digital mentorship platforms growing at over 18% annually. Yet most platform operators and HR teams still lack a structured way to track session performance, mentor earnings, and mentee outcomes in one place. The Career Mentorship Platforms Dashboard in Excel solves this gap directly — it tracks 5 KPIs across 5 interactive analytical pages with 16 pre-built pivot charts, auto-refreshing the moment you update your data.
Whether you run a career coaching startup with multiple platforms or manage an internal corporate mentoring program, this Career Mentorship Platforms Dashboard in Excel gives you a complete, customizable reporting solution — no SaaS subscription, no per-user fees, no onboarding calls. Just download, enter your data, and explore insights within minutes.
Click here to Purchase Career Mentorship Platforms Dashboard in Excel
Key Features of Career Mentorship Platforms Dashboard in Excel
The Career Mentorship Platforms Dashboard in Excel includes 7 sheets, 5 analytical pages, 16 pivot-driven charts, and 5 KPI cards — all connected to a single Data Sheet that powers everything automatically through Excel’s native Refresh All function.
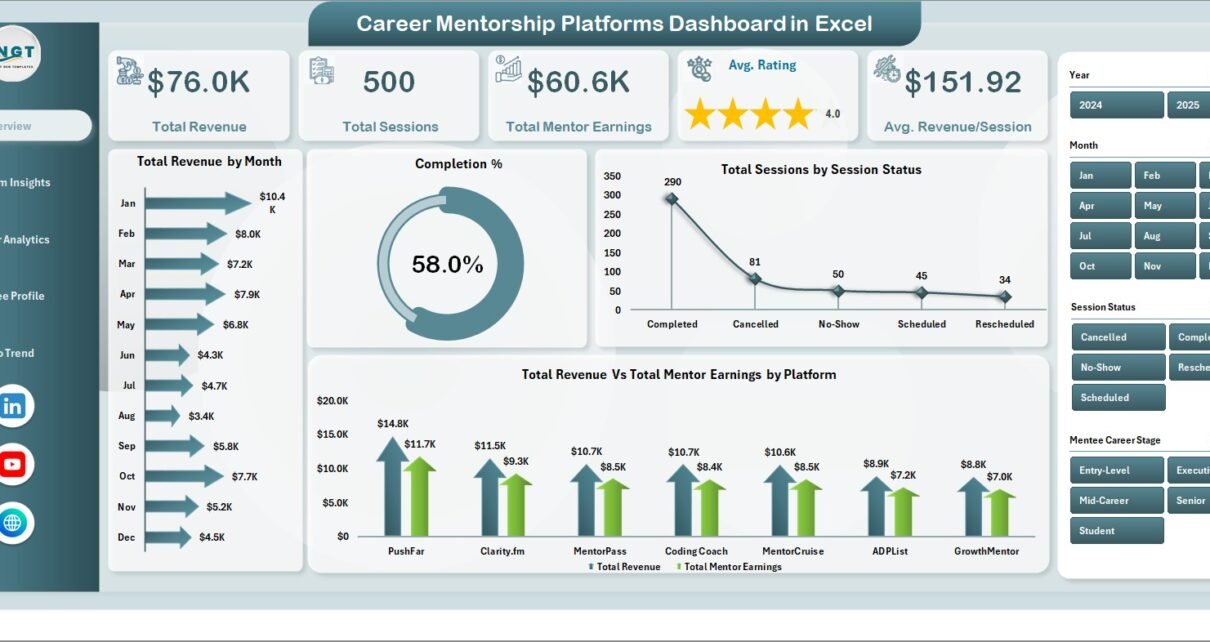
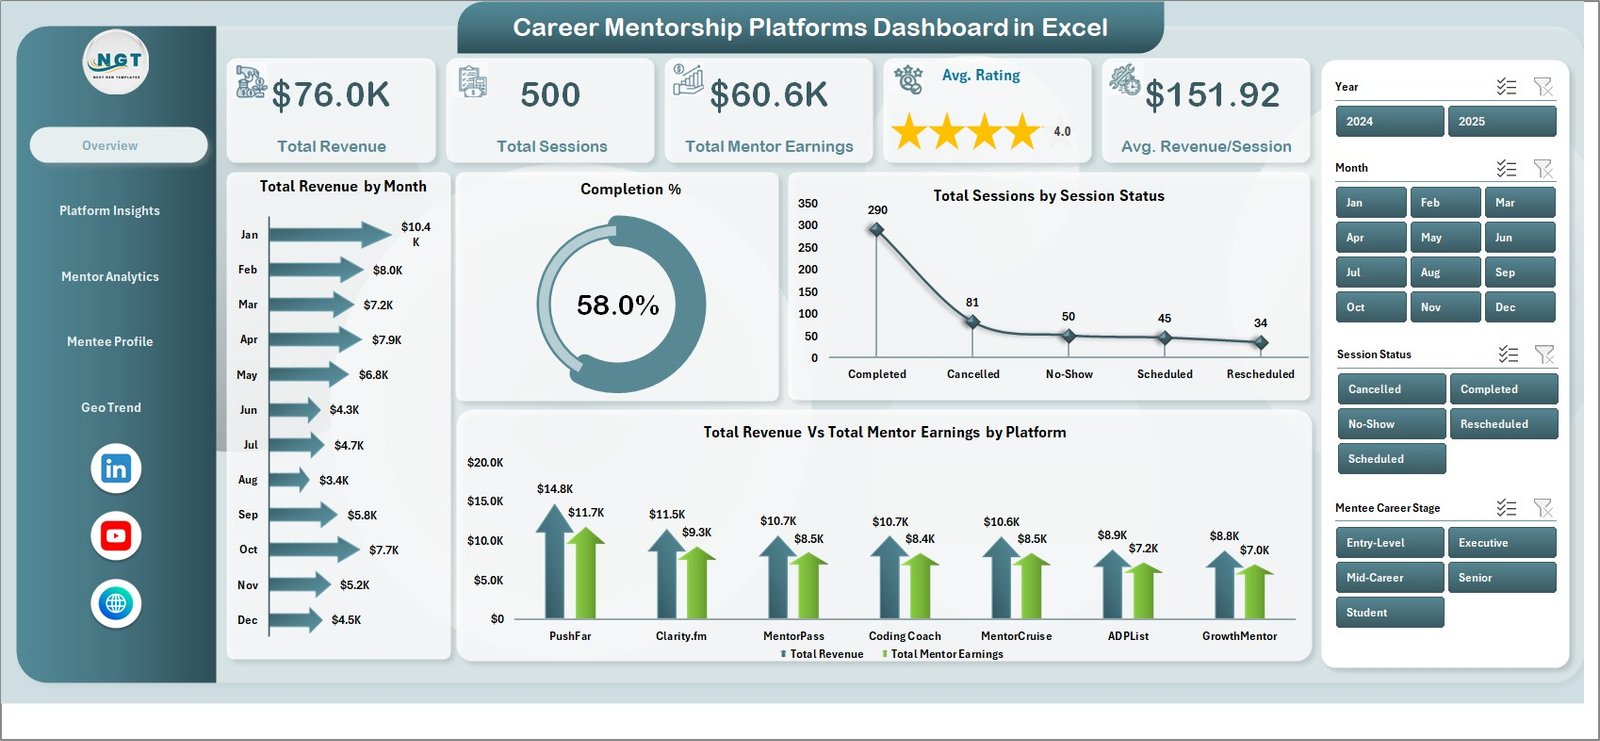
5 KPI Cards on the Overview Page — The dashboard tracks Total Revenue, Total Sessions, Total Mentor Earnings, Average Rating, and Average Revenue per Session at the top level. These numbers update automatically every time you refresh the pivot tables, giving you a real-time snapshot of platform health.
16 Pre-Built Pivot Charts — Spread across 5 analytical pages, these charts cover Total Revenue by Month, Completion %, Sessions by Status, Revenue vs. Mentor Earnings by Platform, Cancellation % by Platform, Avg. Rating by Session Type, Mentor Earnings by Level, and geographic breakdowns by Region. No manual chart-building required.
Pivot-Driven Auto-Refresh Architecture — All dashboard visuals are powered by pivot tables on a dedicated Support Sheet. After updating the Data Sheet, simply use Data → Refresh All in the Excel Ribbon. Every chart and KPI card updates instantly — this is a more reliable approach than SUMPRODUCT or QUERY-based dashboards that break when data structure changes.
Multi-Dimensional Slicers — Apply interactive filters by Platform, Session Type, Subscription Plan, Mentor Level, Region, and more. Slicers drive all the charts on each page simultaneously, letting you drill into any segment without touching formulas.
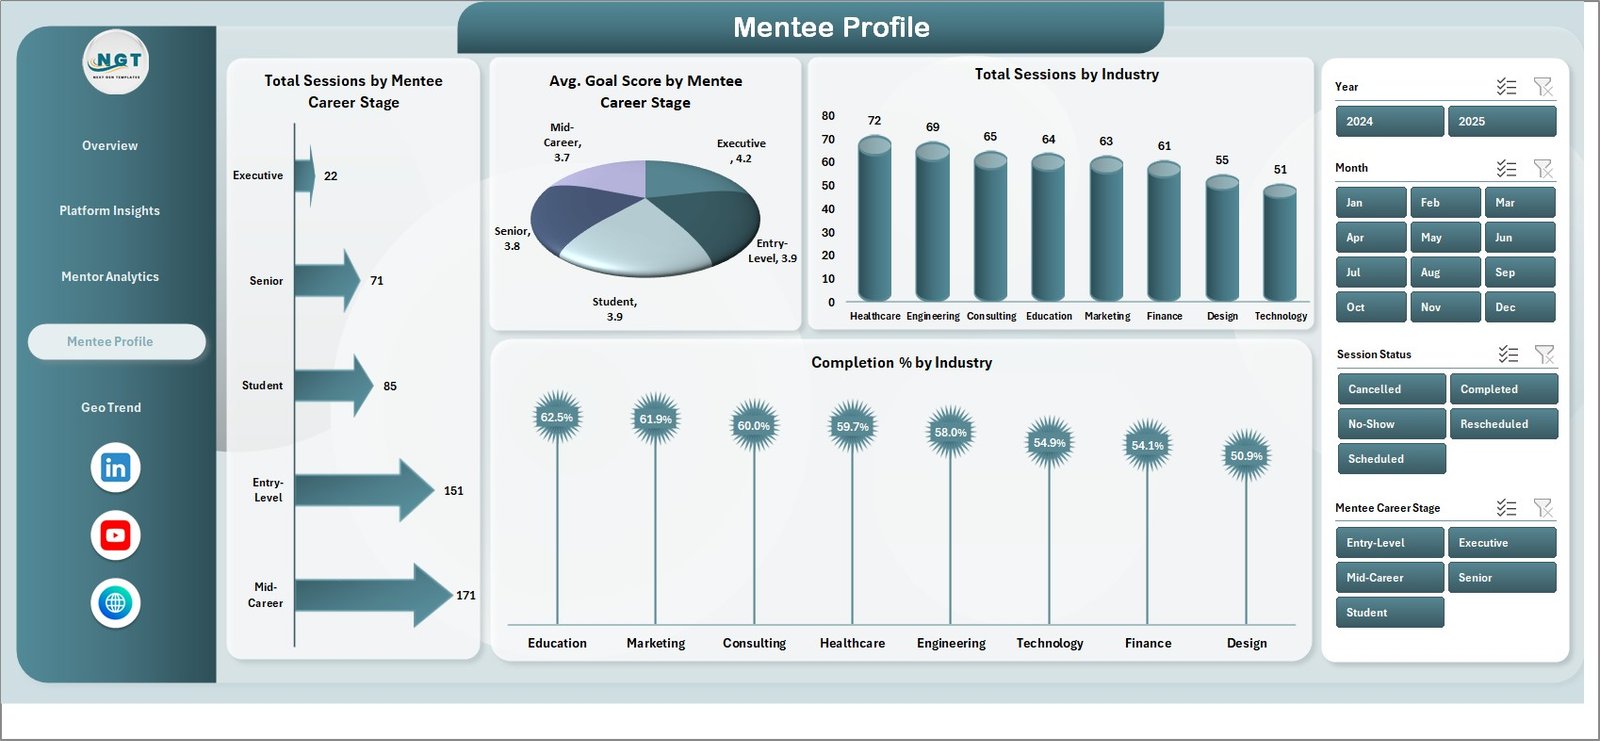
Career-Stage and Industry Segmentation — The Mentee Profile page analyzes sessions and goal scores by Mentee Career Stage and Industry, giving platform operators data to identify underserved segments and optimize their offerings.
Zero Add-in Dependency — Built entirely on native Excel pivot tables, charts, and slicers. Works in Excel 2016, 2019, 2021, and Microsoft 365. No Power Query, no macros, no third-party tools required.
Dashboard Pages Explanation
Page 1: Overview Page
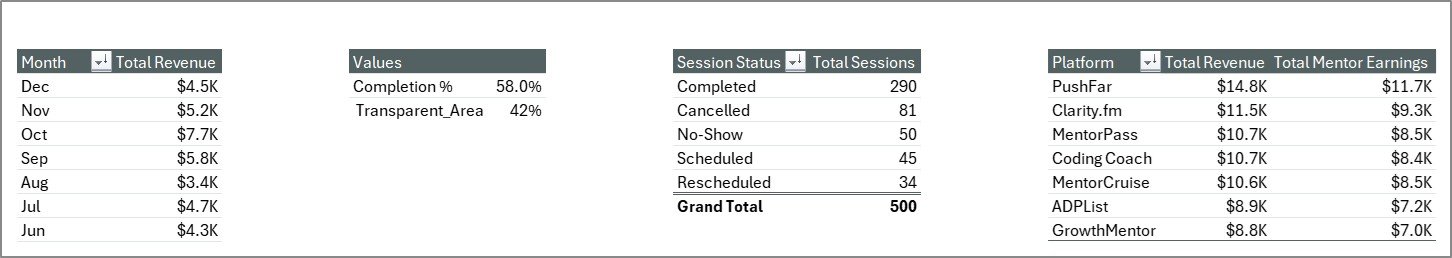
The Overview Page provides a high-level summary of platform performance through 5 KPI cards — Total Revenue, Total Sessions, Total Mentor Earnings, Avg. Rating, and Avg. Revenue/Session — and 4 charts: Total Revenue by Month, Completion %, Total Sessions by Session Status, and Total Revenue vs. Total Mentor Earnings by Platform. Interactive slicers across the page let you filter the entire view instantly.
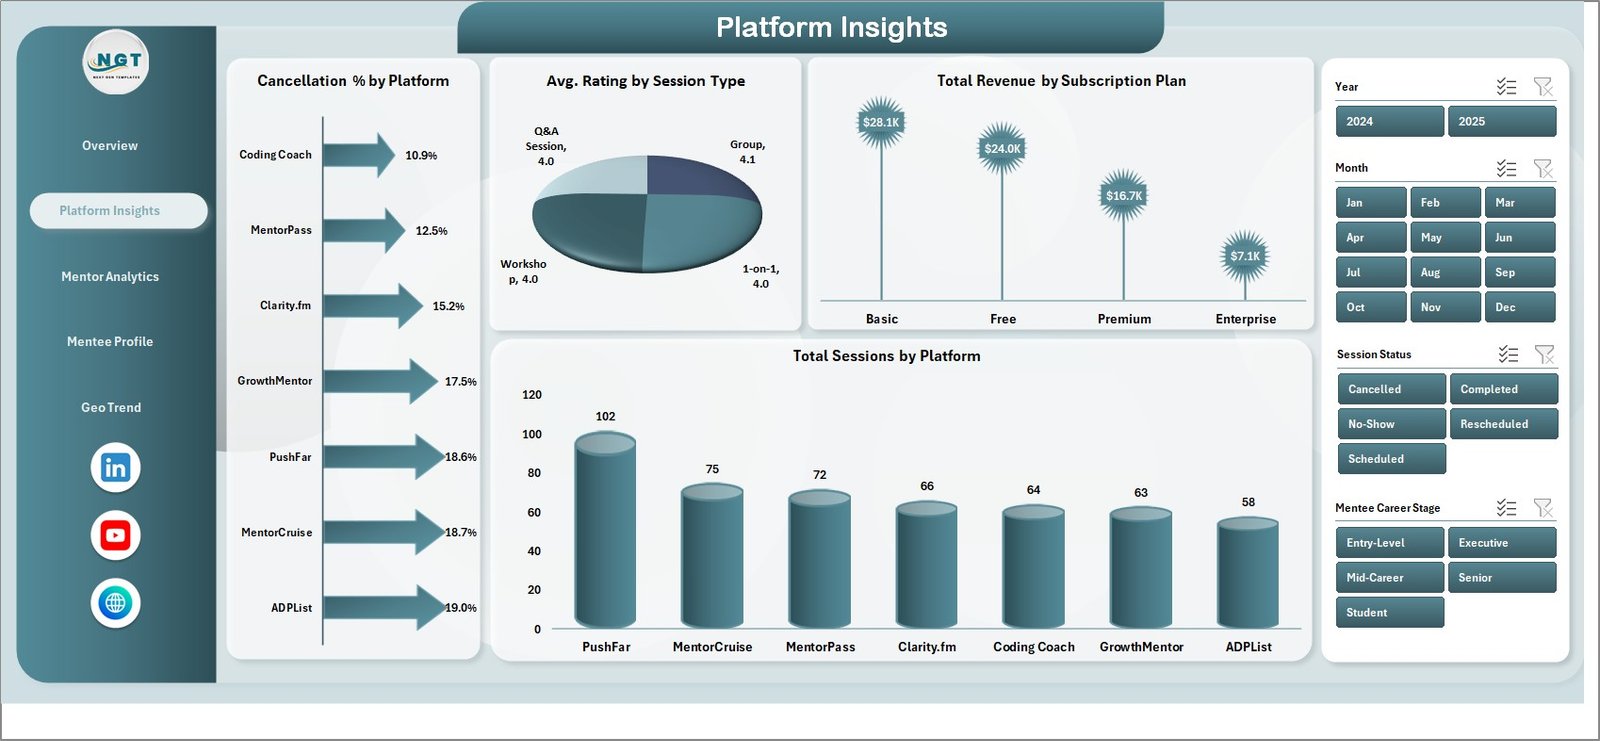
Page 2: Platform Insights
The Platform Insights page compares performance across your mentorship platforms using 4 charts: Cancellation % by Platform, Avg. Rating by Session Type, Total Revenue by Subscription Plan, and Total Sessions by Platform. Use this page to identify which platforms have the highest cancellation rates or lowest session ratings and take corrective action.
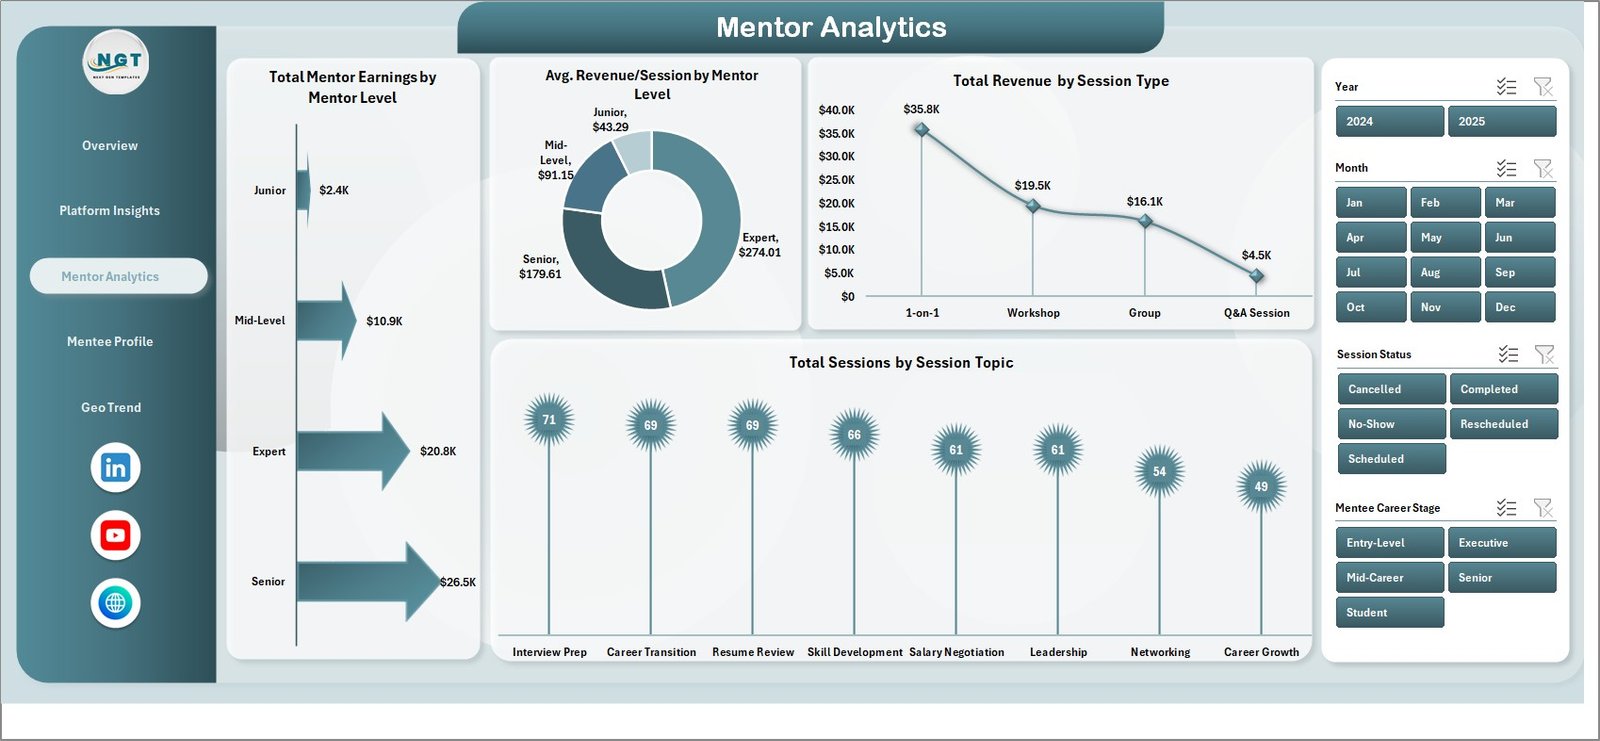
Page 3: Mentor Analytics
The Mentor Analytics page breaks down mentor-side revenue and performance through 4 charts: Total Mentor Earnings by Mentor Level, Avg. Revenue/Session by Mentor Level, Total Revenue by Session Type, and Total Sessions by Session Topic. This helps operations teams identify which mentor tiers and session formats generate the highest returns.
Page 4: Mentee Profile
The Mentee Profile page analyzes the demand side of the platform through 4 charts: Total Sessions by Mentee Career Stage, Avg. Goal Score by Mentee Career Stage, Total Sessions by Industry, and Completion % by Industry. This is the right page for understanding which career stages and industry segments drive the most engagement.
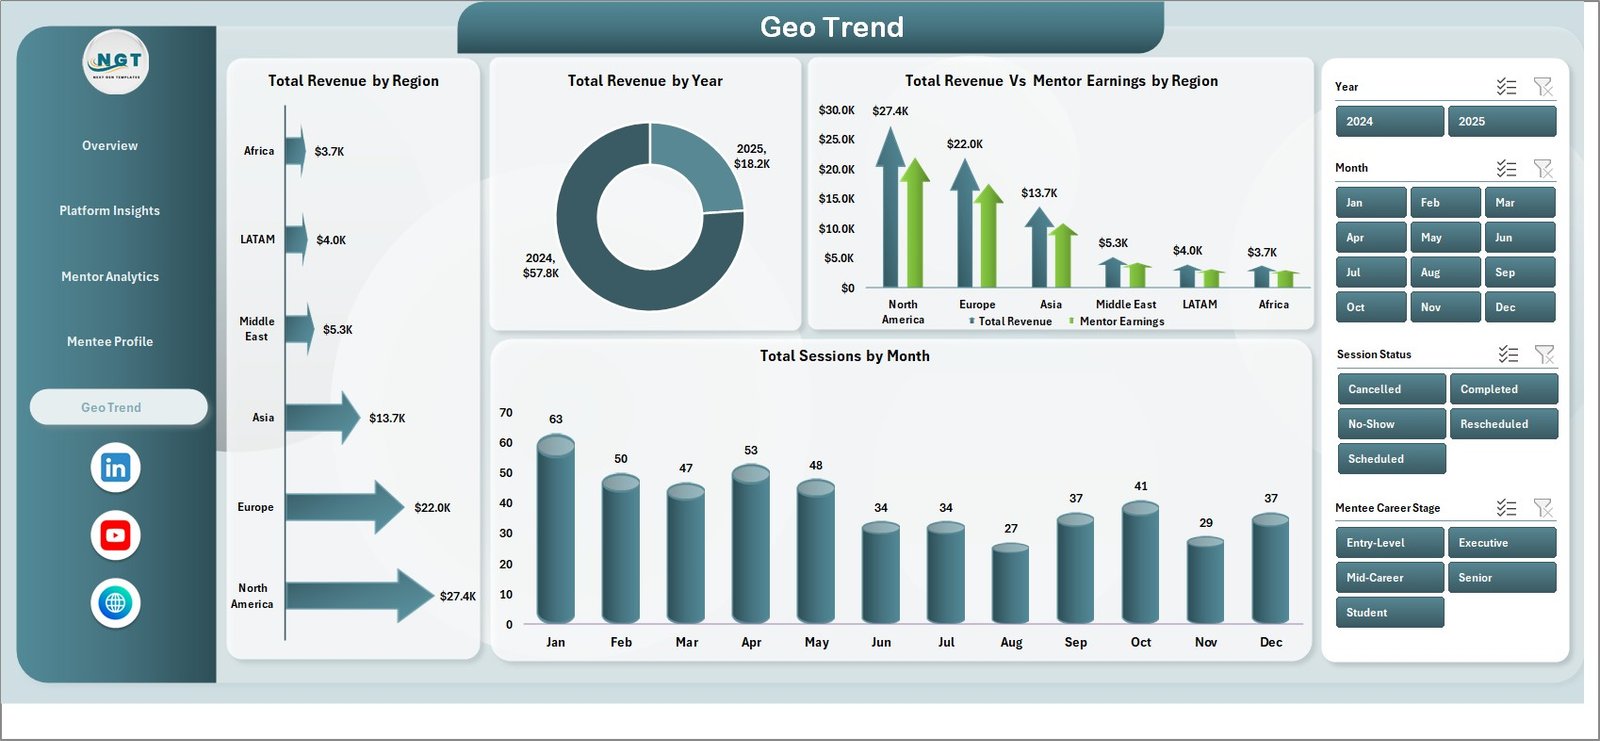
Page 5: Geo Trend
The Geo Trend page tracks geographic and time-based patterns using 4 charts: Total Revenue by Region, Total Revenue by Year, Total Revenue vs. Mentor Earnings by Region, and Total Sessions by Month. Use this page to map seasonal session demand, compare regional revenue contributions, and present growth trends to leadership.
Data Sheet
The Data Sheet is where you enter all session records in a structured column format. Each row represents one mentorship session and feeds the pivot tables on the Support Sheet, which in turn updates all 5 dashboard pages automatically.

Support Sheet
The Support Sheet contains all the pivot tables that power every chart and KPI card in the dashboard. After adding new rows to the Data Sheet, go to Data → Refresh All to update everything at once. This sheet can be kept hidden during day-to-day use.
Career Mentorship Platforms Dashboard in Excel vs. Google Sheets Dashboard vs. MentorcliQ / Together Platform — Feature Comparison
| Feature | Career Mentorship Platforms Dashboard in Excel | Google Sheets Dashboard | MentorcliQ / Together Platform |
|---|---|---|---|
| Cost | $17.99 one-time | Free (limited) | $10–25 / user / month |
| Platform | Microsoft Excel | Google Sheets (browser) | SaaS (web-based) |
| Setup Time | Under 10 minutes | 15–20 minutes | Days (onboarding required) |
| Real-time Collaboration | Via SharePoint/OneDrive | ✅ Native | ✅ Native |
| Works Offline | ✅ Fully offline | ❌ Requires internet | ❌ Requires internet |
| Customizable KPIs | ✅ Fully editable | ✅ Editable | ❌ Fixed platform metrics |
| Data Privacy | ✅ Data stays local | Stored on Google servers | Stored on vendor servers |
| Year-1 Cost (5 users) | $17.99 total | $0 | $600–1,500+ |
| Pivot Auto-Refresh | ✅ Data → Refresh All | Manual formula update | Automatic (SaaS) |
For mentorship platform operators who want detailed multi-dimensional analytics without a monthly SaaS subscription, the Career Mentorship Platforms Dashboard in Excel sits in the sweet spot.
Who Should Use This Template
✅ Perfect for:
- Career coaching platform operators tracking sessions, revenue, and mentor performance
- HR and L&D teams managing internal corporate mentoring programs
- EdTech startups and coaching businesses with multiple subscription tiers
- Data analysts and operations managers who need Excel-native analytics
- Freelance career coaches tracking their own revenue, ratings, and client progress
❌ Not a fit if:
- You need real-time API integrations or automated data pipelines
- You require built-in scheduling or video features (this is a reporting dashboard only)
- You need SOC 2-compliant SaaS with SSO and enterprise role-based access controls
Real-World Use Cases
Priya runs operations for a career coaching startup with 3 mentorship platforms. She uses the Career Mentorship Platforms Dashboard in Excel to compare which platform generates the highest revenue per session, which subscription plan has the lowest cancellation rate, and which mentor level drives the most completions — all without paying $500/month for a dedicated BI tool. The Geo Trend page helps her justify regional expansion in quarterly board presentations.
Marcus heads an L&D team at a 200-person tech company. He uses the Mentee Profile page every quarter to track which career stages are underrepresented in the internal mentoring program, and uses the Platform Insights page to compare session completion rates across different mentoring formats. Microsoft Learn’s guidance on Excel compatibility helped his team confirm the dashboard works across all office machines.
Ananya is a freelance career mentor managing 50+ active clients. She inputs session records monthly and uses the Mentor Analytics page to identify which session types (career planning vs. interview prep vs. skills coaching) generate the most revenue per hour — helping her focus her calendar on the highest-value offerings.
Advantages of Career Mentorship Platforms Dashboard in Excel
The Career Mentorship Platforms Dashboard in Excel eliminates the need for expensive SaaS subscriptions by delivering professional-grade analytics in a familiar, offline-capable environment. Teams that switch from manual spreadsheet reporting save an estimated 3–5 hours per month on data consolidation and chart updates. The pivot-driven architecture means no formula maintenance — just add rows and refresh.
The multi-page structure separates Platform, Mentor, Mentee, and Geographic analytics into dedicated views, so different stakeholders (operations, HR, executive) can focus on the data that matters to them without navigating a cluttered single-page report. The comparison table functionality makes it easy to generate monthly reporting decks directly from the dashboard.
Because all data stays in your own Excel file — on your machine or shared drive — there are no data privacy concerns about uploading session records to third-party SaaS servers. For coaching businesses handling client PII or companies under GDPR, this is a meaningful advantage over cloud-based platforms.
Opportunities for Improvement
The Career Mentorship Platforms Dashboard in Excel is designed for structured, batch-updated reporting rather than real-time streaming analytics. If your platform generates thousands of sessions daily and you need live dashboards, a Power BI or custom SaaS solution would serve better. Similarly, the template does not include built-in session scheduling, mentor matching, or communication features — it is purely an analytics and reporting tool.
The dashboard works best when your data follows the column structure provided in the Data Sheet. Users who need to add significantly different dimensions (e.g., multi-currency revenue, complex taxonomy hierarchies) will need to extend the pivot table structure on the Support Sheet manually, which requires intermediate Excel knowledge.
Best Practices
- Refresh after every data update — Use Data → Refresh All immediately after pasting new session rows. This ensures all 16 charts and 5 KPI cards reflect the latest data.
- Keep the column structure intact — Do not rename or reorder columns in the Data Sheet. The pivot tables reference specific field names; changing them will break the refresh.
- Archive older data periodically — For large datasets (10,000+ rows), archive records older than 12 months to a separate sheet to maintain dashboard performance.
- Use the Support Sheet for customization — To add new chart dimensions or KPIs, extend the pivot tables on the Support Sheet rather than editing the dashboard pages directly.
- Lock the Support Sheet when sharing — If you share the file with non-technical team members, protect the Support Sheet to prevent accidental pivot edits.
Explore Relevant Templates
If you found the Career Mentorship Platforms Dashboard in Excel useful, here are related templates available on NextGenTemplates:
- Alumni Engagement KPI Dashboard in Excel — Track event participation, donations, and volunteer engagement for educational institutions
- Event Management Dashboard in Excel — Monitor budgets, venue performance, satisfaction, and ROI across events
- Colleges & Universities Dashboard in Power BI — Full institutional analytics including faculty, department, and financial tracking
Also explore the full library of Excel Dashboard Templates and Power BI Dashboards on NextGenTemplates.
Frequently Asked Questions
What KPIs does the Career Mentorship Platforms Dashboard in Excel track?
The Career Mentorship Platforms Dashboard in Excel tracks 5 top-level KPIs: Total Revenue, Total Sessions, Total Mentor Earnings, Average Rating, and Average Revenue per Session. These feed into 16 charts across 5 pages covering platform, mentor, mentee, and geographic analytics.
Does this dashboard require any Excel add-ins or macros?
No. The Career Mentorship Platforms Dashboard in Excel is built entirely on native Excel pivot tables, charts, and slicers. It requires no macros, no Power Query, and no add-ins. It works in Excel 2016, 2019, 2021, and Microsoft 365.
How do I update the dashboard with new session data?
Add new session records to the Data Sheet in the same column format, then use Data → Refresh All in the Excel Ribbon. All 16 charts and 5 KPI cards update automatically within seconds — no manual formula editing required.
How does this compare to MentorcliQ or Together Platform?
MentorcliQ and Together Platform are SaaS tools at $10–25 per user per month with fixed dashboards and onboarding requirements. The Career Mentorship Platforms Dashboard in Excel is a $17.99 one-time purchase with fully customizable KPIs, full offline capability, and no recurring costs.
Can I track multiple mentorship platforms in the same file?
Yes. The dashboard includes a Platform dimension across all pages and slicers. You can filter by individual platforms or view all together, making it well-suited for operators managing 2–5 platforms simultaneously.
Is this suitable for freelance career coaches or only platforms?
Both. Freelance coaches tracking their own sessions, revenue, and client outcomes will find the Mentor Analytics and Mentee Profile pages particularly useful. Platform operators benefit from the Platform Insights and Geo Trend pages.
What is the recommended Excel version?
Microsoft Excel 2016 or later. The pivot table and slicer functionality is fully supported in Excel 2016, 2019, 2021, and Microsoft 365. Google Sheets does not fully support these pivot slicer interactions.
About the Author
Built by PK — Microsoft Certified Professional with 15+ years of Excel, Google Sheets, and Power BI experience. Founder of NextGenTemplates, reaching 300K+ subscribers across YouTube channels (@PK-AnExcelExpert, @NextGenTemplates, @NeoTechNavigators). Every template is hand-built and tested before release.
Conclusion
The Career Mentorship Platforms Dashboard in Excel delivers a complete, multi-page analytics solution for coaching platform operators, HR teams, and freelance mentors — without the cost or complexity of dedicated SaaS tools. With 5 KPI cards, 16 pivot-driven charts, interactive slicers, and a simple data-entry structure, it replaces hours of manual reporting with a single Refresh All click.
Click here to Purchase Career Mentorship Platforms Dashboard in Excel
✅ Instant download · One-time payment · No subscription
📅 Last updated: May 2026
Visit our YouTube channel for step-by-step video tutorials.