The cement industry plays a major role in infrastructure and economic development. Because of this, cement companies need accurate insights to improve productivity, reduce costs, and boost operational efficiency. However, many organizations still depend on scattered spreadsheets, manual updates, and outdated reporting methods. As a result, leaders cannot see real-time KPIs or take quick action when performance drops.
A Cement Industry KPI Dashboard in Excel solves this problem. It brings all KPIs together in one place and presents them in a simple, visual, and interactive format. Since Excel is easy to use and widely available, this dashboard becomes a practical and effective solution for plant managers, production teams, and business leaders.
In this article, you will learn everything about the Cement Industry KPI Dashboard in Excel—its structure, features, advantages, best practices, and how it helps cement companies make faster and smarter decisions.
Click to Purchases Cement Industry KPI Dashboard in Excel
What Is a Cement Industry KPI Dashboard in Excel?
A Cement Industry KPI Dashboard in Excel is a ready-to-use performance monitoring system that helps cement companies track important KPIs across production, quality, safety, maintenance, supply chain, and sales. Because the dashboard uses interactive Excel features like slicers, formulas, charts, and conditional formatting, users can view monthly and yearly trends with just one click.
Additionally, the dashboard allows managers to compare Actual vs Target and Actual vs Previous Year values. This comparison makes it easy to evaluate improvements, uncover gaps, and plan corrective actions before major issues arise.
Why Do Businesses Need a Cement Industry KPI Dashboard?
The cement manufacturing process is complex. It involves mining, grinding, kiln operations, clinker production, packaging, distribution, and more. Since each stage affects the final output, businesses need accurate data visibility. The dashboard solves this challenge because it:
-
Combines all performance data into one file
-
Removes manual calculations
-
Shows real-time progress
-
Highlights deviations instantly
-
Supports quick decision-making
When leaders see everything clearly, they can react faster and improve efficiency at every stage.
Click to Purchases Cement Industry KPI Dashboard in Excel
Key Features of the Cement Industry KPI Dashboard in Excel
This dashboard includes 7 powerful worksheets, each designed to give clarity, structure, and detailed insights. You can move across sheets using the Home Page buttons and view KPIs easily for any month.
1. Home Sheet – Your Quick Navigation Page
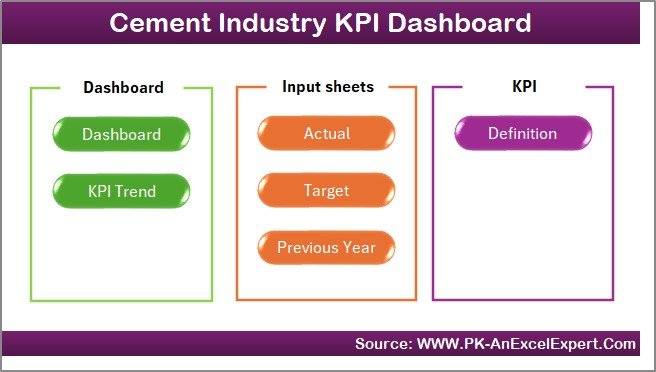
The Home sheet acts as the index page for the dashboard. Since it contains six navigation buttons, users can instantly jump to the Dashboard, KPI Trend, Input sheets, and other pages. In busy environments, this saves time and helps team members work faster without searching for tabs manually.
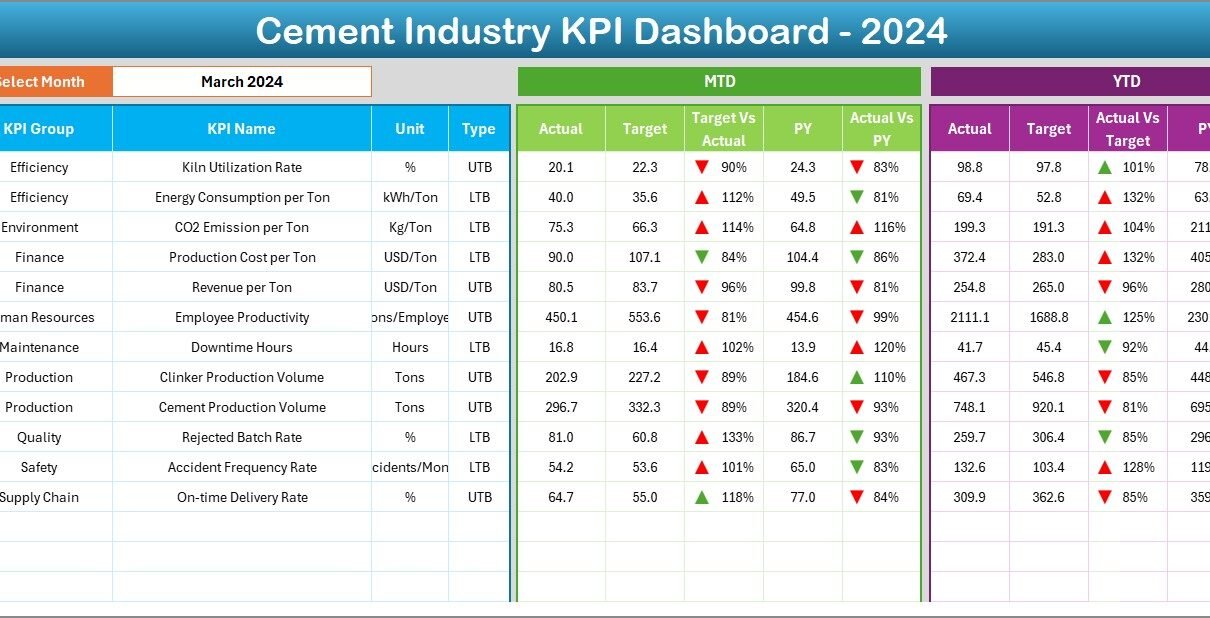
2. Dashboard Sheet – The Main Performance Monitoring Page
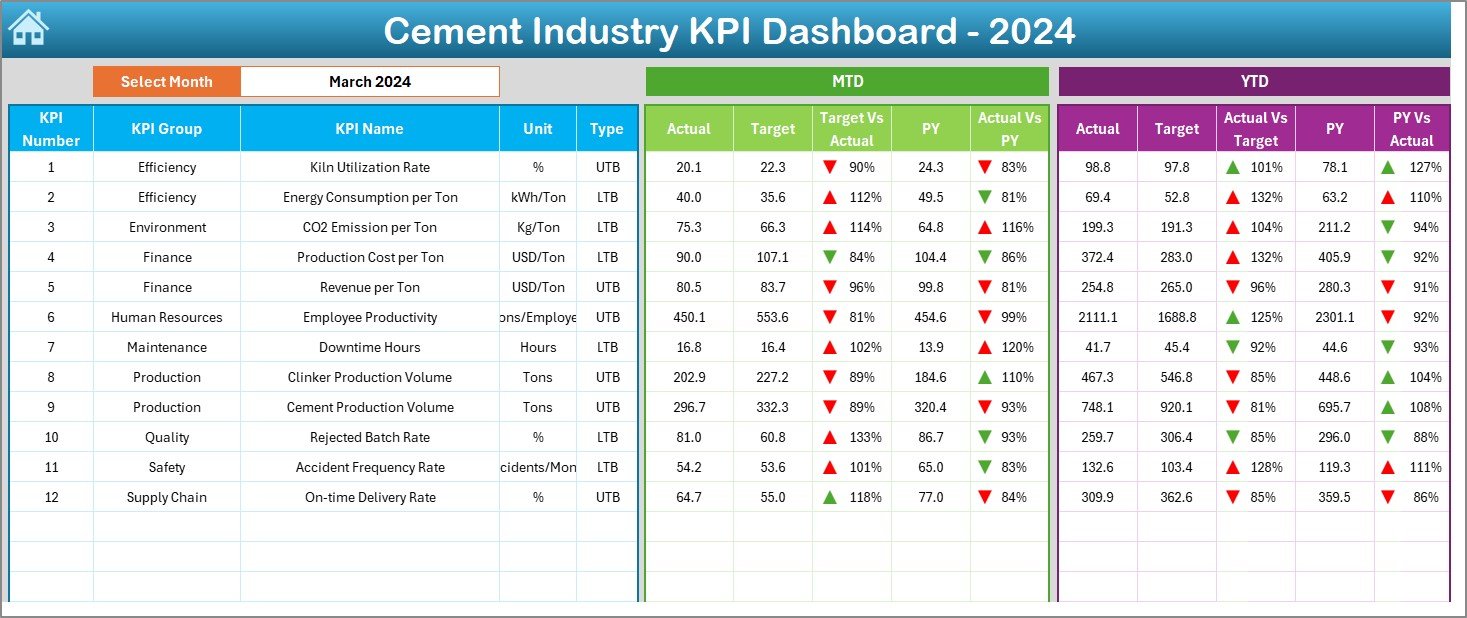
The Dashboard sheet is the heart of the Cement Industry KPI Dashboard. It displays all KPI results in a clean and visual layout.
Key Highlights of the Dashboard Sheet
-
On cell D3, users can choose the month from a drop-down list
-
The entire dashboard updates automatically
-
Clear display of MTD (Month-to-Date) and YTD (Year-to-Date) values
-
Comparison of:
-
Actual vs Target
-
Actual vs Previous Year
-
-
Visual arrows show whether the KPI is trending up or down
-
Simplified color-coded indicators help managers focus on critical KPIs first
Because everything changes dynamically, decision-makers always see the latest performance snapshot in a single view.
Click to Purchases Cement Industry KPI Dashboard in Excel
3. KPI Trend Sheet – Detailed KPI-Wise Analysis
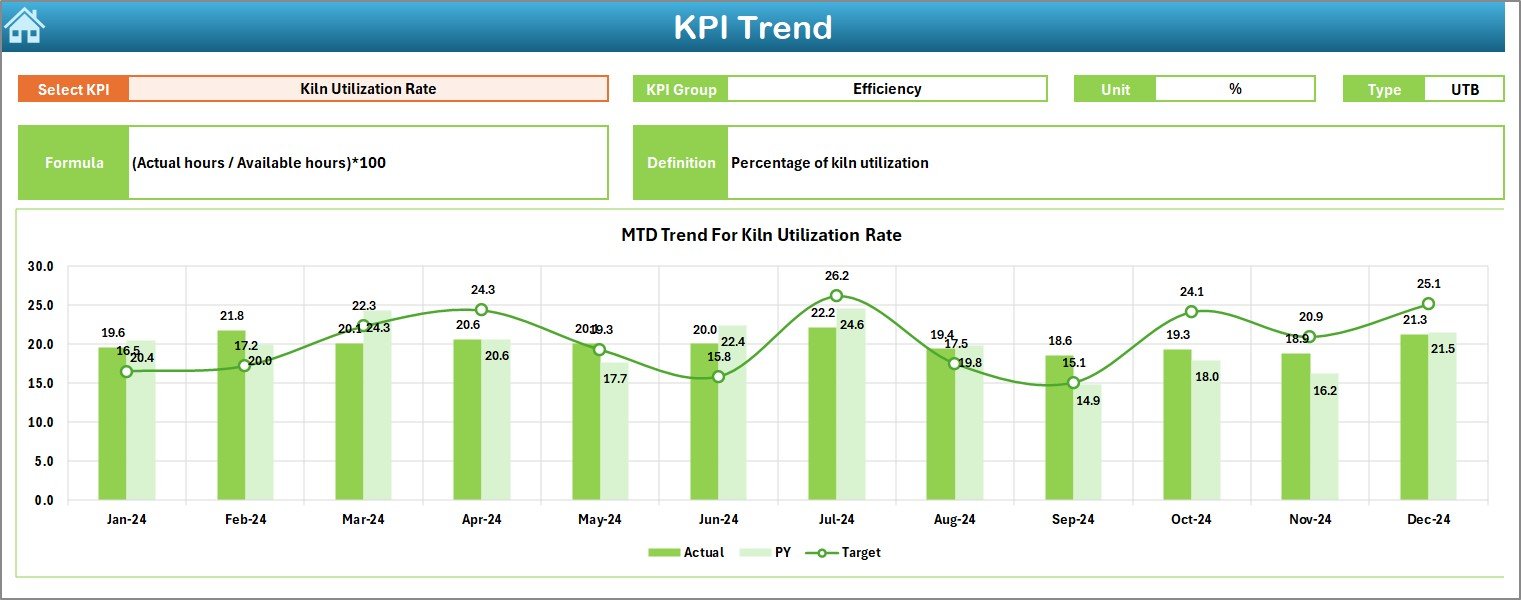
The KPI Trend sheet offers deeper analysis for each KPI. It is especially useful when you want to study monthly progress.
Features of the KPI Trend Sheet
-
Select KPI name from a drop-down in cell C3
-
Displays:
-
KPI Group
-
Unit of measurement
-
KPI Type (Upper the Better or Lower the Better)
-
Formula used
-
KPI Definition
-
-
Shows trend charts for:
-
MTD Actual, Target, and Previous Year
-
YTD Actual, Target, and Previous Year
-
This sheet allows managers to understand patterns, detect early warnings, and plan corrective actions quickly.
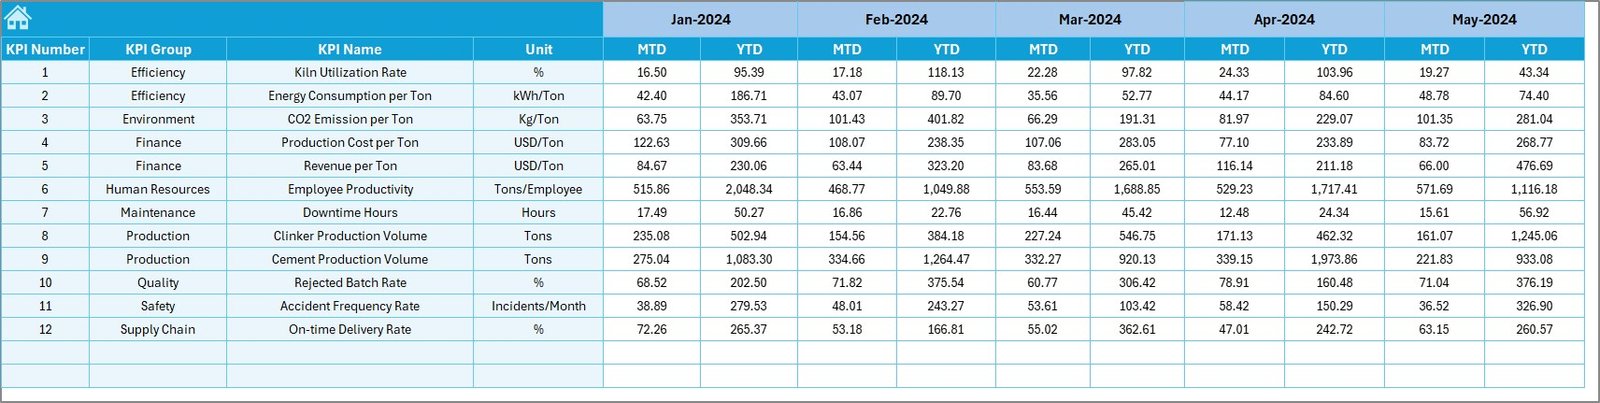
4. Actual Numbers Input Sheet – Enter Monthly Actual Values
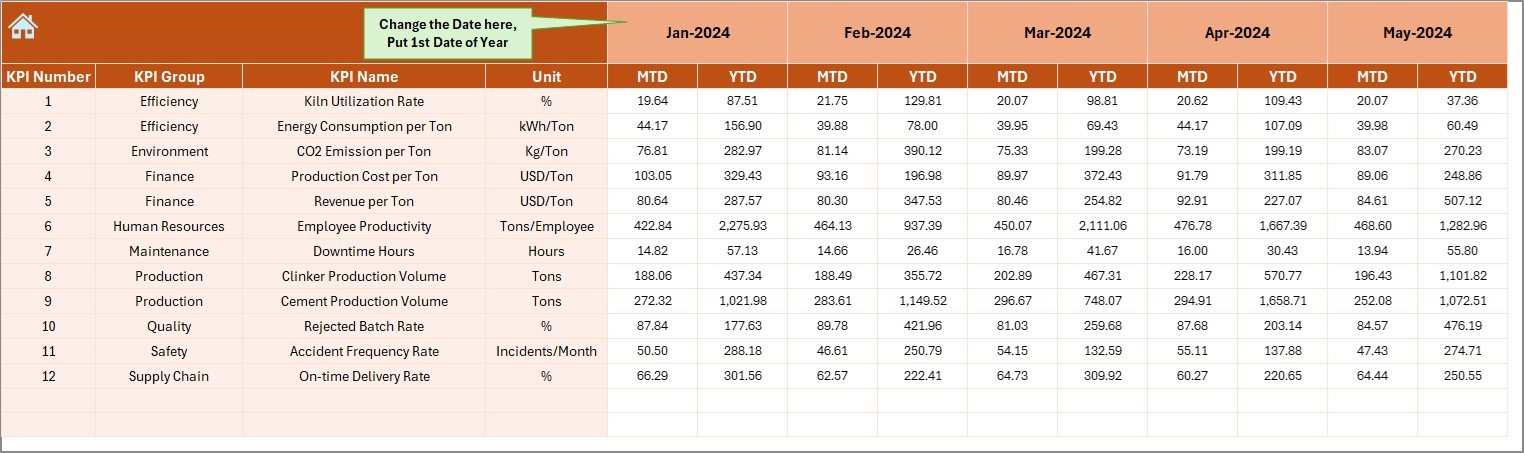
The Actual Numbers Input sheet is where you enter real performance numbers for each KPI.
-
You can change the month in cell E1
-
Enter both MTD and YTD values
-
Dashboard calculations update based on these numbers
Since the sheet is easy to use, team members can update it regularly without mistakes.
Click to Purchases Cement Industry KPI Dashboard in Excel
5. Target Sheet – Set Monthly and Yearly Targets
Every KPI requires clear monthly and yearly targets. The Target Sheet allows users to:
-
Enter monthly MTD Targets
-
Enter yearly YTD Targets
-
Update benchmarks quickly
When the dashboard compares Actual vs Target, it helps in performance improvement and strategy formulation.
6. Previous Year Numbers Sheet – Track Last Year’s Performance
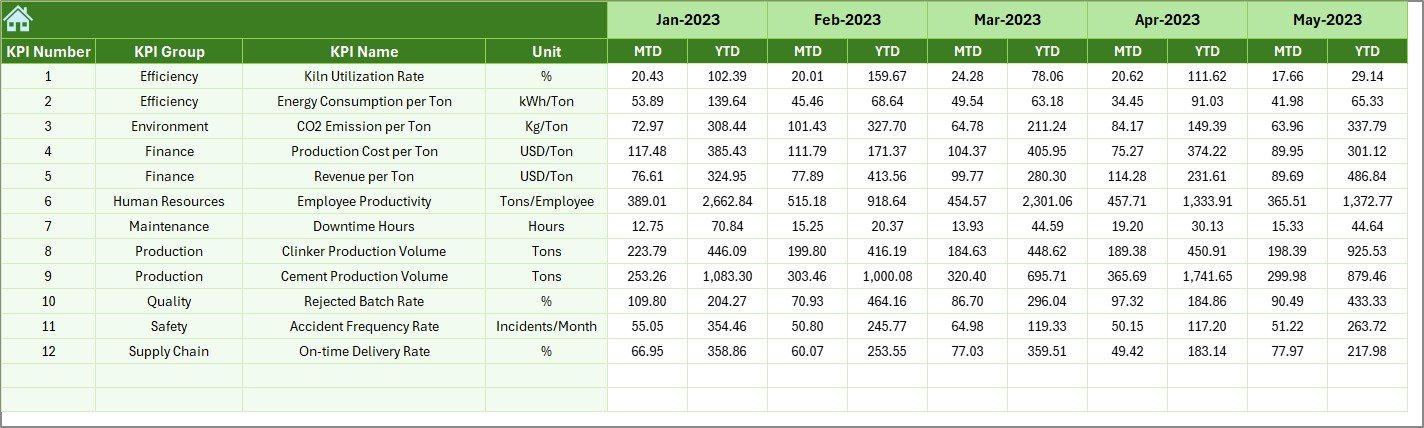
The Previous Year Numbers sheet stores the historical data for each KPI. You simply enter Previous Year MTD and YTD values in the same format as the current year.
This comparison helps organizations analyze:
-
Whether performance improved
-
Which processes need enhancement
-
How the company is performing against historical trends
7. KPI Definition Sheet – Maintain a Clear KPI Dictionary
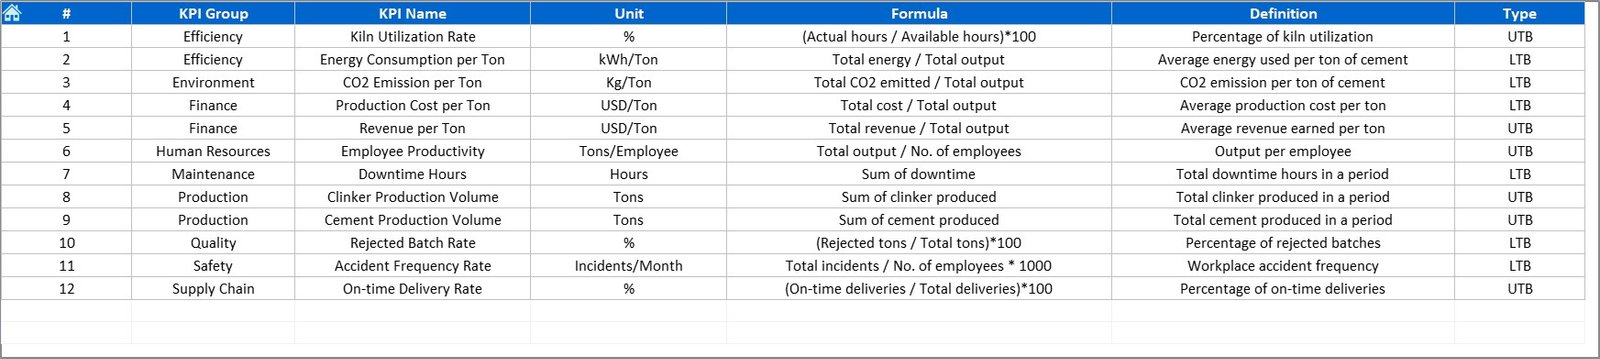
The KPI Definition sheet contains structured information about each KPI. It includes:
-
KPI Name
-
KPI Group
-
Unit
-
Formula
-
KPI Definition
This sheet ensures standardization, clarity, and consistency across teams. As new employees join or KPIs are updated, this sheet acts as a reliable reference.
Click to Purchases Cement Industry KPI Dashboard in Excel
Which KPIs Should Cement Companies Track?
A Cement Industry KPI Dashboard in Excel can track dozens of KPIs. Some of the most important categories include:
✔ Production KPIs
-
Clinker Production Volume
-
Cement Production Output
-
Kiln Running Hours
-
Fuel Consumption Rate
-
Energy Efficiency Index
✔ Quality KPIs
-
Product Strength
-
Fineness Index
-
Raw Mix Variance
-
Quality Compliance %
✔ Maintenance KPIs
-
Machine Downtime Hours
-
Preventive Maintenance Compliance %
-
Breakdown Frequency
-
Mean Time to Repair (MTTR)
✔ Safety KPIs
-
Lost Time Injury Frequency Rate (LTIFR)
-
Near Miss Reporting
-
Safety Training Completion
✔ Sales & Distribution KPIs
-
Dispatch Volume
-
Delivery On-Time %
-
Dealer Satisfaction Score
-
Revenue per Ton
Tracking these KPIs boosts operational clarity and ensures performance success.
How the Dashboard Helps Cement Companies Improve Performance
The Cement Industry KPI Dashboard supports better performance in many ways:
1. Real-Time Visibility
Users always see updated data for any selected month.
2. Faster Decision-Making
Comparison charts and arrows make trends easy to understand.
3. Better Alignment Between Teams
Everyone works with the same numbers and the same definitions.
4. Reduced Manual Work
Formulas and charts update automatically when data changes.
5. More Accurate Analysis
The dashboard eliminates calculation errors and provides reliable insights.
Since cement plants operate continuously, accurate data helps prevent downtime, reduce waste, and increase productivity.
Advantages of the Cement Industry KPI Dashboard in Excel
1. Easy and Familiar Platform
Excel is widely used, so teams quickly adopt the dashboard without training.
2. Complete Visibility
All KPIs—production, quality, maintenance, safety, and sales—come together in a single file.
3. Strong Decision Support
MTD vs Target, YTD vs Target, and PY comparison instantly highlight problem areas.
4. Cost-Effective
Organizations do not need expensive software. Excel provides a powerful and affordable solution.
5. Highly Customizable
Users can add KPIs, update formulas, change targets, or extend sheets as needed.
6. Automation Reduces Errors
Formulas, conditional formatting, and charts eliminate manual mistakes.
7. Provides Historical Insights
Previous Year comparison helps organizations see long-term progress.
Since cement operations depend on accurate, timely insights, this dashboard becomes a valuable decision-making tool.
Click to Purchases Cement Industry KPI Dashboard in Excel
Best Practices for Using a Cement Industry KPI Dashboard in Excel
1. Update Data Regularly
Refresh Actual, Target, and Previous Year values every month so the dashboard remains accurate.
2. Maintain Consistent Units
Keep measurement units consistent across all sheets to avoid reporting confusion.
3. Use Clear KPI Definitions
Always update the KPI Definition sheet when introducing new KPIs.
4. Avoid Blank Rows
Do not leave empty rows in input sheets, as they may affect pivot tables and charts.
5. Refresh Pivot Tables
After updating data, always click Refresh All to ensure charts show the latest information.
6. Review Trends Frequently
Check KPI trends weekly or monthly to detect performance issues early.
7. Use Conditional Formatting Wisely
Color coding highlights gaps and supports faster interpretation.
Since dashboards depend on clean data, following these practices ensures accurate results and smooth performance.
Conclusion
The Cement Industry KPI Dashboard in Excel is a powerful, simple, and reliable tool that helps cement companies monitor their performance with clarity. Since it combines production, maintenance, quality, safety, and sales KPIs in one place, it becomes easier for managers to make data-backed decisions. Additionally, the dashboard saves time, reduces errors, and provides meaningful insights instantly.
With regular updates and good data practices, this dashboard becomes an essential part of an efficient, high-performing cement manufacturing operation.
Click to Purchases Cement Industry KPI Dashboard in Excel
Frequently Asked Questions (FAQs)
1. What is a Cement Industry KPI Dashboard in Excel?
It is a ready-to-use Excel dashboard that tracks KPIs across production, maintenance, safety, quality, and sales while comparing Actual, Target, and Previous Year numbers.
2. Who can use this dashboard?
Plant managers, production heads, quality teams, maintenance departments, and management teams can use it to monitor performance.
3. Do I need advance Excel skills to use this dashboard?
No. The dashboard is user-friendly and works through drop-down selections, charts, and automated formulas.
4. Can I add more KPIs to the dashboard?
Yes. You can customize the KPI Definition sheet and update the input sheets to include additional KPIs.
5. How often should I refresh the dashboard?
You should refresh it every time you enter new data. Click “Refresh All” to update all pivot tables.
6. Does the dashboard show comparisons with last year’s performance?
Yes. It includes Previous Year MTD and YTD values for every KPI.
7. Why is Excel a good tool for cement KPI reporting?
Excel is flexible, affordable, widely used, and supports automation with formulas and pivot tables.
8. Can I use this dashboard across different plants?
Yes. You can create separate input sheets for each plant or consolidate them into one file.
Click to Purchases Cement Industry KPI Dashboard in Excel
Visit our YouTube channel to learn step-by-step video tutorials