Managing a chiropractic clinic requires constant attention to patient satisfaction, operational efficiency, financial stability, and staff performance. With multiple responsibilities on the table, it becomes essential to measure results using a structured system. This is where a Chiropractic Clinic KPI Dashboard in Power BI comes into play.
In this article, we will explore the concept of a Chiropractic Clinic KPI Dashboard, how it works, its advantages, and the best practices to make the most of it. You will also find practical examples, detailed features, and FAQs to help you understand why this tool is a must-have for modern healthcare practices.
Click to Purchases Chiropractic Clinic KPI Dashboard in Power BI
What is a Chiropractic Clinic KPI Dashboard in Power BI?
A KPI (Key Performance Indicator) Dashboard is a data visualization tool that displays the most important metrics of a business. In a chiropractic clinic, these metrics may include patient visits, treatment outcomes, financial performance, and resource utilization.
When built in Power BI, the dashboard becomes even more powerful. Power BI offers interactive visuals, drill-through analysis, and real-time reporting, making it easier for clinic managers and doctors to make informed decisions.
Simply put, the Chiropractic Clinic KPI Dashboard in Power BI acts as a centralized control panel that highlights performance trends, compares actual results against targets, and provides actionable insights.
Key Features of the Chiropractic Clinic KPI Dashboard
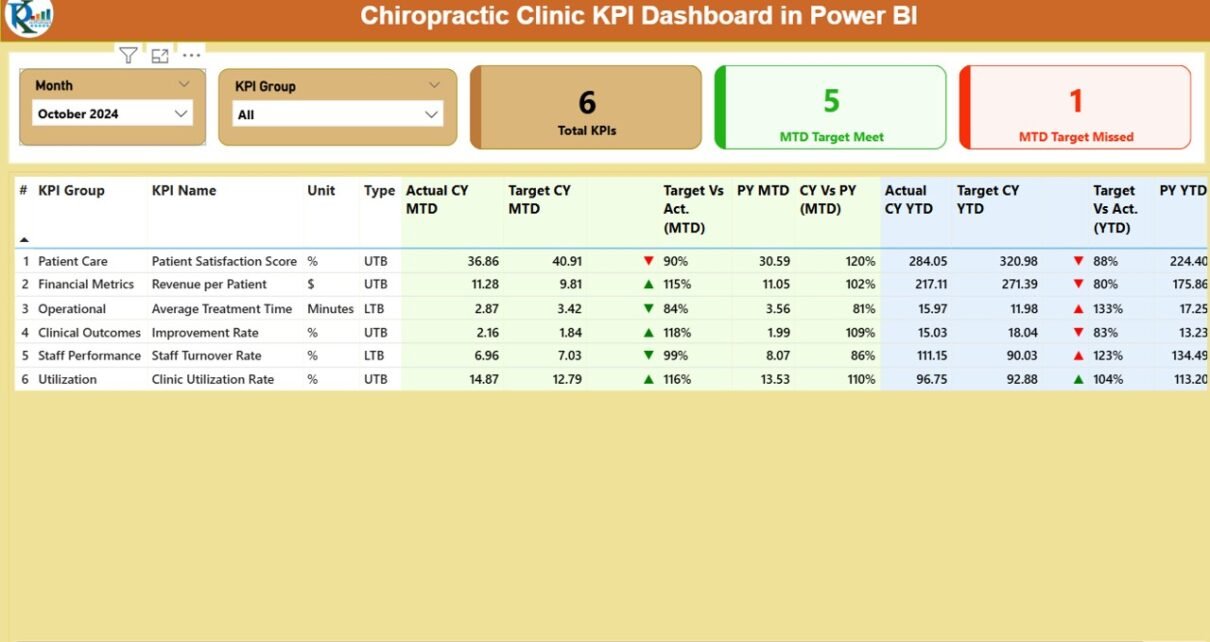
The Chiropractic Clinic KPI Dashboard in Power BI is designed to simplify complex data. It comes with three main pages in the Power BI desktop file:
Summary Page
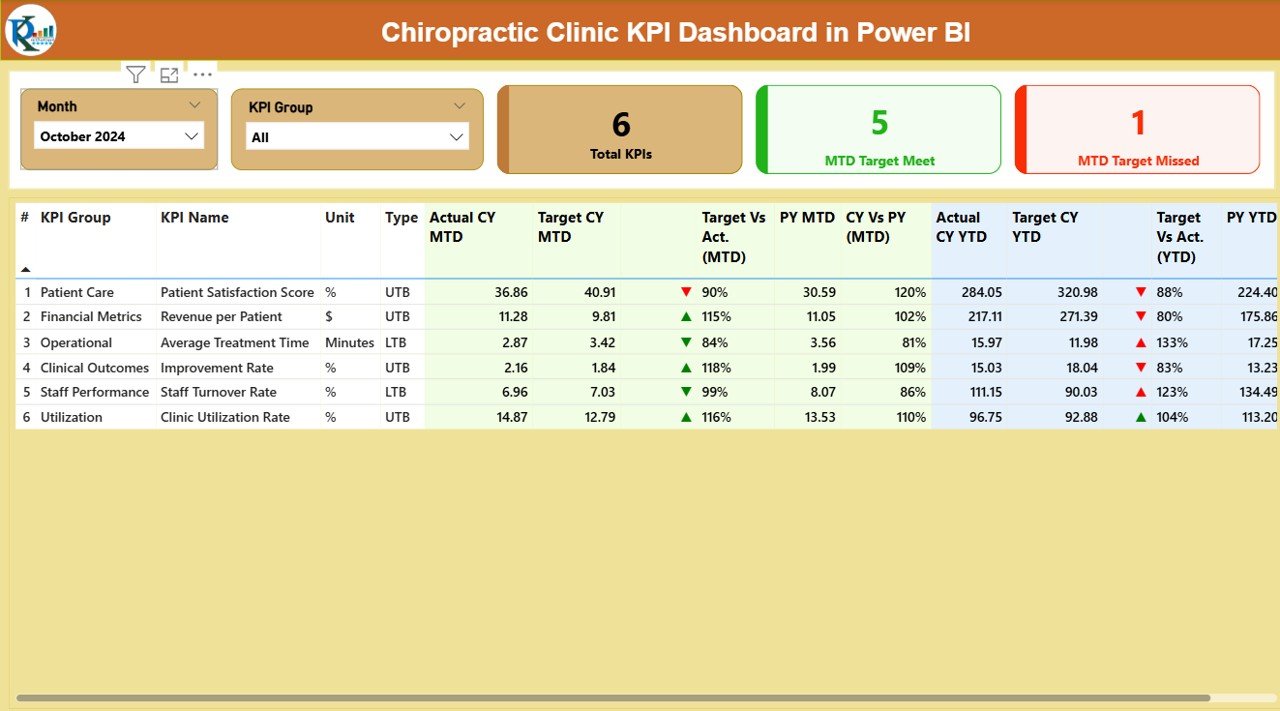
This is the main page of the dashboard where you get a high-level overview of all key metrics.
-
Month & KPI Group Slicer: Users can filter data by month and KPI group for focused analysis.
-
KPI Cards: Displays the total number of KPIs, how many targets were met, and how many were missed.
Detailed KPI Table:
- KPI Number (sequence of the KPI)
- KPI Group (such as Patient Care, Finance, Operations)
- KPI Name
- Unit of Measurement (e.g., patients, revenue, hours)
- Type (UTB – Upper the Better, or LTB – Lower the Better)
- Actual CY MTD (Current Year Month-to-Date Actual)
- Target CY MTD (Current Year Month-to-Date Target)
- Target vs Actual % (Performance percentage against the target)
- PY MTD (Previous Year MTD for comparison)
- CY vs PY (Comparison between current and previous year MTD)
- Actual CY YTD (Current Year-to-Date Actual)
- Target CY YTD (Current Year-to-Date Target)
- YTD Performance Icons (Red/Green ▲▼ for performance status)
- CY vs PY YTD (Year-to-Date comparison with previous year)
This section makes it easy to understand whether the clinic is on track or lagging behind.
KPI Trend Page
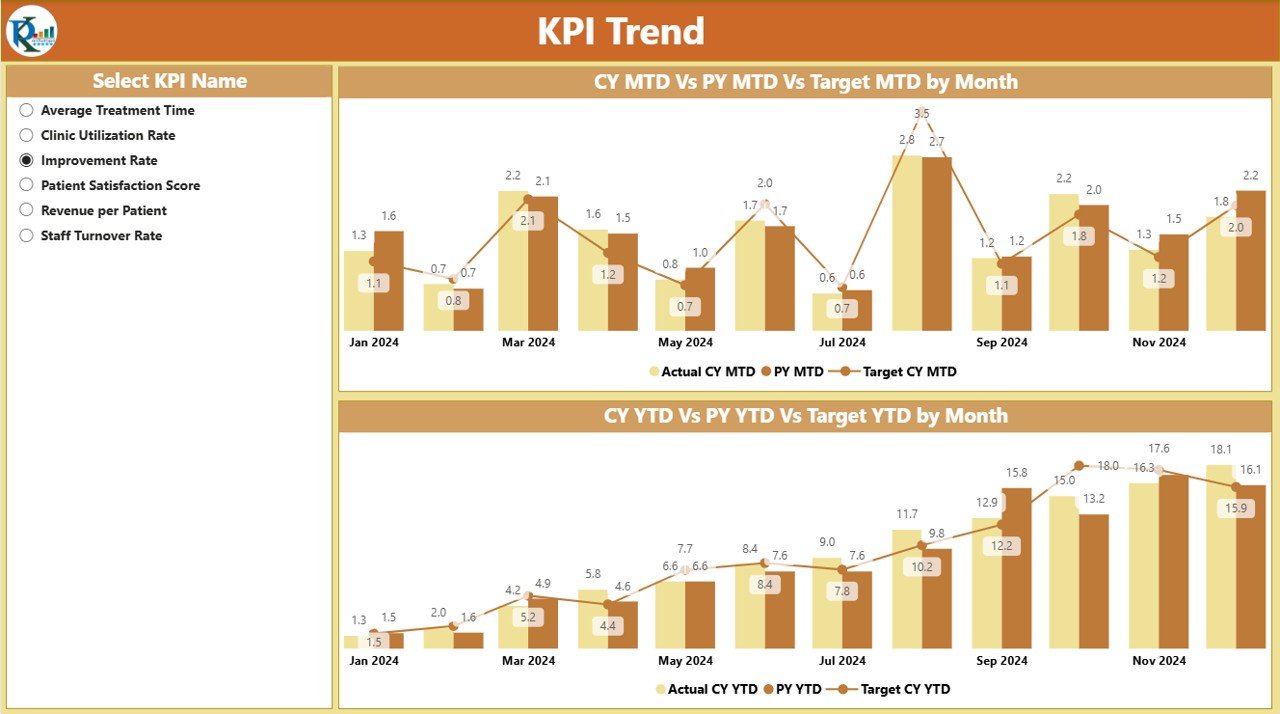
The KPI Trend page provides a visual representation of performance over time.
-
Two combo charts are used to compare Actual, Target, and Previous Year values.
-
Separate visualizations for MTD and YTD allow managers to track both short-term and long-term trends.
-
A slicer on the left helps in selecting individual KPIs for focused insights.
This page is especially useful for identifying patterns in patient visits, revenue cycles, or treatment success rates.
KPI Definition Page
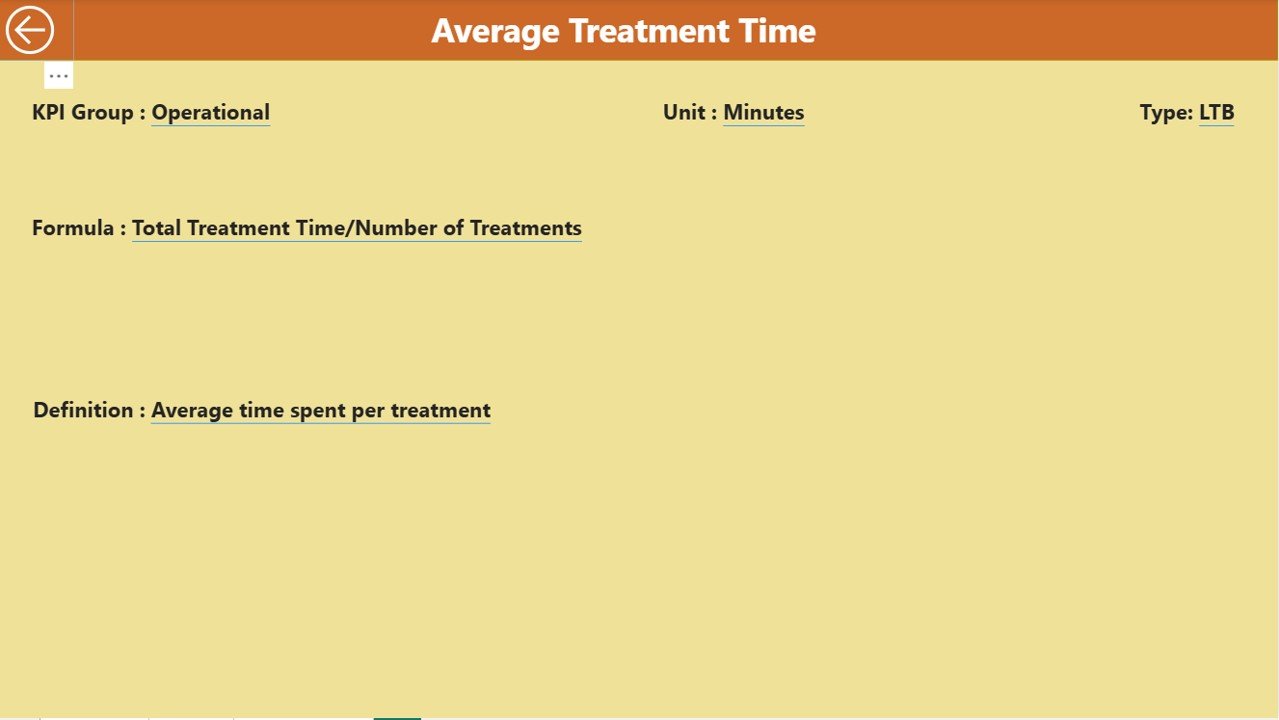
This is a drill-through page, hidden by default, but accessible when needed.
-
It contains the formula and definition of each KPI.
-
Users can drill down from the summary page to view details.
-
A back button is provided to return to the main page.
This ensures that everyone in the clinic—administrators, doctors, or finance managers—has a clear understanding of how each KPI is calculated.
Click to Purchases Chiropractic Clinic KPI Dashboard in Power BI
Data Source: Excel Integration
The dashboard uses an Excel file as its data source, making it user-friendly and easy to maintain.
Input_Actual Sheet
- Fill in the actual numbers for each KPI by month.
- Enter MTD and YTD values for performance tracking.
Input_Target Sheet
- Enter the target values for each KPI by month.
- Capture both MTD and YTD targets.
KPI Definition Sheet
- Define KPI Number, KPI Group, KPI Name, Unit, Formula, Definition, and Type (LTB/UTB).
This setup ensures that even non-technical staff can update and manage data easily.
Why Do Chiropractic Clinics Need a KPI Dashboard?
Chiropractic clinics face challenges such as:
-
Tracking patient appointments and satisfaction levels.
-
Managing revenue streams and insurance claims.
-
Ensuring staff productivity.
-
Monitoring treatment effectiveness.
-
Keeping operational costs under control.
A KPI dashboard consolidates all these aspects into one visual report. Instead of juggling spreadsheets and manual reports, clinic managers get real-time insights that help them:
-
Improve patient experience.
-
Optimize resource allocation.
-
Increase revenue efficiency.
-
Monitor compliance with industry standards.
Advantages of Chiropractic Clinic KPI Dashboard in Power BI
Implementing a KPI Dashboard in a chiropractic clinic provides multiple benefits:
✅ Centralized View: All critical data in one place.
✅ Real-Time Tracking: Get updated numbers instantly.
✅ Performance Comparison: Easily compare current vs previous year.
✅ Data Accuracy: Reduces manual errors by using Excel as the single data source.
✅ Better Decision-Making: Visuals make it easier to identify trends.
✅ Goal Alignment: Helps staff understand performance targets.
✅ Operational Efficiency: Saves time in generating manual reports.
Examples of KPIs for Chiropractic Clinics
To make the dashboard truly valuable, you can track KPIs in different categories:
Patient Care KPIs
-
Patient Visits per Month
-
Average Wait Time
-
Treatment Success Rate
-
Patient Retention Rate
Financial KPIs
-
Revenue per Patient
-
Insurance Claim Approval Rate
-
Monthly Collections vs Targets
-
Operating Cost Percentage
Operational KPIs
-
Staff Utilization Rate
-
Average Appointment Duration
-
No-Show Appointment Rate
-
Inventory Usage Efficiency
By including these KPIs, clinic managers get a 360-degree view of clinic performance.
Best Practices for the Chiropractic Clinic KPI Dashboard
To get the best results from your dashboard, follow these practices:
-
Keep KPIs Relevant: Focus only on metrics that directly impact clinic growth.
-
Automate Data Updates: Connect the Excel file to Power BI with scheduled refresh.
-
Use Visual Cues: Add icons and conditional formatting for quick insights.
-
Balance KPIs: Include patient satisfaction, financial, and operational KPIs.
-
Review Regularly: Set a monthly review meeting to discuss dashboard results.
-
Train Staff: Ensure all team members understand the KPI definitions.
-
Iterate and Improve: Add or modify KPIs as the clinic evolves.
Opportunities for Improvement
While the Chiropractic Clinic KPI Dashboard in Power BI is powerful, there is always room for growth:
🔹 Expand Data Sources: Connect directly with clinic management software or EMR systems instead of only Excel.
🔹 Add Predictive Analytics: Use AI models to forecast patient visits or revenue.
🔹 Include Patient Feedback: Incorporate survey data to measure satisfaction trends.
🔹 Mobile Access: Optimize the dashboard for smartphones and tablets.
🔹 Automated Alerts: Set up email or SMS notifications when KPIs fall below target.
Conclusion
The Chiropractic Clinic KPI Dashboard in Power BI is more than just a reporting tool—it is a decision-making companion for clinic owners and managers. With clear visuals, data accuracy, and customizable KPIs, it empowers clinics to enhance patient care, improve financial performance, and streamline operations.
By adopting best practices and continuously refining the dashboard, chiropractic clinics can achieve sustainable growth while maintaining high-quality care.
Frequently Asked Questions (FAQs)
1. What is the purpose of a Chiropractic Clinic KPI Dashboard?
The purpose is to track, measure, and improve clinic performance across patient care, financial stability, and operations. It ensures that managers can make data-driven decisions.
2. Can I customize the KPIs in the dashboard?
Yes. You can add, remove, or modify KPIs based on your clinic’s priorities. The Excel data source makes customization simple.
3. Do I need technical skills to use this dashboard?
No. The dashboard is designed for healthcare professionals. As long as you can update Excel sheets, you can use it effectively.
4. How often should I review my KPI dashboard?
It is recommended to review it monthly. However, high-volume clinics may benefit from weekly reviews.
5. Can this dashboard be connected to clinic management software?
Yes. Power BI supports integration with multiple data sources, including EMR and patient management systems, for real-time updates.
6. What are the most important KPIs for chiropractic clinics?
Some of the most valuable KPIs include patient visits, treatment success rates, patient retention, revenue per patient, and staff utilization.
Visit our YouTube channel to learn step-by-step video tutorials