Circular Economy Startups Dashboard in Power BI is a professionally designed analytics template that helps sustainability-focused businesses, green investors, and circular economy advocates track, measure, and optimize startup performance across environmental and operational metrics. Whether you are managing a portfolio of eco-innovation ventures, evaluating startup sustainability for investment decisions, or monitoring waste diversion and recycling efficiency across multiple product lines — this interactive Power BI dashboard delivers clear, actionable insights from complex sustainability data.
With five visually rich analysis pages, dynamic slicer filters, professional KPI card layouts, and DAX-powered calculations, this Power BI template empowers you to evaluate how effectively a startup is implementing circular economy principles — from material recovery and carbon savings to regional adoption rates and operational efficiency. It is the perfect companion for anyone serious about accelerating the transition to a fully circular business model.
Click here to Purchase Circular Economy Startups Dashboard in Power BI
Key Features of Circular Economy Startups Dashboard in Power BI
The Circular Economy Startups Dashboard in Power BI offers a comprehensive set of features designed specifically for tracking sustainability performance in the startup ecosystem. Here is what makes this template stand out:
- End-to-End Circular Economy Analytics — Track startup performance across waste diversion, recycling rates, resource efficiency, carbon savings, material recovery, and sustainability impact metrics from a single centralized dashboard.
- Five Interactive Dashboard Pages — Navigate through dedicated pages for overview KPIs, material flow analysis, sustainability impact trends, operational efficiency, and regional performance breakdowns.
- Dynamic Slicer Filters — Instantly filter data by startup name, material category, region, time period, and business model to drill into the metrics that matter most.
- Professional KPI Card Layout — High-level metrics are displayed in visually appealing card formats showing totals, percentages, and trend indicators for at-a-glance decision-making.
- Powered by DAX Formulas — All calculations, measures, and KPI logic leverage Power BI DAX for lightning-fast performance and automatic data refresh capabilities.
- Fully Customizable — Add new KPIs, modify chart types, adjust color themes, and expand the data model to match your specific circular economy tracking requirements.
- Cloud-Ready — Publish to Power BI Service for team collaboration, scheduled data refreshes, and mobile access.
- Click here to Purchase Circular Economy Startups Dashboard in Power BI
Dashboard Pages Explained
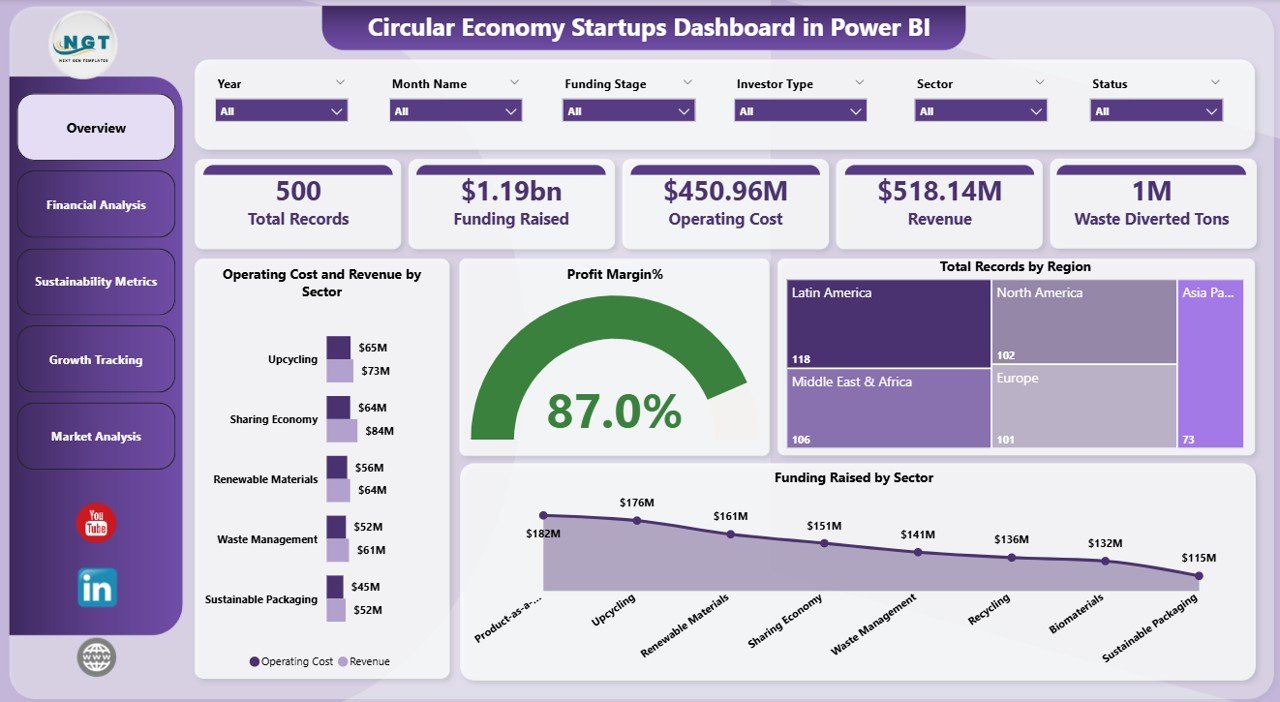
1 — Overview Page
The Overview Page serves as the main command center of the Circular Economy Startups Dashboard in Power BI. At the top, you will find high-level KPI cards displaying metrics such as Total Revenue, Waste Diverted, Recycling Rate, Carbon Savings, Active Startups, and Resource Recovery Rate. Below the cards, interactive charts visualize startup performance across key dimensions. Multiple slicers allow you to filter the entire page by startup name, region, material category, and time period for instant contextual analysis.
Overview Page — Circular Economy Startups Dashboard in Power BI
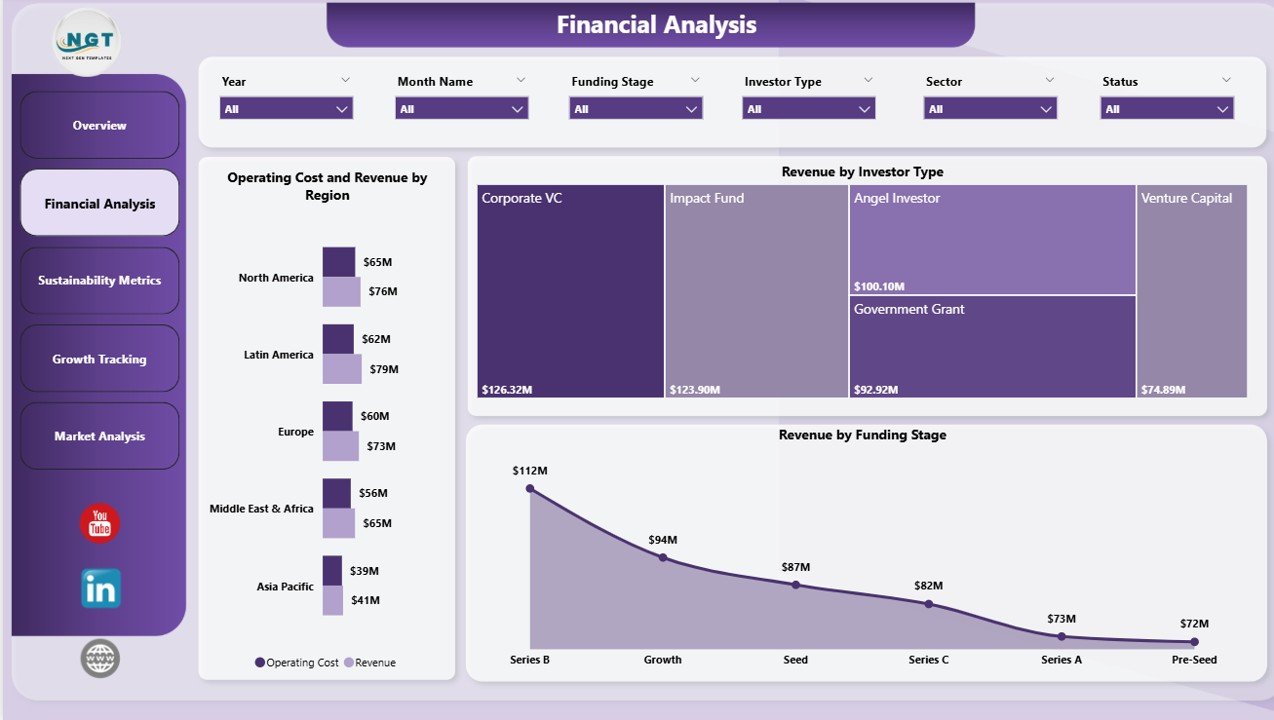
2 —Financial Analysis
The Financial Analysis page provides a deep-dive into how materials move through the circular economy pipeline. You can analyze material recovery by category, waste composition breakdown, recycling efficiency by material type, and resource utilization trends across all startup operations. This page helps identify which material streams are performing well and where improvements can drive greater circularity.
3 — Sustainability Impact Analysis
This page focuses on the environmental outcomes of circular economy practices. Track carbon emission reductions, water conservation metrics, energy savings, and environmental impact scores by startup and region. Comparative trend charts make it easy to identify which startups are leading in sustainability performance and which need additional support.
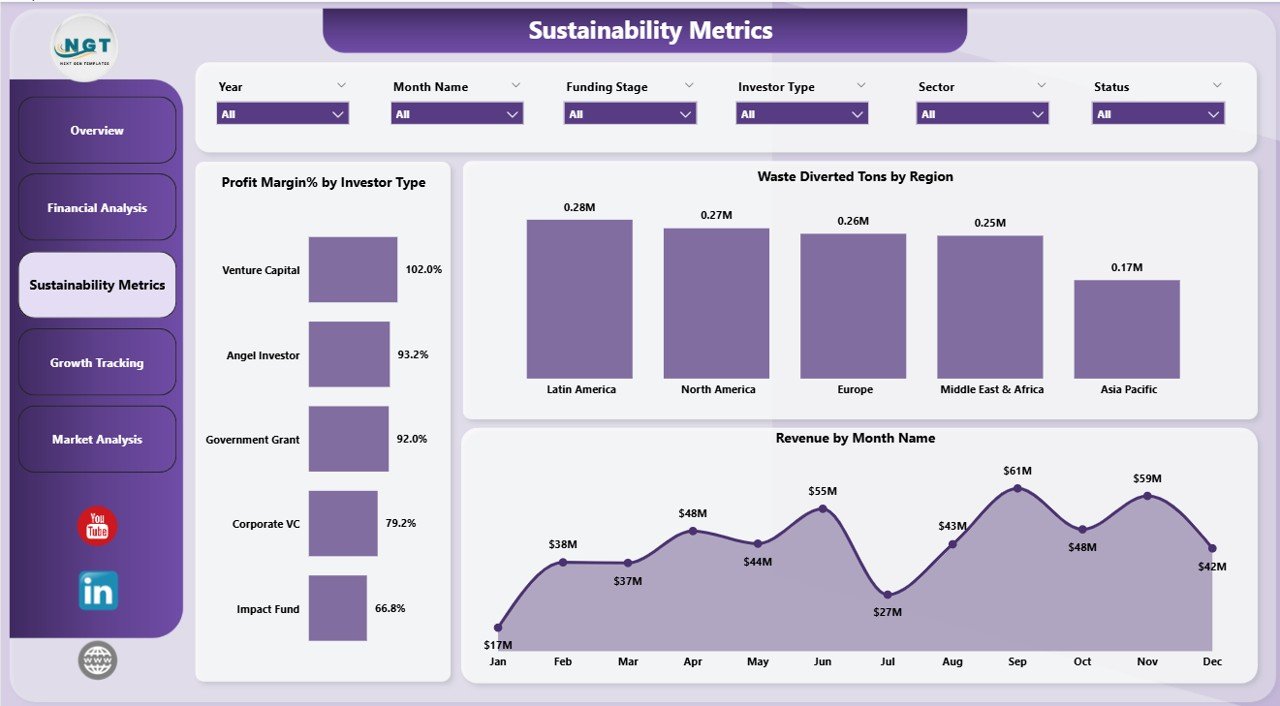
Sustainability Impact Analysis Page
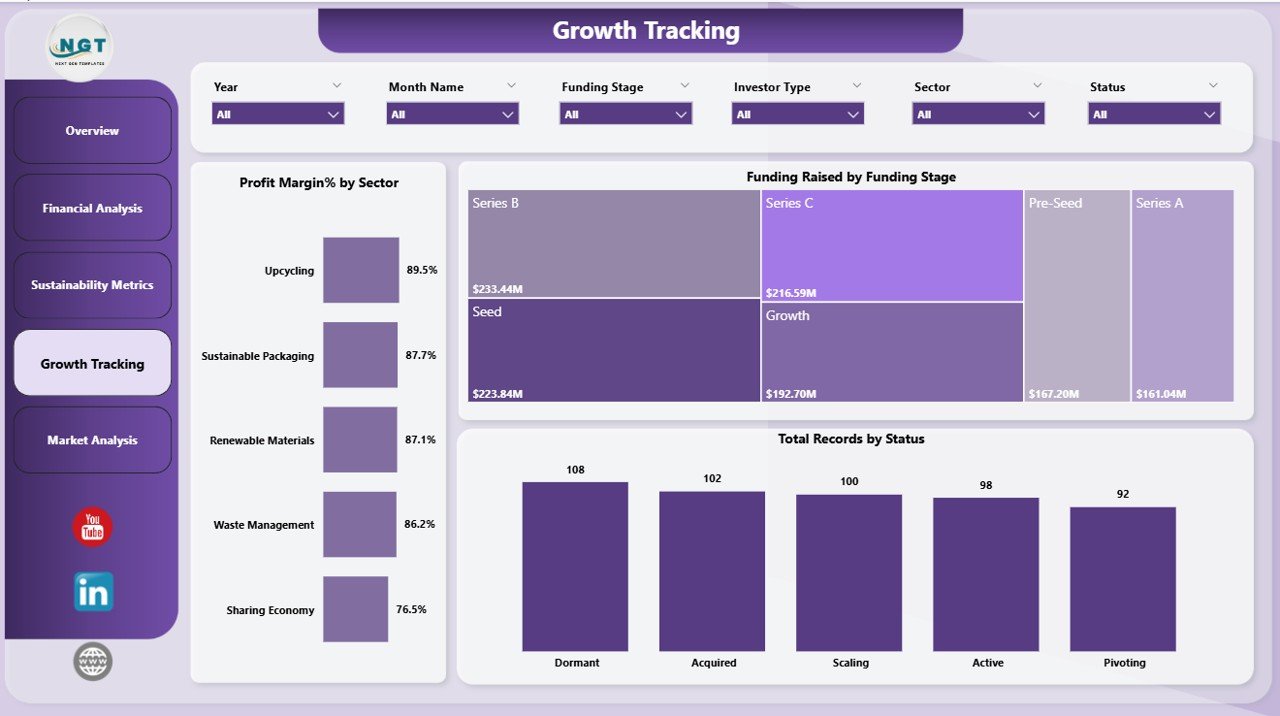
4 — Growth Tracking
The Growth Tracking page monitors the day-to-day operational KPIs that drive circular economy success. Review production waste rates, supply chain circularity metrics, product lifecycle performance, and cost savings achieved through circular practices. This page is essential for founders and operations managers looking to optimize processes and reduce waste at every stage.
Click here to Purchase Circular Economy Startups Dashboard in Power BI
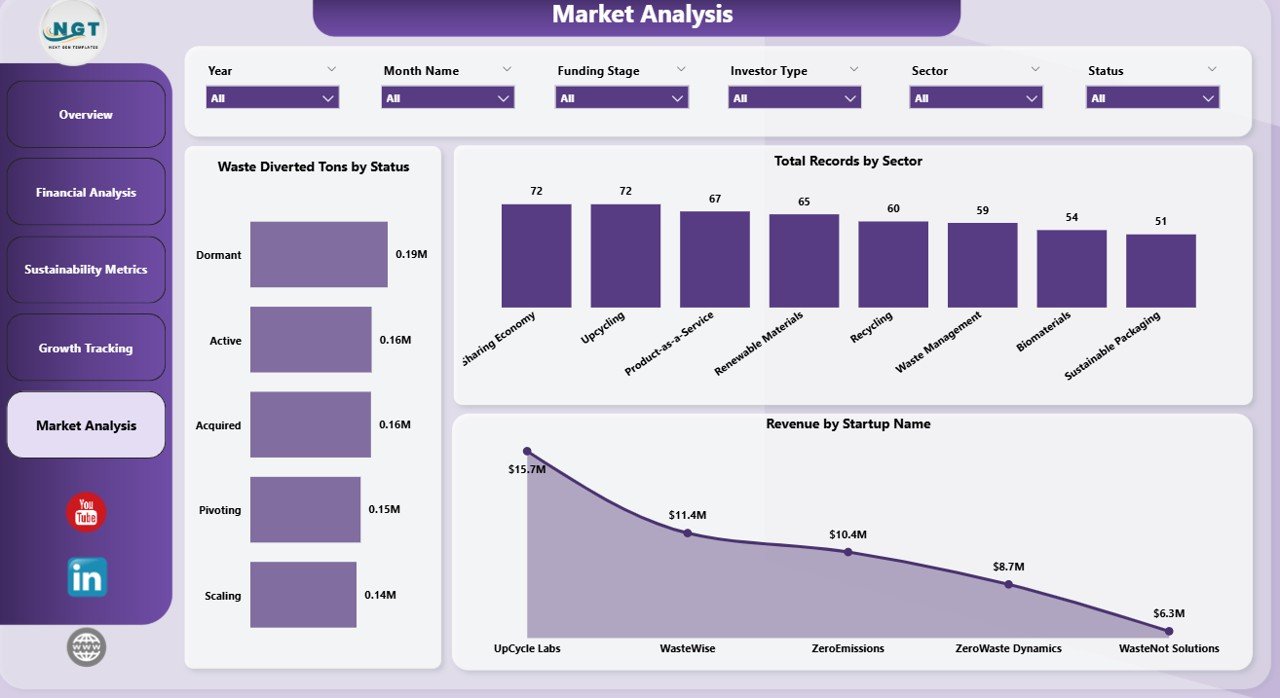
5 — Market Analysis
The Market Analysis page provides a geographic breakdown of startup sustainability metrics. Compare performance across different locations, evaluate market penetration for circular economy practices, and assess regional adoption rates. This page is particularly valuable for investors and accelerators managing startups across multiple geographies.
Advantages of Circular Economy Startups Dashboard in Power BI
- Centralized Sustainability Monitoring — Consolidate all circular economy KPIs into a single interactive Power BI dashboard, eliminating the need for scattered spreadsheets and manual reporting.
- Data-Driven Decision Making — Use real-time visual analytics to identify underperforming areas, optimize resource allocation, and accelerate sustainability outcomes across your startup portfolio.
- Investor-Ready Reporting — The professional layout and clean design make this dashboard ideal for stakeholder presentations, ESG reports, and board-level sustainability reviews.
- Scalable Architecture — Designed to handle growing datasets and additional startups, the Power BI data model scales seamlessly as your circular economy portfolio expands.
- Time Savings — Pre-built DAX measures and ready-to-use visuals eliminate hours of manual dashboard development, letting you focus on analysis rather than setup.
- Click here to Purchase Circular Economy Startups Dashboard in Power BI
Opportunities for Improvement
- Predictive Analytics Integration — Adding forecasting models using Power BI’s AI features could help predict future sustainability trends and resource needs.
- Benchmark Comparisons — Incorporating industry benchmark data would allow startups to compare their circular economy performance against sector averages.
- Automated Data Pipelines — Connecting live data sources through Power Query or APIs would enable real-time data ingestion without manual updates.
- Mobile Optimization — While already cloud-ready, creating a dedicated mobile layout could enhance on-the-go monitoring for field teams.
Best Practices for Using This Dashboard
- Update Data Regularly — Refresh your data model at least monthly to ensure all KPIs reflect current performance. Use Power BI scheduled refresh for automation.
- Start with the Overview — Begin each analysis session on the Overview Page to spot high-level trends before drilling into specific analysis pages.
- Use Slicers Strategically — Combine multiple slicer selections to create targeted views, such as filtering by a specific startup and time period simultaneously.
- Share via Power BI Service — Publish your dashboard to Power BI workspace so team members can access insights without needing the .pbix file.
- Customize KPI Thresholds — Adjust conditional formatting rules to match your organization’s performance targets for green, amber, and red indicators.
Explore Relevant Templates
If you found this Circular Economy Startups Dashboard in Power BI useful, explore these related sustainability and analytics templates on NextGenTemplates:
- Circular Economy Startups Dashboard in Excel — The Excel version of this same dashboard with pivot table automation.
- Circular Economy KPI Dashboard in Power BI — A KPI scorecard-style dashboard focused on circular economy metrics with MTD/YTD tracking.
- Circular Economy KPI Dashboard in Google Sheets — Track circular economy KPIs with real-time collaboration in Google Sheets.
- Packaging Sustainability KPI Dashboard in Excel — Monitor packaging waste reduction, recyclable material usage, and environmental impact.
- Ethical Fashion KPI Dashboard in Excel — Track sustainable sourcing, waste reduction, and labor practices in the fashion industry.
Frequently Asked Questions
Click here to Purchase Circular Economy Startups Dashboard in Power BI
What software do I need to open this dashboard?
You need Microsoft Power BI Desktop (free download from Microsoft) to open and edit the .pbix file. You can also publish it to Power BI Service for cloud-based access.
Can I customize the KPIs and visuals?
Yes, the dashboard is fully customizable. You can add new KPIs, modify existing measures, change chart types, adjust color themes, and expand the data model to match your specific tracking needs.
Is the sample data included?
Yes, the template comes with realistic sample data so you can explore the dashboard immediately. Simply replace the sample data with your actual startup performance data when ready.
Can I use this for multiple startups?
Absolutely. The dashboard is designed to handle multiple startups with slicer filters that let you view data for individual startups or across your entire portfolio.
How do I refresh the data?
After updating your data source, click the Refresh button in Power BI Desktop. All DAX measures and visuals will recalculate automatically. For cloud-based access, set up scheduled refresh in Power BI Service.
Is this suitable for investor presentations?
Yes, the professional design with clean layouts, KPI cards, and interactive charts makes this dashboard ideal for board meetings, ESG reporting, and investor presentations.
Conclusion
Click here to Purchase Circular Economy Startups Dashboard in Power BI
The Circular Economy Startups Dashboard in Power BI is a must-have analytics tool for anyone involved in tracking, evaluating, or improving sustainability performance in the startup ecosystem. With five dedicated analysis pages, dynamic slicer filters, professional KPI cards, and DAX-powered calculations, this template transforms raw circular economy data into powerful visual insights that drive smarter decisions.
Whether you are a startup founder measuring your environmental footprint, an impact investor assessing portfolio sustainability, or a sustainability manager optimizing circular economy practices across multiple ventures — this dashboard gives you the clarity and control you need.
Click here to Purchase Circular Economy Startups Dashboard in Power BI
Visit our YouTube channel for step-by-step video tutorials:
Youtube.com/@PK-AnExcelExpert