Board Game Startups Dashboard in Power BI is a professionally designed, interactive analytics template built specifically for board game entrepreneurs, tabletop gaming startups, indie game studios, crowdfunding campaign managers, and entertainment business analysts. If you are looking for the best way to monitor revenue, costs, profit margins, customer ratings, and funding performance across your board game product portfolio, this ready-to-use Power BI dashboard brings everything together into one powerful, DAX-driven analytics hub.
Board game startups operate in a dynamic industry where understanding your financial performance, game category trends, distribution channel effectiveness, and funding source ROI can mean the difference between scaling successfully and running out of runway. This dashboard eliminates the guesswork by consolidating your critical business data into five visually rich, filterable pages — each designed to answer specific strategic questions about your board game business. With dynamic slicer filters, professional KPI card layouts, and automated DAX calculations, every visual updates instantly for real-time contextual analysis.
Click here to Purchase Board Game Startups Dashboard in Power BI
Key Features of Board Game Startups Dashboard in Power BI
This Board Game Startups Dashboard in Power BI delivers enterprise-grade analytics capabilities in a familiar Power BI environment. Here are the standout features that make this template essential for any board game business:
- Comprehensive KPI Card Layout — Monitor Total Startups, Total Cost, Total Revenue, Net Profit, and Avg Customer Rating from dynamic cards on the Overview page for an instant snapshot of business health.
- Five Dedicated Analysis Pages — Explore Overview, Category Analysis, Funding Insights, Regional Performance, and Monthly Trends for a 360-degree view of your board game startup operations.
- Interactive Slicer Filters — Instantly filter data by game category, funding stage, distribution channel, city, country, status, and more for precise drill-down analysis across every page.
- DAX-Powered Automation — Every chart and KPI card is driven by Power BI DAX measures, so the entire dashboard updates automatically when your data source is refreshed.
- No Complex Setup Required — Simply open the .pbix file in Power BI Desktop, explore the sample data, and replace it with your own records when ready.
- Cloud-Ready Publishing — Publish to Power BI Service for team collaboration, scheduled data refreshes, and mobile access from anywhere.
- Professional Visual Design — Clean chart layouts with consistent color coding make this dashboard presentation-ready for investors and stakeholders.
Dashboard Pages Explained
1 — Overview Page
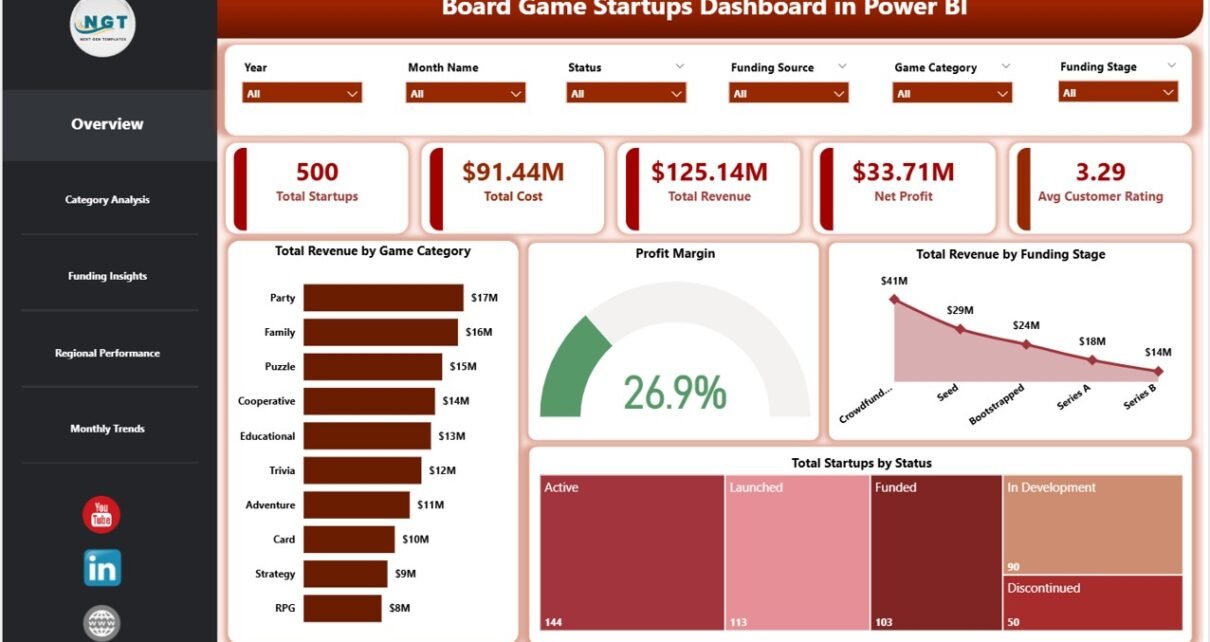
The Overview Page is the command center of this Board Game Startups Dashboard in Power BI. At the top, you will find high-level KPI cards displaying Total Startups, Total Cost, Total Revenue, Net Profit, and Avg Customer Rating. These cards give decision-makers an instant pulse on overall business performance without needing to dig into individual data points.
Below the KPI cards, several interactive charts provide deeper analytical context. Total Revenue by Game Category reveals which game types generate the most income, helping you identify your most profitable product lines. Profit Margin gives a quick profitability assessment across your entire portfolio. Total Revenue by Funding Stage helps evaluate how different stages of investment correlate with revenue generation, which is critical for fundraising strategy. Total Startups by Status shows the operational distribution of your board game portfolio across active, paused, and completed ventures. Multiple slicers allow you to filter the entire page dynamically for quick targeted analysis.
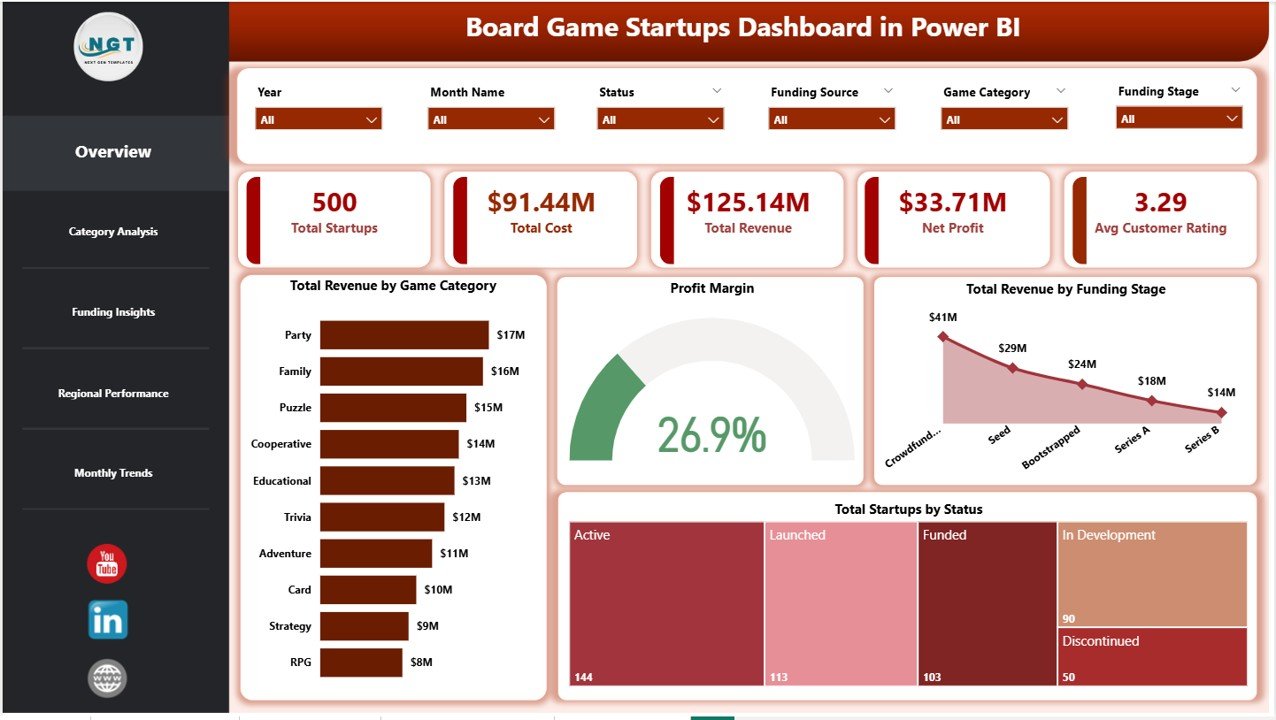
Board Game Startups Dashboard in Power BI
2 — Category Analysis
The Category Analysis page dives deep into the performance of different board game categories and distribution channels. Total Backers by Game Category shows which game types are attracting the most crowdfunding supporters, helping you understand community demand patterns and backer engagement across your product lineup.
Total Revenue by Distribution Channel breaks down income sources across retail, online, wholesale, and other channels to identify where your strongest sales are coming from. Profit Margin by Distribution Channel highlights which channels deliver the healthiest margins, enabling you to optimize your distribution strategy and allocate marketing budgets more effectively. This page is invaluable for startups looking to maximize channel-level profitability.
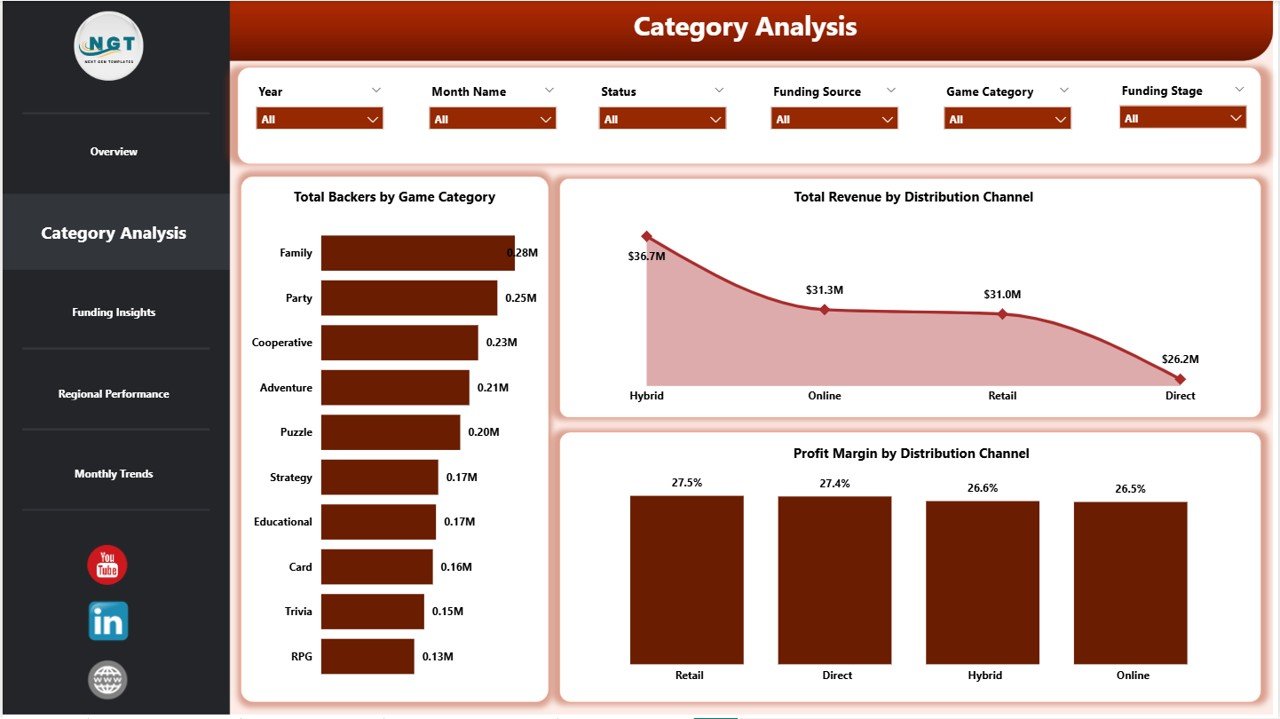
Category Analysis
3 — Funding Insights
The Funding Insights page is invaluable for board game startups navigating different funding landscapes. Total Marketing Spend by Funding Stage reveals how marketing budgets are distributed across seed, Series A, growth, and other stages, helping founders understand where marketing dollars are being allocated most heavily.
Profit Margin by Funding Stage helps founders and investors understand profitability across different maturity levels of the business, revealing whether early-stage or growth-stage ventures are delivering stronger margins. Avg Customer Rating by Funding Source shows whether certain funding paths correlate with higher product quality or customer satisfaction, which is a critical signal for investors evaluating portfolio health.
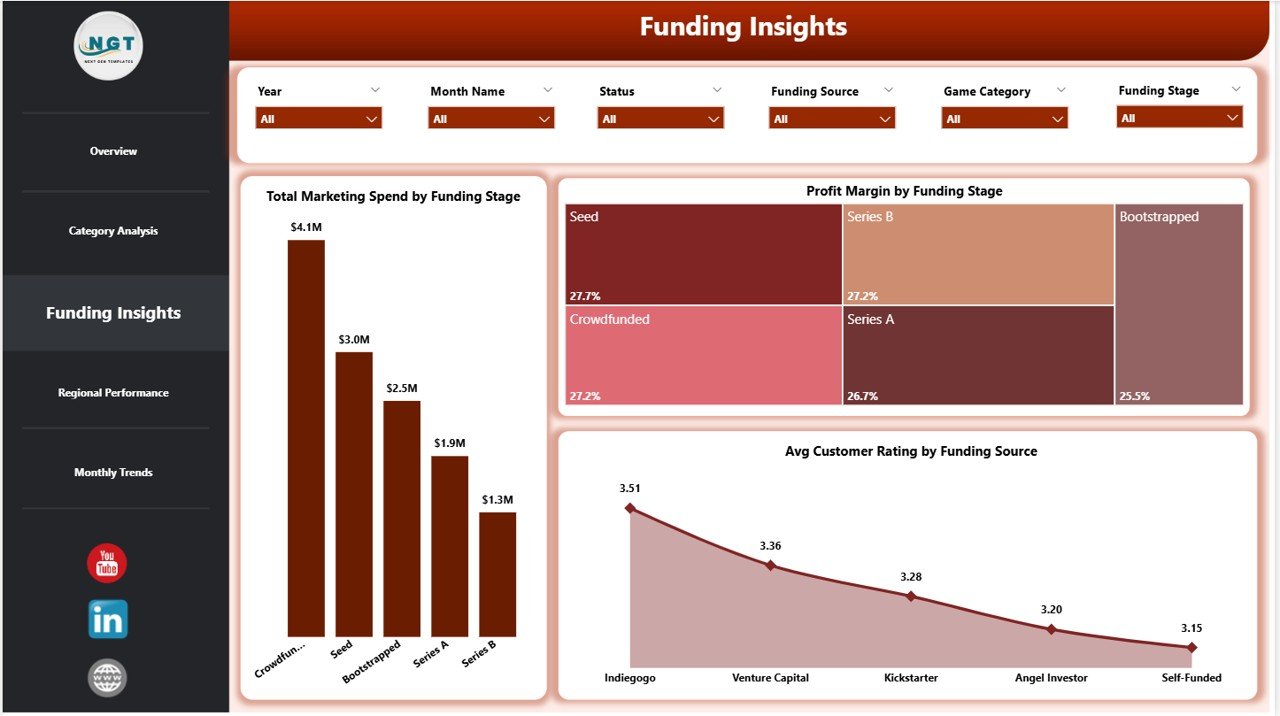
Funding Insights
4 — Regional Performance
The Regional Performance page gives geographic visibility into your board game startup operations. Total Startups by City pinpoints your most active markets at a city level, enabling you to identify geographic concentration and evaluate where expansion efforts should be directed next.
Total Revenue by Funding Source connects geographic revenue patterns with investor types, while Total Revenue by Status breaks down income by operational status to help you understand which stage of your startup lifecycle contributes most to the top line. This page is especially useful for startups expanding into new territories or evaluating which regional markets deserve more investment in distribution and marketing.
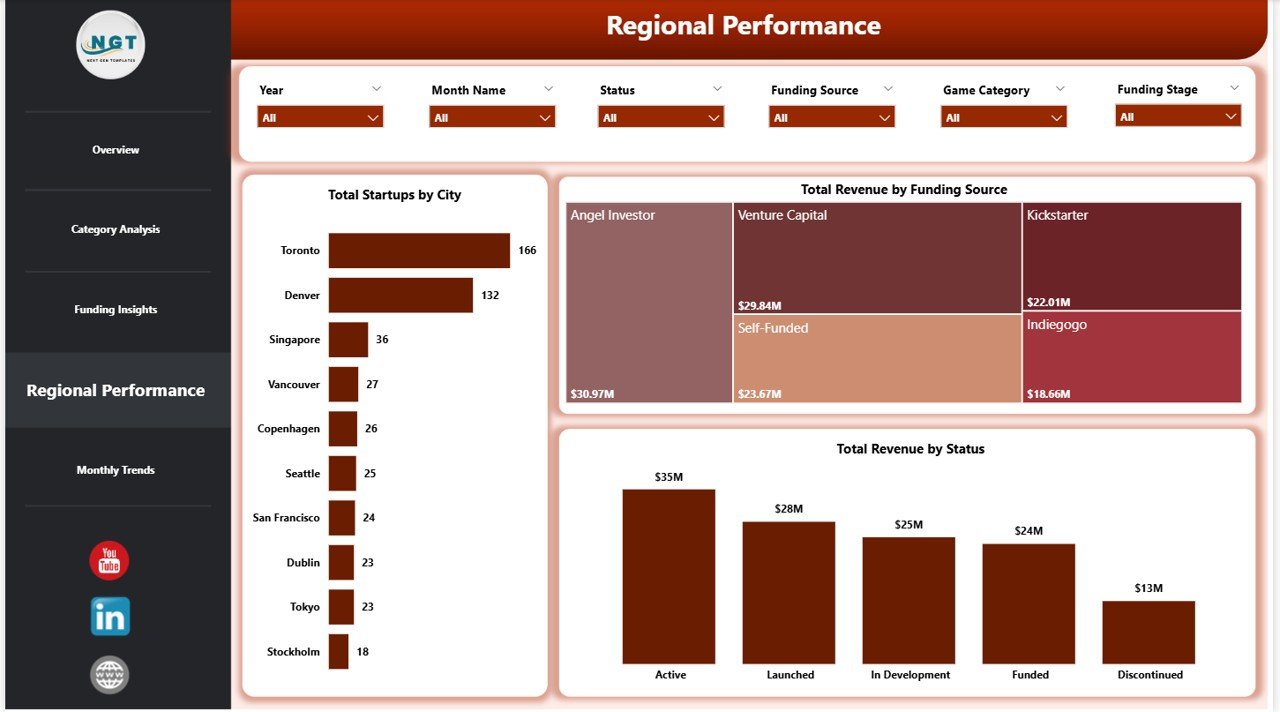
Regional Performance
5 — Monthly Trends
The Monthly Trends page provides time-based analysis that helps board game businesses identify seasonal patterns and growth trajectories. Total Cost by Month Name tracks expense fluctuations over the year, which is critical for operations teams anticipating cost surges during production-heavy months such as pre-holiday manufacturing runs.
Total Revenue by Month Name monitors income fluctuations, helping identify holiday season spikes and slower quarters that may require adjusted marketing strategies. Profit Margin by Month Name reveals whether profitability holds steady or fluctuates with volume changes, enabling data-driven decisions about pricing, promotions, and production scheduling throughout the year.
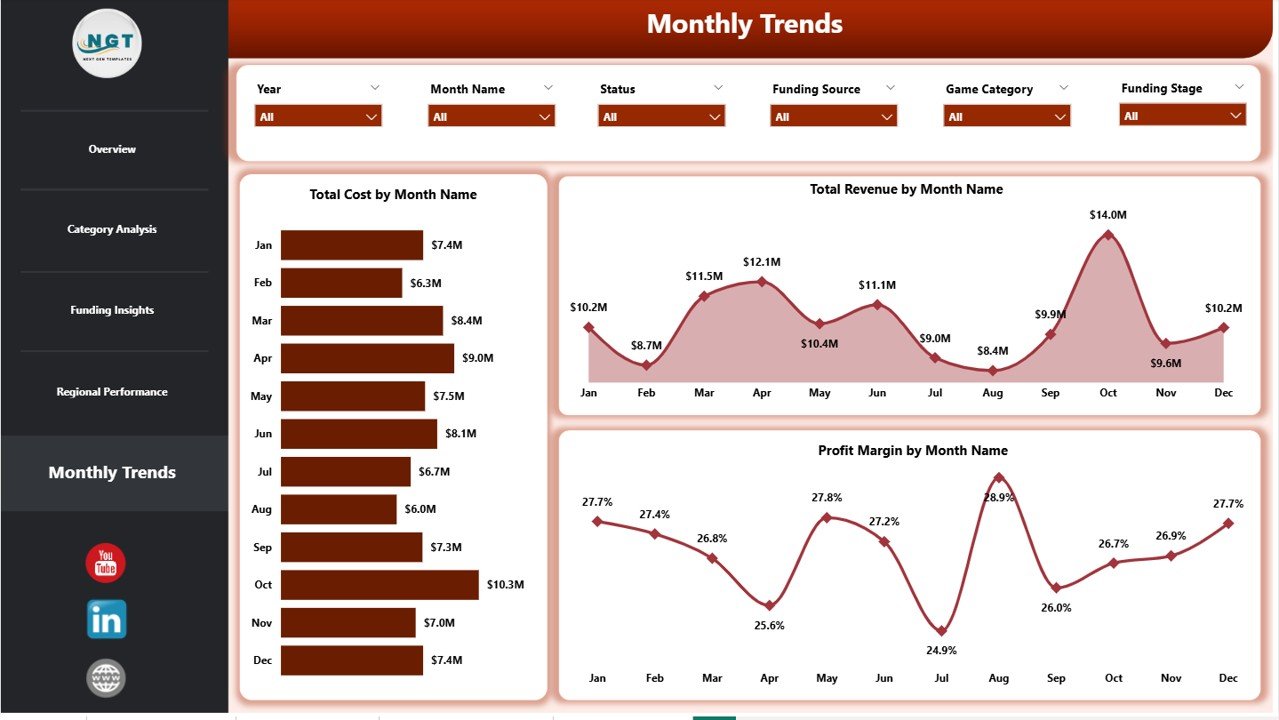
Monthly Trends
Advantages of Board Game Startups Dashboard in Power BI
- Instant Business Visibility — Get a complete picture of your board game startup performance across revenue, costs, margins, ratings, and funding without switching between multiple tools or spreadsheets.
- Data-Driven Decision Making — Replace gut feelings with visual analytics that clearly show which game categories, channels, regions, and funding sources are performing best.
- Investor-Ready Reporting — The professional chart layouts and KPI cards make this dashboard ideal for board meetings, investor updates, pitch deck data appendices, and stakeholder presentations.
- Scalable Architecture — Designed to handle growing datasets and additional startups, the Power BI data model scales seamlessly as your board game portfolio expands.
- Cost-Effective Analytics — Get enterprise-grade dashboard capabilities using the free Power BI Desktop application, with optional cloud publishing for team access.
- Time Savings — Pre-built DAX measures and ready-to-use visuals eliminate hours of manual dashboard development, letting you focus on analysis rather than setup.
Opportunities for Improvement
- Predictive Analytics Integration — Adding forecasting models using Power BI’s built-in AI features could help predict future revenue trends and seasonal demand patterns for specific game categories.
- Benchmark Comparisons — Incorporating industry benchmark data would allow startups to compare their board game performance against sector averages and top performers.
- Additional Time Granularity — While monthly trends are covered, adding weekly or quarterly roll-up views could benefit startups with faster release cycles or campaign-based sales patterns.
- Dashboard Page for Individual Games — A dedicated page where users can select a specific board game title and see all its metrics in one view would be a powerful addition for studios with large catalogs.
Best Practices for Using This Dashboard
- Update Data Regularly — For the most accurate insights, refresh your data source weekly or monthly and click Refresh in Power BI Desktop to update all visuals automatically.
- Use Slicers Strategically — Combine multiple slicer selections to compare specific game categories within specific funding stages or regions for hyper-targeted analysis.
- Start with the Overview Page — Begin each analysis session on the Overview page to spot high-level trends before drilling into specific analysis pages for deeper context.
- Publish to Power BI Service — Share your dashboard with team members by publishing to Power BI workspace so everyone can access insights without needing the .pbix file.
- Customize KPI Thresholds — Adjust conditional formatting rules to match your organization’s performance targets for green, amber, and red indicators.
Explore Relevant Templates
If you found the Board Game Startups Dashboard in Power BI useful, check out these related templates on NextGenTemplates:
- Board Game Startups Dashboard in Excel — The Excel version of this same dashboard with pivot table automation and interactive slicers.
- Circular Economy Startups Dashboard in Power BI — Track sustainability KPIs, waste diversion, and recycling efficiency for eco-focused startups.
- Circular Economy Startups Dashboard in Excel — Excel-based sustainability analytics with pivot-powered automation.
- Change Agents Office Dashboard in Power BI — Multi-page Power BI analytics dashboard with interactive charts and DAX-driven KPIs.
Frequently Asked Questions
What software do I need to open this Board Game Startups Dashboard?
You need Microsoft Power BI Desktop, which is a free download from Microsoft. You can open and edit the .pbix file, replace the sample data, and explore all five dashboard pages without any paid subscription. For cloud sharing, you can publish to Power BI Service.
Can I customize the KPIs and visuals in this dashboard?
Yes, the dashboard is fully customizable. You can add new KPIs, modify existing DAX measures, change chart types, adjust color themes, and expand the data model to match your specific board game business tracking requirements.
Is the sample data included in the template?
Yes, the template comes with realistic sample data so you can explore the dashboard immediately after downloading. Simply replace the sample data with your actual board game startup performance records when you are ready to use it for real analysis.
Can I use this dashboard for multiple board game companies?
Absolutely. The dashboard is designed to handle multiple startups simultaneously with slicer filters that let you view data for individual companies or across your entire portfolio at once.
How do I refresh the data after making changes?
After updating your data source, click the Refresh button in Power BI Desktop. All DAX measures and visuals will recalculate automatically across every page. For cloud-based access, set up scheduled refresh in Power BI Service.
Is this dashboard suitable for investor presentations?
Yes, the professional design with clean layouts, KPI cards, and interactive charts makes this dashboard ideal for board meetings, ESG reporting, investor pitch data appendices, and stakeholder presentations.
Conclusion
The Board Game Startups Dashboard in Power BI is a must-have analytics tool for anyone serious about building a data-driven board game business. With five interactive pages covering everything from high-level KPIs and game category analysis to funding insights, regional performance, and monthly trends, this dashboard gives you the clarity you need to make smarter decisions, impress investors, and scale your startup confidently.
Click here to Purchase Board Game Startups Dashboard in Power BI
Visit our YouTube channel for step-by-step video tutorials: Youtube.com/@PK-AnExcelExpert