Managing tenders in a clinic environment requires accuracy, speed, and full visibility. Clinics deal with multiple tenders related to medical equipment, pharmaceuticals, IT systems, facility management, and outsourced services. However, when tender data stays scattered across Excel files, emails, and manual reports, tracking performance becomes difficult. As a result, delays increase, compliance risks rise, and decision-making slows down.
This is exactly where a Clinic Tender Dashboard in Power BI becomes a powerful and practical solution.
In this detailed article, you will learn what a Clinic Tender Dashboard in Power BI is, how it works, why clinics need it, its complete dashboard structure, key features, advantages, best practices, use cases, and frequently asked questions. Moreover, the language stays simple, clear, and business-focused so clinic administrators, procurement teams, and decision-makers can use it confidently.
Click to Purchases Clinic Tender Dashboard in Power BI
What Is a Clinic Tender Dashboard in Power BI?
A Clinic Tender Dashboard in Power BI is a centralized, interactive reporting solution designed to track, analyze, and monitor clinic tender data in real time.
Instead of reviewing hundreds of rows in spreadsheets, this dashboard converts raw tender data into:
-
Interactive KPI cards
-
Dynamic charts and visuals
-
Clinic-wise and category-wise insights
-
Monthly performance trends
As a result, clinic management teams gain instant visibility into tender values, bid status, estimated costs, and open tenders.
Why Do Clinics Need a Tender Dashboard in Power BI?
Clinics operate in a highly regulated and cost-sensitive environment. Therefore, tender decisions directly impact financial performance, compliance, and service quality.
However, many clinics still rely on manual tracking methods. This approach causes several challenges:
-
Difficulty tracking open and closed tenders
-
Limited visibility into bid values and tender categories
-
Delays in identifying cost overruns
-
Poor comparison across clinic locations and types
A Clinic Tender Dashboard in Power BI solves these problems by providing real-time insights and structured analysis. Consequently, clinics make faster, data-driven decisions with confidence.
How Does a Clinic Tender Dashboard in Power BI Work?
The dashboard works by connecting tender data from Excel, databases, or ERP systems into Power BI. Once connected, Power BI transforms this data into interactive visuals.
Here is how the process flows:
-
Tender data gets captured in a structured format
-
Power BI imports and cleans the data
-
Calculations and measures generate KPIs
-
Visuals update automatically with slicers
As a result, users can analyze tenders by clinic name, clinic type, category, status, city, and month with just a few clicks.
Key Features of Clinic Tender Dashboard in Power BI
The Clinic Tender Dashboard in Power BI comes with a well-structured, multi-page layout. Each page focuses on a specific analytical view. Let us explore each page in detail.
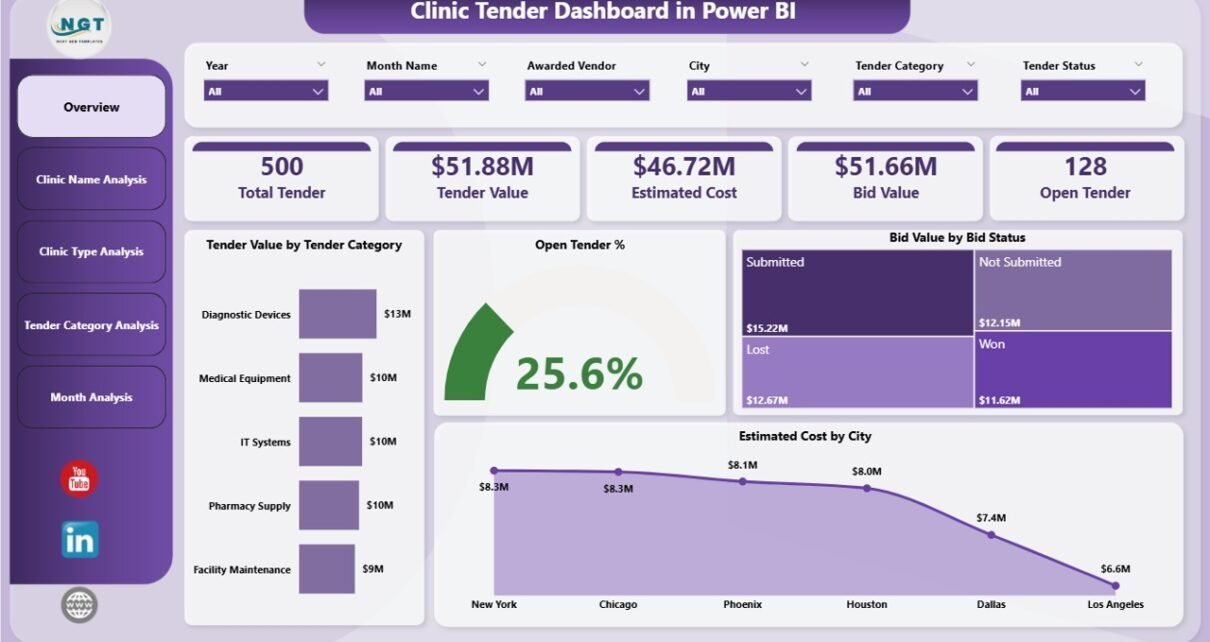
What Is Included in the Overview Page of the Clinic Tender Dashboard?
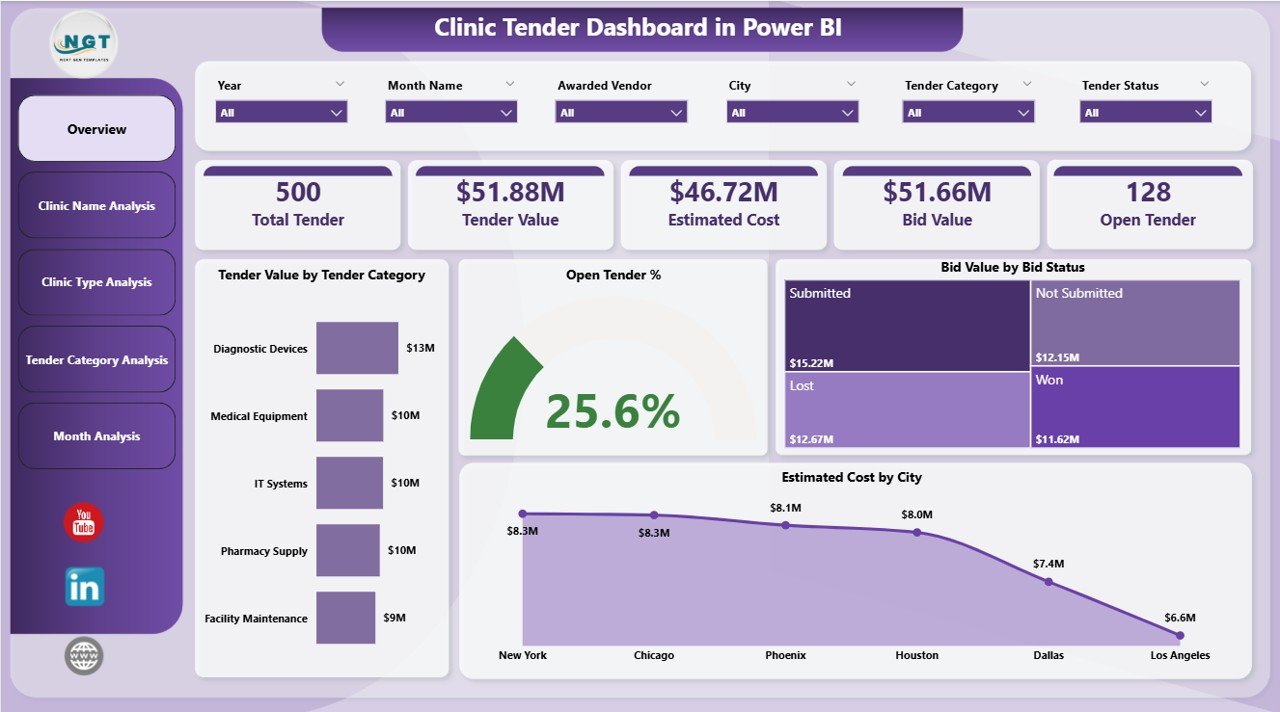
The Overview Page acts as the control center of the dashboard. It provides a high-level summary of tender performance across all clinics.
Key Elements of the Overview Page
-
Interactive slicers to filter data by time, category, or clinic
-
4 KPI cards showing overall tender metrics
-
4 dynamic charts for quick trend analysis
Charts Available on the Overview Page
-
Tender Value by Tender Category
This chart helps identify which tender categories carry the highest financial value. -
Open Tender %
This visual highlights the proportion of active or pending tenders. -
Bid Value by Bid Status
This chart shows bid values across statuses such as open, awarded, or rejected. -
Estimated Cost by City
This visual compares projected costs across different clinic locations.
As a result, decision-makers get an instant snapshot of tender performance.
How Does Clinic Name Analysis Improve Tender Monitoring?
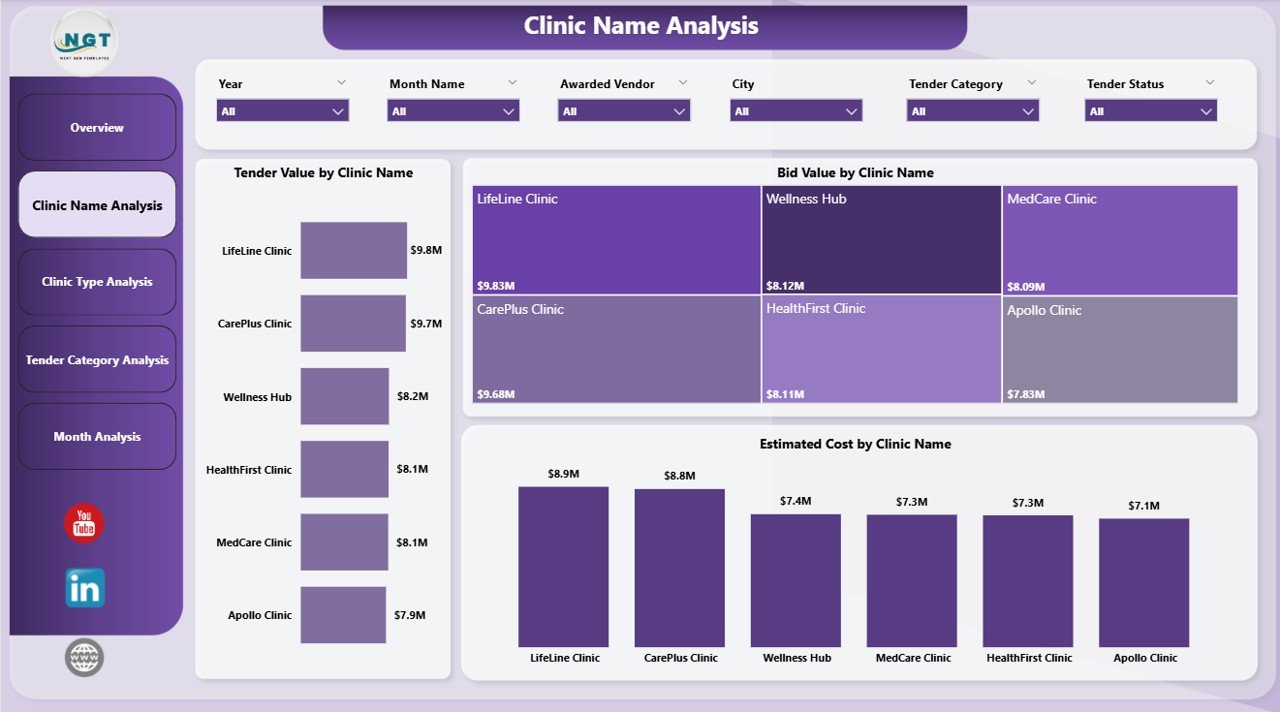
The Clinic Name Analysis Page focuses on clinic-wise tender performance. This page proves extremely useful for organizations managing multiple clinic branches.
Key Charts on Clinic Name Analysis Page
-
Tender Value by Clinic Name
This chart shows how much tender value each clinic manages. -
Bid Value by Clinic Name
This visual compares bid amounts across clinics. -
Estimated Cost by Clinic Name
This chart highlights expected costs per clinic.
Consequently, management can quickly identify high-value clinics and cost-heavy locations.
Why Is Clinic Type Analysis Important in Tender Management?
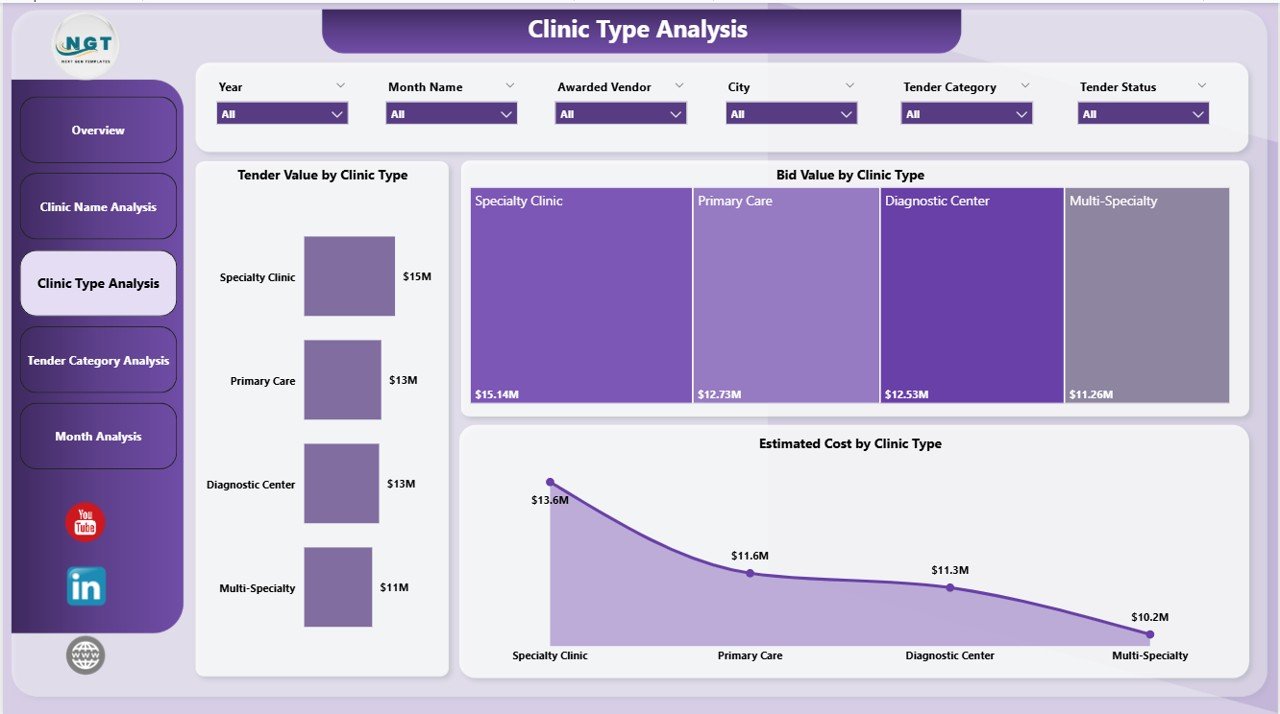
Clinics often operate under different categories such as general clinics, specialty clinics, diagnostic centers, or multi-specialty hospitals. Therefore, analyzing tenders by clinic type becomes essential.
Key Charts on Clinic Type Analysis Page
-
Tender Value by Clinic Type
This chart shows how tender values distribute across clinic categories. -
Bid Value by Clinic Type
This visual compares bid investments among clinic types. -
Estimated Cost by Clinic Type
This chart highlights cost expectations by clinic classification.
As a result, leadership teams can align tender strategies with clinic business models.
Click to Purchases Clinic Tender Dashboard in Power BI
What Insights Does Tender Category Analysis Provide?
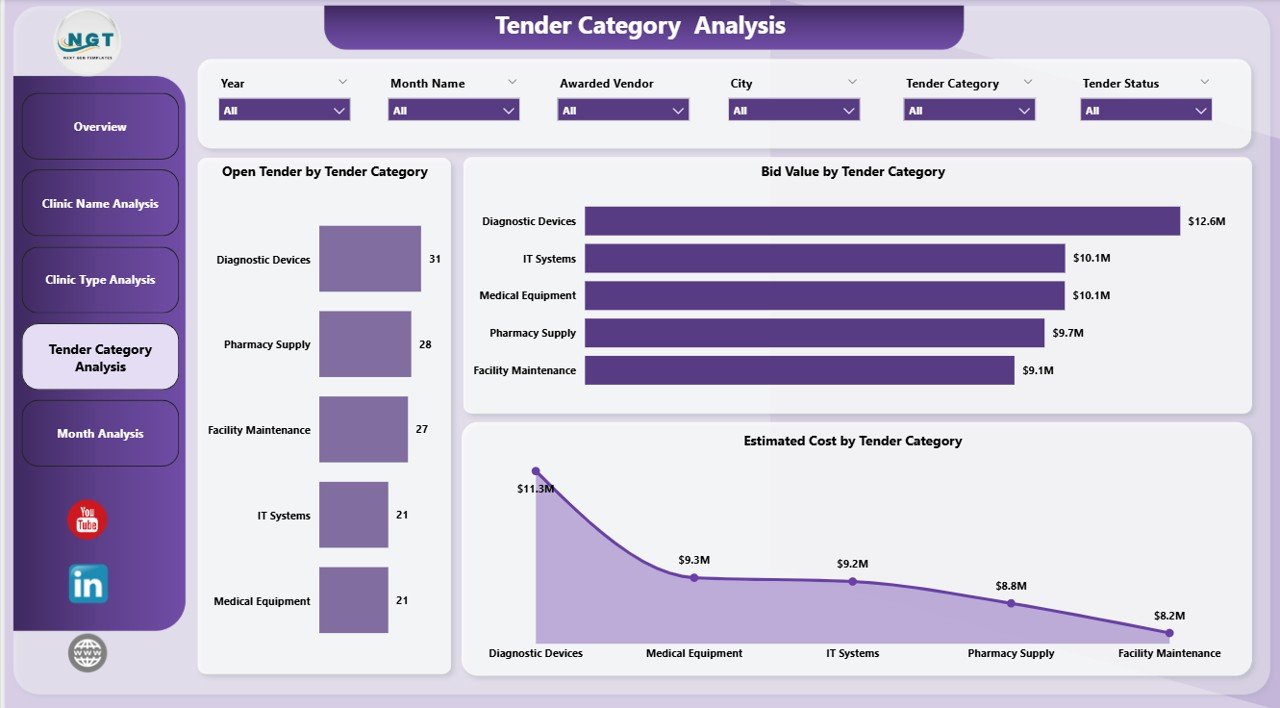
The Tender Category Analysis Page focuses on understanding tender behavior by category. This page helps procurement teams monitor category-wise performance.
Key Charts on Tender Category Analysis Page
-
Open Tender by Tender Category
This chart highlights which categories have more pending tenders. -
Bid Value by Tender Category
This visual shows financial exposure by tender category. -
Estimated Tender Cost by Category
This chart compares estimated costs across categories.
Therefore, clinics can optimize vendor strategies and control costs more effectively.
How Does Monthly Trends Analysis Support Better Planning?
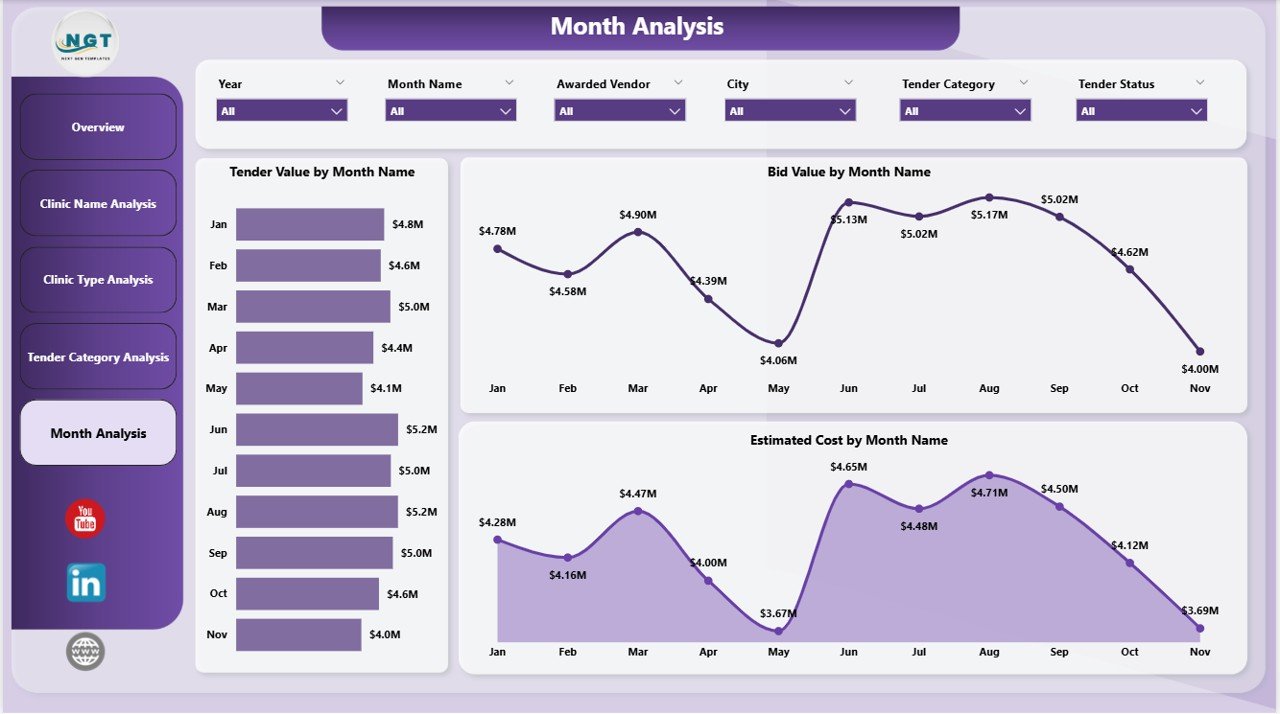
The Monthly Trends Page provides a time-based analysis of tender activity. This page helps identify seasonal patterns and workload fluctuations.
Key Charts on Monthly Trends Page
-
Tender Value by Month
This chart shows how tender values change over time. -
Bid Value by Month
This visual tracks bidding trends month by month. -
Estimated Cost by Month
This chart highlights projected cost trends over time.
As a result, clinics can plan budgets and resources proactively.
Advantages of Clinic Tender Dashboard in Power BI
Using a Clinic Tender Dashboard in Power BI delivers multiple business benefits.
Key Advantages
-
✅ Centralized tender monitoring in one dashboard
-
✅ Real-time visibility into tender performance
-
✅ Faster and more confident decision-making
-
✅ Reduced dependency on manual reports
-
✅ Easy comparison across clinics and categories
-
✅ Improved compliance and audit readiness
Therefore, clinics gain control, clarity, and consistency.
Click to Purchases Clinic Tender Dashboard in Power BI
Opportunities for Improvement in Clinic Tender Dashboards
Even a well-designed dashboard can improve continuously. Here are some enhancement opportunities:
-
🔹 Add vendor performance analysis
-
🔹 Include tender lifecycle tracking
-
🔹 Integrate approval timelines
-
🔹 Add win–loss analysis
-
🔹 Enable automated alerts for overdue tenders
These improvements increase analytical depth and strategic value.
Best Practices for the Clinic Tender Dashboard in Power BI
Following best practices ensures long-term success and usability.
Best Practices to Follow
-
✔ Maintain clean and standardized tender data
-
✔ Use consistent naming for clinics and categories
-
✔ Design user-friendly slicers and filters
-
✔ Update data regularly to ensure accuracy
-
✔ Limit clutter and focus on actionable visuals
-
✔ Train users on interpreting dashboard insights
As a result, the dashboard remains reliable and impactful.
Who Can Benefit from a Clinic Tender Dashboard in Power BI?
This dashboard supports multiple stakeholders within a healthcare organization.
Key Beneficiaries
-
🏥 Clinic administrators
-
📊 Procurement teams
-
💼 Finance and budgeting teams
-
🧾 Compliance and audit teams
-
👨⚕️ Senior management and leadership
Each group gains insights tailored to their role.
How Does This Dashboard Support Decision-Making?
The Clinic Tender Dashboard in Power BI supports decision-making by:
-
Highlighting high-value tenders instantly
-
Identifying cost-heavy clinics and categories
-
Tracking open and delayed tenders
-
Comparing performance across time periods
Therefore, leaders act faster and reduce financial risk.
How Can Clinics Use This Dashboard for Strategic Planning?
Clinics can use this dashboard to:
-
Plan annual procurement budgets
-
Optimize tender categories
-
Monitor expansion-related tender activity
-
Improve vendor negotiation strategies
As a result, procurement becomes proactive instead of reactive.
Conclusion: Why Clinic Tender Dashboard in Power BI Is a Must-Have Tool
A Clinic Tender Dashboard in Power BI transforms complex tender data into clear, interactive, and actionable insights. Instead of relying on static reports, clinics gain real-time visibility into tender values, bids, costs, and trends.
Moreover, the structured five-page design ensures detailed analysis without confusion. As a result, clinics improve transparency, efficiency, and financial control.
In today’s data-driven healthcare environment, adopting a Clinic Tender Dashboard in Power BI is no longer optional. It is essential.
Frequently Asked Questions (FAQs)
What is a Clinic Tender Dashboard in Power BI used for?
A Clinic Tender Dashboard in Power BI helps clinics track tender values, bid status, estimated costs, and performance trends from a centralized dashboard.
Can this dashboard handle multiple clinics?
Yes, the dashboard supports clinic-wise and clinic-type analysis, making it ideal for multi-location healthcare organizations.
Is Power BI suitable for non-technical users?
Yes, Power BI offers an intuitive interface with slicers and visuals that non-technical users can easily understand.
Can clinics customize this dashboard?
Yes, clinics can customize charts, KPIs, and filters based on their tender process and reporting needs.
How often should the dashboard data be updated?
Clinics should update data daily or weekly to ensure accurate and timely insights.
Does this dashboard support decision-making?
Absolutely. The dashboard highlights key metrics and trends that help management make faster, data-driven decisions.
Visit our YouTube channel to learn step-by-step video tutorials