The comic books and publishing industry continues to evolve at a rapid pace. While creativity remains at the heart of comic creation, publishers now rely heavily on data to control costs, improve timelines, increase profitability, and understand reader demand. However, managing production schedules, sales channels, genres, formats, and revenue using scattered Excel sheets often creates confusion instead of clarity.
That is exactly where a Comic Books and Publishing Dashboard in Excel becomes a game-changer.
This ready-to-use dashboard transforms raw publishing data into meaningful insights. It allows publishers, editors, finance teams, and production managers to track performance visually, identify delays early, and make faster business decisions. In this detailed article, you will learn what a Comic Books and Publishing Dashboard in Excel is, how it works, why it is important, its dashboard pages, key features, advantages, best practices, and frequently asked questions.
Click to Purchases Comic Books and Publishing Dashboard in Excel
By the end of this article, you will clearly understand how this dashboard helps comic publishers run smarter, faster, and more profitable operations.
What Is a Comic Books and Publishing Dashboard in Excel?
A Comic Books and Publishing Dashboard in Excel is an interactive reporting and analytics tool designed specifically for comic book publishers and publishing houses. It consolidates production, sales, cost, and revenue data into a single Excel file with dynamic visuals, slicers, and KPIs.
Instead of manually checking multiple spreadsheets, publishers use this dashboard to:
-
Monitor publishing performance at a glance
-
Track production delays and bottlenecks
-
Analyze revenue and profit by sales channel
-
Compare performance across genres and formats
-
Review monthly trends for revenue, cost, and profit
Moreover, because the dashboard runs entirely in Excel, it requires no complex software or advanced technical skills.
Why Do Comic Publishers Need a Dashboard in Excel?
Comic publishing involves multiple moving parts. Writers, illustrators, printers, distributors, and retailers all influence timelines and profitability. Therefore, without structured reporting, teams struggle to answer critical questions.
A Comic Books and Publishing Dashboard in Excel helps publishers answer questions such as:
-
Which sales channel generates the highest profit?
-
Which genre delivers the best profit margin?
-
How much revenue comes from print versus digital formats?
-
Where do publishing delays occur most often?
-
How does monthly performance change over time?
As a result, publishers gain control over both creative and commercial aspects of their business.
Click to Purchases Comic Books and Publishing Dashboard in Excel
How Does a Comic Books and Publishing Dashboard in Excel Work?
The dashboard works by connecting structured data from a backend Data Sheet to pivot tables, pivot charts, and interactive slicers. Each page focuses on a specific area of analysis, while a Page Navigator allows smooth movement between pages.
Here is how it works step by step:
-
You enter or update data in the Data Sheet
-
Pivot tables summarize the data automatically
-
Pivot charts visualize performance metrics
-
Slicers filter data by month, channel, genre, or format
-
KPI cards highlight key performance numbers
Because everything updates dynamically, decision-makers always see the latest insights.
Key Features of the Comic Books and Publishing Dashboard in Excel
This dashboard includes several powerful yet easy-to-use features that improve usability and insight.
Page Navigator for Easy Navigation
The Page Navigator, located on the left side, allows users to move between different dashboard pages instantly. Instead of scrolling or searching through tabs, users can jump directly to the required analysis page.
Right-Side Slicers for Interactive Filtering
Each analytical page includes slicers on the right side. These slicers allow users to filter data by time period or category, ensuring focused and relevant analysis.
KPI Cards for Quick Insights
KPI cards display key metrics such as profit, revenue, and delayed publishing percentages. These cards provide instant clarity before users dive into charts.
Pivot Chart-Based Design
All charts use pivot tables and pivot charts. As a result, users can refresh data easily and customize views without breaking formulas.
Dashboard Pages Explained in Detail
The Comic Books and Publishing Dashboard in Excel includes five analytical pages, each designed to answer specific business questions.
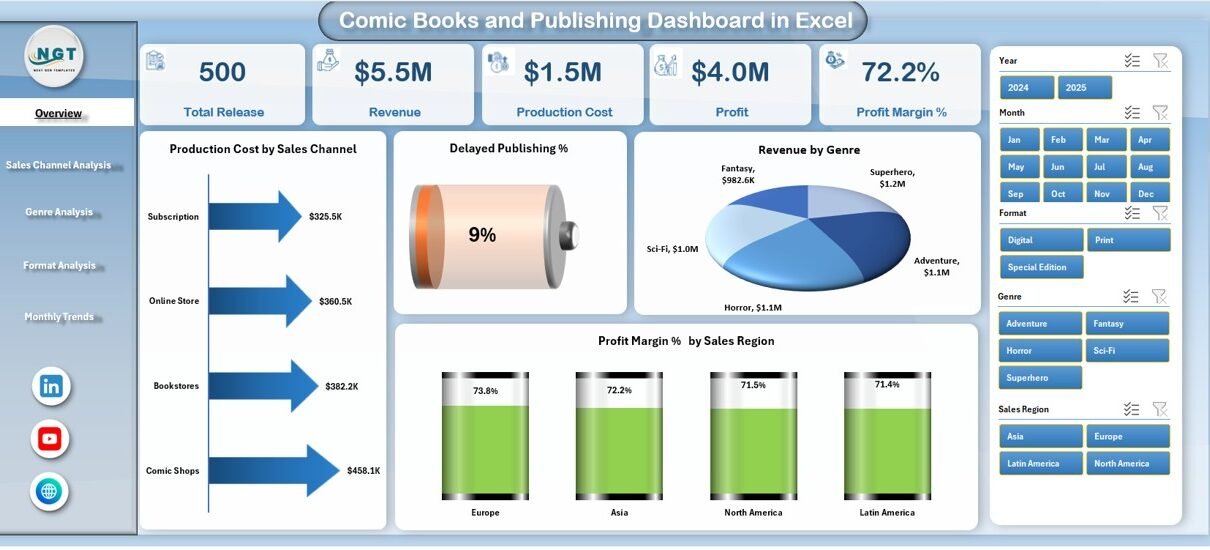
What Insights Does the Overview Page Provide?

The Overview Page serves as the main landing page of the dashboard. It delivers a high-level snapshot of overall publishing performance.
Overview Page Layout and Components
-
Right-side slicer for quick filtering
-
Four KPI cards for headline metrics
-
Four key charts for broad analysis
Charts on the Overview Page
Production Content by Sales Channel
This chart shows how much publishing output flows through different sales channels. As a result, publishers understand where production efforts concentrate most.
Delayed Publishing %
This chart highlights the percentage of delayed publications. Therefore, teams can identify scheduling issues early and take corrective action.
Revenue by Genre
This visualization compares revenue across comic genres. Consequently, publishers can focus more on high-performing genres.
Profit Margin % by Sales Region
This chart displays profit margin percentages by region. Thus, publishers can adjust pricing and distribution strategies region-wise.
How Does Sales Channel Analysis Improve Decision-Making?

The Sales Channel Analysis page dives deeper into channel-level performance. It helps publishers compare online platforms, retail stores, subscriptions, and distributors.
Charts on the Sales Channel Analysis Page
Click to Purchases Comic Books and Publishing Dashboard in Excel
Revenue by Sales Channel
This chart shows which channels generate the most revenue. As a result, marketing efforts can focus on top-performing channels.
Profit by Sales Channel
This chart reveals actual profit instead of just revenue. Therefore, publishers avoid over-investing in low-margin channels.
Profit Margin % by Sales Channel
This visualization compares profitability efficiency across channels. Consequently, teams can renegotiate contracts or optimize pricing.
In-Production Publishing by Sales Channel
This chart tracks ongoing publishing projects by channel. Hence, publishers balance workload across channels.
Why Is Genre Analysis Critical for Comic Publishers?

Different comic genres attract different audiences. Therefore, understanding genre-wise performance becomes essential.
The Genre Analysis page helps publishers evaluate which genres deserve more investment.
Charts on the Genre Analysis Page
Profit by Genre
This chart compares profits across genres such as superhero, fantasy, manga, or graphic novels. As a result, publishers prioritize high-return genres.
Production Cost by Genre
This chart tracks how much it costs to produce content by genre. Therefore, teams manage budgets more effectively.
Profit Margin % by Genre
This visualization highlights which genres generate the best margins. Consequently, publishers align creative strategy with financial goals.
Delayed Publishing by Genre
This chart shows delays by genre. Thus, publishers can identify workflow issues specific to certain content types.
How Does Format Analysis Help Publishing Strategy?

Comic books now appear in multiple formats, including print, digital, and special editions. The Format Analysis page helps publishers understand performance across formats.
Charts on the Format Analysis Page
Profit by Format
This chart compares profit between formats. As a result, publishers see whether digital or print delivers better returns.
Production Cost by Format
This visualization shows cost differences by format. Therefore, teams optimize production planning.
Profit Margin % by Format
This chart reveals margin efficiency by format. Consequently, publishers refine pricing strategies.
Revenue by Format
This chart compares revenue contribution by format. Hence, publishers invest in the most profitable distribution methods.
Click to Purchases Comic Books and Publishing Dashboard in Excel
What Can Publishers Learn from Month Analysis?

Publishing performance changes over time due to seasonality, launches, and promotions. The Month Analysis page tracks trends across months.
Charts on the Month Analysis Page
Profit by Month
This chart shows monthly profit trends. As a result, publishers identify peak and slow periods.
Production Cost by Month
This visualization tracks monthly cost fluctuations. Therefore, teams control spending during high-cost periods.
Revenue by Month
This chart highlights monthly revenue movement. Consequently, publishers plan campaigns around high-revenue months.
What Is the Role of the Data Sheet and Support Sheet?
Data Sheet
The Data Sheet acts as the backend of the dashboard. It stores all publishing data, including:
-
Sales channels
-
Genres
-
Formats
-
Production costs
-
Revenue
-
Profit
-
Publishing timelines
Users only need to update this sheet to refresh the entire dashboard.
Support Sheet
The Support Sheet contains helper tables, mappings, or calculations required for smooth dashboard functionality. It ensures clean data flow and accurate reporting.
Advantages of Comic Books and Publishing Dashboard in Excel
Using this dashboard offers several practical advantages for publishers.
-
Improves visibility across publishing operations
-
Reduces manual reporting effort
-
Identifies delays before they escalate
-
Supports data-driven decision-making
-
Enhances profit and cost control
-
Works fully within Excel
-
Requires no coding or external tools
Because of these benefits, publishers gain both creative freedom and financial clarity.
Best Practices for the Comic Books and Publishing Dashboard in Excel
Click to Purchases Comic Books and Publishing Dashboard in Excel
To get maximum value from the dashboard, publishers should follow these best practices.
Keep Data Clean and Consistent
Always use standardized naming for genres, formats, and channels. Clean data ensures accurate insights.
Update Data Regularly
Update the Data Sheet frequently to keep reports current and reliable.
Use Slicers for Focused Analysis
Apply slicers instead of manual filtering to maintain dashboard integrity.
Review Delayed Publishing Metrics Weekly
Frequent review helps teams fix production issues early.
Align Dashboard KPIs with Business Goals
Customize KPIs based on strategic priorities such as growth, profitability, or speed.
Who Should Use a Comic Books and Publishing Dashboard in Excel?
This dashboard suits multiple roles within the publishing ecosystem.
-
Comic publishers and studio owners
-
Production managers
-
Finance and accounting teams
-
Sales and distribution managers
-
Editorial leadership teams
Because of its simplicity, both technical and non-technical users can benefit.
Conclusion: Why a Comic Books and Publishing Dashboard in Excel Matters
The comic books and publishing industry thrives on creativity, but sustainability depends on data-driven decisions. A Comic Books and Publishing Dashboard in Excel bridges the gap between creative vision and business performance.
By consolidating production, sales, cost, and revenue data into one interactive dashboard, publishers gain clarity, speed, and confidence. Moreover, the Excel-based design ensures accessibility, flexibility, and ease of use.
In today’s competitive publishing landscape, this dashboard is not just a reporting tool—it is a strategic advantage.
Frequently Asked Questions About Comic Books and Publishing Dashboard in Excel
What is the main purpose of a Comic Books and Publishing Dashboard in Excel?
The main purpose is to track publishing performance, control costs, analyze revenue, and monitor delays using interactive Excel visuals.
Can small comic publishers use this dashboard?
Yes, small and independent publishers can use it easily because it runs entirely in Excel.
Does the dashboard require advanced Excel skills?
No, basic Excel knowledge is sufficient to use and update the dashboard.
Can I customize charts and KPIs?
Yes, users can customize pivot charts, KPIs, and slicers based on business needs.
How often should data be updated?
Publishers should update data weekly or monthly for best results.
Does the dashboard support multiple formats and genres?
Yes, the dashboard supports analysis by sales channel, genre, format, region, and month.
Visit our YouTube channel to learn step-by-step video tutorials