Video game development is a fast-paced and highly complex process. Teams work across multiple platforms, development phases, and task types while managing deadlines, effort hours, and priorities. However, when studios rely on scattered spreadsheets or manual status updates, visibility suffers. As a result, delays increase, costs rise, and team productivity drops.
That is exactly where a Video Game Development Dashboard in Excel becomes essential.
This article explains what a Video Game Development Dashboard in Excel is, how it works, why development teams need it, its dashboard pages, key features, advantages, best practices, and frequently asked questions. By the end, you will clearly understand how this dashboard helps studios track progress, control effort, and deliver games on time.
Click to Purchases Video Game Development Dashboard in Excel
What Is a Video Game Development Dashboard in Excel?
A Video Game Development Dashboard in Excel is a ready-to-use, interactive reporting tool designed to monitor tasks, development phases, platforms, effort hours, and team performance in one place.
Instead of reviewing raw task lists or disconnected reports, development teams use this dashboard to:
-
Track completed and in-progress tasks
-
Compare planned effort versus actual effort
-
Monitor effort utilization and overrun hours
-
Analyze performance by platform, phase, task type, and month
-
Identify bottlenecks early and take corrective action
Because the dashboard runs entirely in Excel, teams can update data easily without coding or external tools. Moreover, managers gain instant insights with visuals instead of long tables.
Why Do Game Development Teams Need a Dashboard in Excel?
Game development involves designers, developers, artists, testers, and producers working together. Therefore, without centralized tracking, coordination becomes difficult.
A Video Game Development Dashboard in Excel helps because:
-
It creates a single source of truth for project data
-
It improves visibility across teams and phases
-
It reduces time spent on manual reporting
-
It supports data-driven decisions
-
It highlights risks before they affect release timelines
As a result, teams stay aligned, productive, and focused on delivery.
How Does a Video Game Development Dashboard in Excel Work?
The dashboard connects structured task and effort data with Excel visuals. Once users update the data sheet, all charts and metrics refresh automatically.
Core Working Flow
-
Team members update task details and effort hours
-
Data flows into the dashboard calculations
-
Visuals update instantly based on slicer selections
-
Managers analyze performance and take action
Because of this workflow, the dashboard stays dynamic and reliable.
Key Features of the Video Game Development Dashboard in Excel
This ready-to-use dashboard includes five analytical pages, each designed for a specific analysis purpose. Additionally, a Page Navigator improves usability and navigation.
What Is the Page Navigator and Why Is It Important?
The Page Navigator, located on the left side of the dashboard, allows users to move quickly between analytical pages.
Benefits of the Page Navigator
-
Saves time while switching pages
-
Improves user experience
-
Makes the dashboard intuitive for non-technical users
-
Reduces navigation errors
As a result, stakeholders can focus on insights instead of navigation.
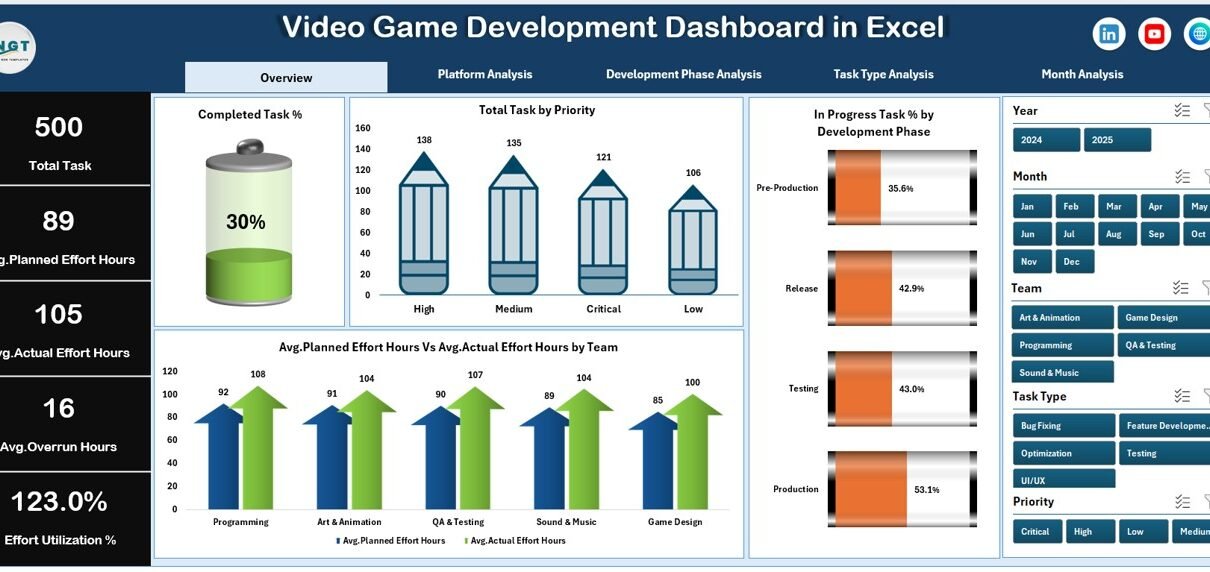
What Does the Overview Page Show in the Dashboard?
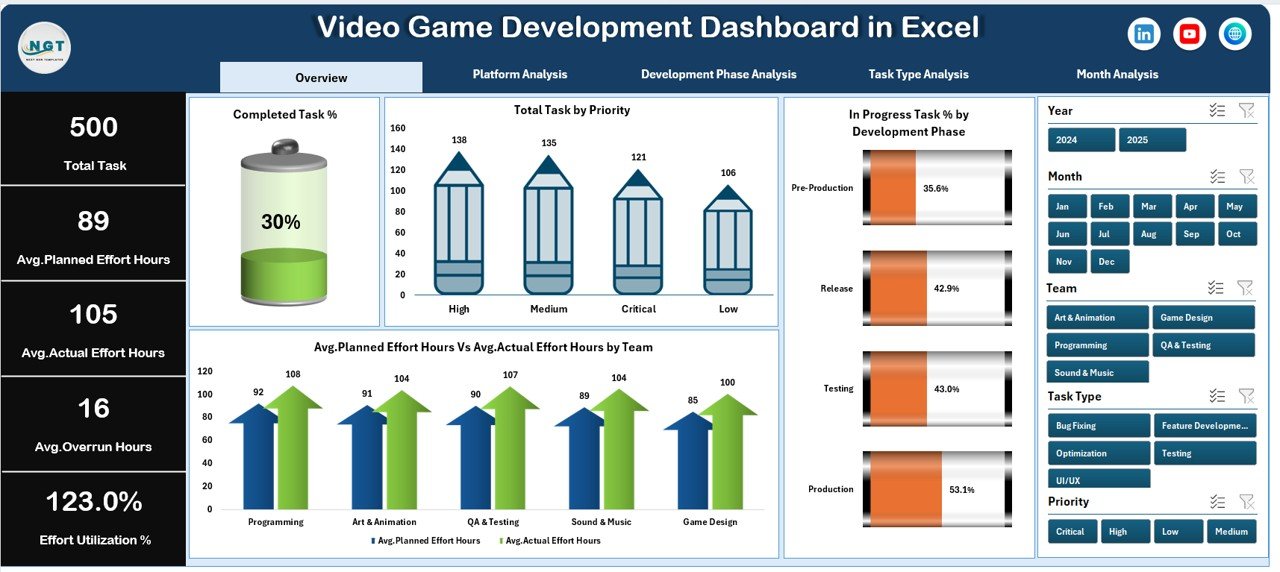
The Overview Page serves as the main landing page of the Video Game Development Dashboard in Excel.
Key Elements of the Overview Page
-
Right-side slicer for filtering data
-
Four KPI cards for quick metrics
-
Four high-level charts for performance overview
KPI Cards on the Overview Page
-
Total Tasks
-
Completed Task Percentage
-
In-Progress Task Percentage
-
Overall Effort Summary
Charts Included on the Overview Page
-
Completed Task %
-
Total Tasks by Priority
-
In-Progress Task % by Development Phase
-
Average Planned Effort Hours vs Average Actual Effort Hours by Team
This page helps project managers understand overall project health within seconds.
How Does the Platform Analysis Page Help Game Studios?
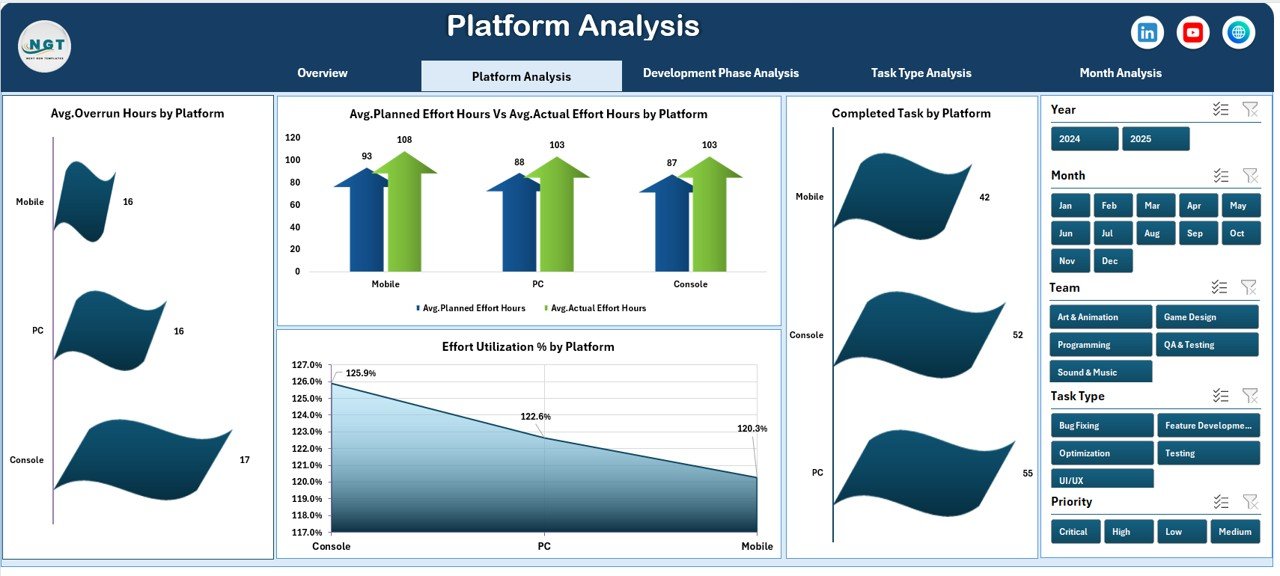
Modern video games often launch across multiple platforms. Therefore, platform-wise analysis becomes critical.
The Platform Analysis Page focuses on performance by gaming platform.
Key Features of Platform Analysis Page
-
Right-side slicer for dynamic filtering
-
Four platform-focused charts
Charts on the Platform Analysis Page
-
Completed Tasks by Platform
-
Development Phase and Avg. Planned vs Avg. Actual Effort Hours by Platform
-
Average Overrun Hours by Platform
-
Effort Utilization % by Platform
With this page, studios can identify which platforms consume more effort or experience delays.
Click to Purchases Video Game Development Dashboard in Excel
What Insights Does the Development Phase Analysis Page Provide?
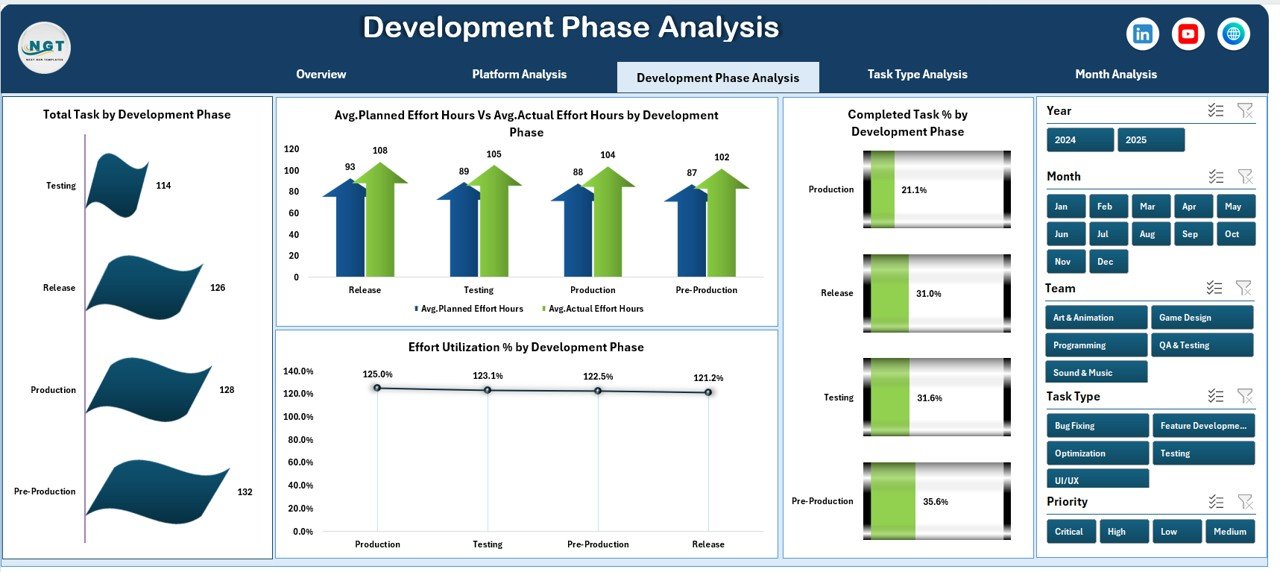
Game development follows structured phases such as design, development, testing, and deployment. The Development Phase Analysis Page tracks performance across these stages.
Key Highlights of Development Phase Analysis Page
-
Right-side slicer for flexible analysis
-
Four detailed phase-based charts
Charts Included
-
Completed Tasks by Development Phase
-
Avg. Planned vs Avg. Actual Effort Hours by Development Phase
-
Effort Utilization % by Development Phase
-
Total Tasks by Development Phase
This page helps managers detect phase-level bottlenecks early.
Why Is Task Type Analysis Important in Game Development?
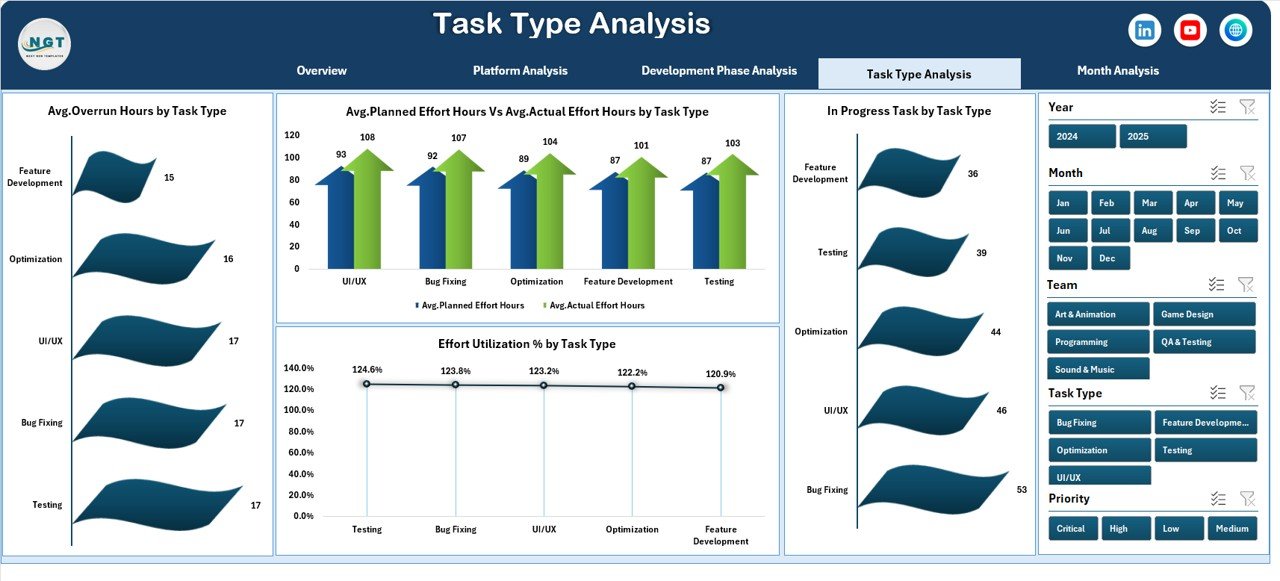
Not all tasks are equal. Design, coding, testing, and bug fixing require different effort levels. The Task Type Analysis Page provides clarity.
Key Elements of Task Type Analysis Page
-
Right-side slicer for focused insights
-
Four task-centric charts
Charts on Task Type Analysis Page
-
Avg. Planned vs Avg. Actual Effort Hours by Task Type
-
Effort Utilization % by Task Type
-
Total Tasks by Task Type
-
In-Progress Tasks by Task Type
As a result, teams can balance workload effectively.
What Does the Month Analysis Page Show?
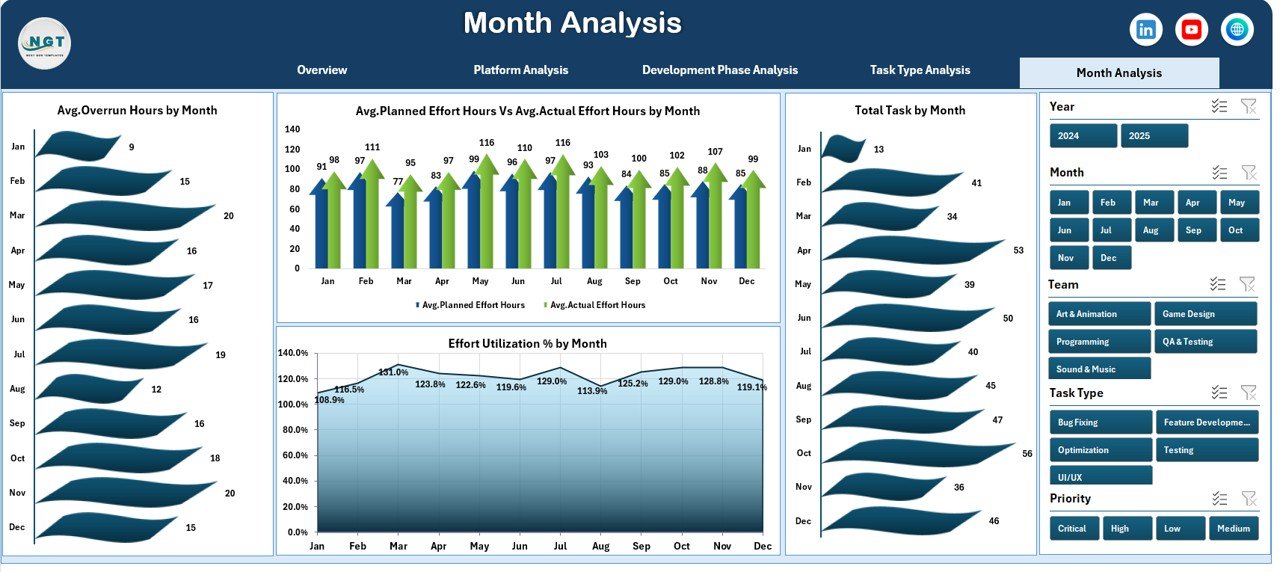
Game development projects run across months. Therefore, time-based analysis becomes essential.
The Month Analysis Page tracks performance trends over time.
Charts on the Month Analysis Page
-
Avg. Planned vs Avg. Actual Effort Hours by Month
-
Effort Utilization % by Month
-
Total Tasks by Month
-
Avg. Overrun Hours by Month
This page supports timeline planning and future forecasting.
What Is the Role of the Data Sheet and Support Sheet?
Data Sheet
The Data Sheet stores all raw task, platform, phase, effort, and timeline data. Users update this sheet regularly.
Support Sheet
The Support Sheet contains helper calculations, lookup tables, and backend logic required for dashboard performance.
Together, these sheets ensure accurate reporting and smooth dashboard operation.
Advantages of Video Game Development Dashboard in Excel
Using a Video Game Development Dashboard in Excel offers several advantages.
Key Advantages
-
Centralized project tracking
-
Real-time effort comparison
-
Clear visualization of progress
-
Improved team accountability
-
Faster decision-making
-
Reduced reporting effort
-
Easy customization
-
No dependency on advanced tools
Because of these advantages, studios gain full control over development performance.
How Does This Dashboard Improve Decision-Making?
Click to Purchases Video Game Development Dashboard in Excel
This dashboard transforms raw data into actionable insights.
Decision-Making Improvements
-
Managers identify delays early
-
Teams adjust workloads proactively
-
Leads allocate resources efficiently
-
Stakeholders track progress transparently
As a result, projects stay on schedule and within budget.
Who Should Use a Video Game Development Dashboard in Excel?
This dashboard suits a wide range of users.
Ideal Users
-
Game project managers
-
Development leads
-
Producers
-
QA managers
-
Indie game studios
-
Large development teams
Because Excel is widely available, teams can adopt it instantly.
Best Practices for the Video Game Development Dashboard in Excel
To get maximum value, teams should follow best practices.
Best Practices
-
Update data regularly
-
Standardize task naming
-
Track effort consistently
-
Use slicers wisely
-
Review dashboard weekly
-
Compare planned vs actual often
-
Share insights with teams
-
Archive historical data monthly
Following these practices ensures reliable and meaningful insights.
How to Keep the Dashboard Accurate and Reliable?
Accuracy depends on data discipline.
Tips for Accuracy
-
Avoid manual overrides in formulas
-
Validate effort entries
-
Lock calculation cells
-
Use data validation rules
-
Review anomalies immediately
As a result, decision-makers trust the dashboard outputs.
Conclusion
A Video Game Development Dashboard in Excel provides a powerful, simple, and effective way to manage complex game projects. Instead of juggling multiple reports, teams gain a centralized, visual, and interactive solution.
With five analytical pages, dynamic slicers, effort comparisons, and platform-wise insights, this dashboard supports better planning, faster execution, and smarter decisions. Moreover, because it runs in Excel, teams can deploy it quickly without technical barriers.
If your studio wants better visibility, improved efficiency, and timely delivery, this dashboard becomes an essential project management asset.
Frequently Asked Questions About Video Game Development Dashboard in Excel
What is a Video Game Development Dashboard in Excel used for?
It tracks tasks, effort hours, platforms, development phases, and timelines in one interactive Excel dashboard.
Can beginners use this dashboard easily?
Yes, the dashboard uses simple slicers and visuals, making it easy for non-technical users.
Does the dashboard update automatically?
Yes, once users update the data sheet, all visuals refresh automatically.
Can teams customize the dashboard?
Yes, teams can add new charts, metrics, or filters based on project needs.
Is Excel suitable for large game projects?
Yes, Excel works well for small to mid-sized projects and early-stage planning.
Does this dashboard help reduce development delays?
Yes, it highlights bottlenecks early, allowing teams to act before delays escalate.
Visit our YouTube channel to learn step-by-step video tutorials