In today’s dynamic business world, compliance is more than a checkbox — it is a vital component of corporate responsibility, governance, and risk management. Organizations must ensure that their internal policies, processes, and operations align with industry regulations, ethical practices, and legal standards.
However, tracking compliance across multiple departments, locations, and business units can quickly become overwhelming when done manually. That’s where the Compliance Dashboard in Power BI steps in.
Click to Purchases Compliance Dashboard in Power BI
This interactive, data-driven solution transforms complex compliance data into clear visuals and actionable insights. It helps management teams monitor progress, identify risks, and improve adherence to internal and external standards — all in one place.
What Is a Compliance Dashboard in Power BI?
A Compliance Dashboard in Power BI is an advanced analytics and visualization tool designed to help organizations monitor, analyze, and manage their compliance performance.
Built using Microsoft Power BI and connected to an Excel dataset, this dashboard consolidates compliance checks, review statuses, risk ratings, and performance indicators into easy-to-read charts and metrics.
Users can interact with filters, slicers, and drill-through views to explore the data from various perspectives — by department, compliance area, or location. This transparency not only simplifies reporting but also empowers decision-makers to act quickly on deviations or non-compliant trends.
Key Features of the Compliance Dashboard in Power BI
The dashboard file includes five main analytical pages, each serving a unique purpose in compliance monitoring.
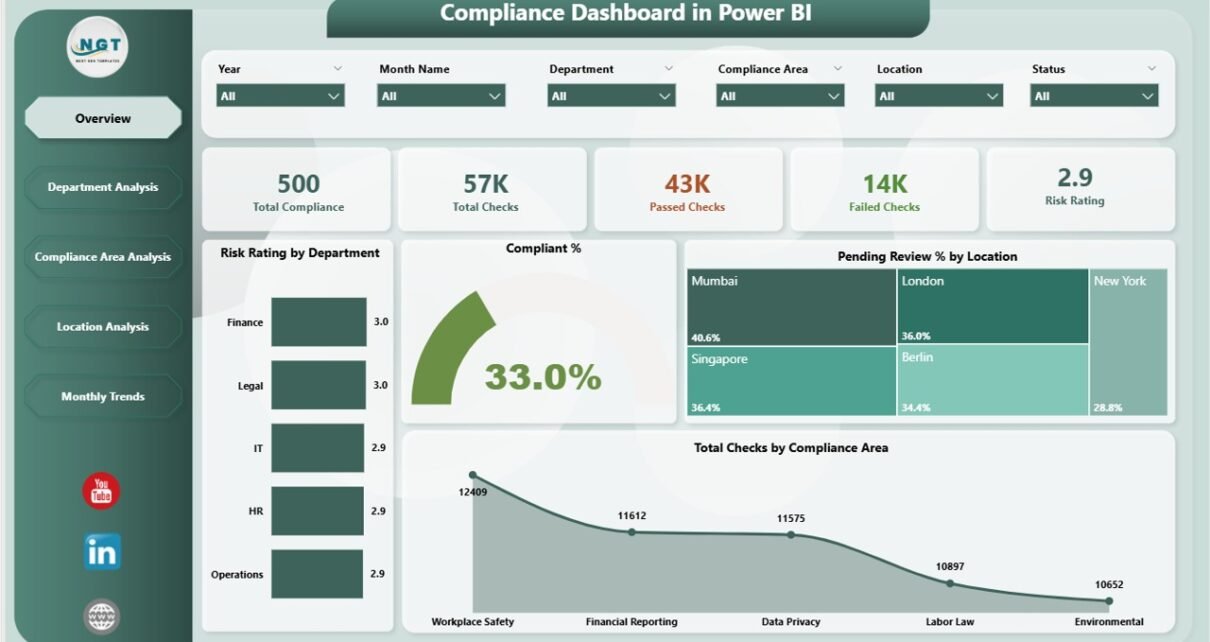
1️⃣ Overview Page
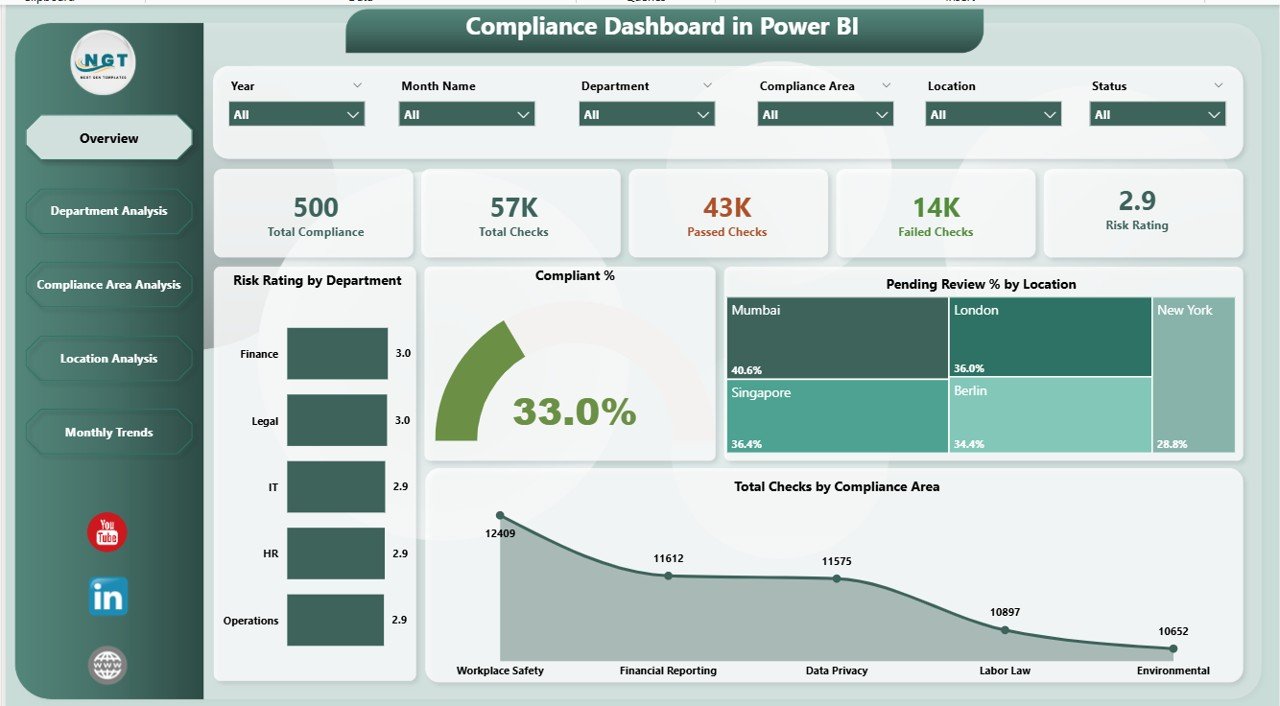
This is the main landing page of the dashboard.
It provides a high-level snapshot of overall compliance performance.
Click to Purchases Compliance Dashboard in Power BI
Highlights include:
-
Five KPI Cards displaying totals and key compliance metrics.
Charts:
- Risk Rating by Department – understand which departments face higher risks.
- Completed % – track how many compliance checks are finalized.
- Pending Review % by Location – identify review backlogs across sites.
- Total Checks by Completed Area – monitor overall audit coverage.
The Overview Page instantly answers the question: “Are we compliant across the organization today?”
2️⃣ Department Analysis Page

This page dives deeper into departmental performance.
Visual elements:
-
Total Compliance by Department – compare how departments perform against each other.
-
Pending Review % by Department – see where reviews are lagging.
-
Total Compliance by Department – gain insight into completion patterns.
With slicers and filters, users can quickly spot which departments require attention and allocate resources efficiently.
3️⃣ Compliance Area Analysis Page

This section focuses on specific compliance areas such as data security, financial controls, or environmental standards.
Charts available:
-
Risk Rating by Compliance Area – evaluate which areas carry the highest risks.
-
Failed Checks by Compliance Area – pinpoint where processes need improvement.
-
Compliant % by Compliance Area – track progress toward full adherence.
Managers can analyze compliance performance area-wise and implement preventive measures before issues escalate.
4️⃣ Location Analysis Page

When organizations operate across multiple branches or countries, consistency in compliance becomes critical.
Visuals in this section:
-
Risk Rating by Location – compare the overall risk score across branches.
-
Compliant % by Location – understand how effectively each site meets standards.
-
Passed Checks by Location – measure regional success rates.
This view enables leadership to benchmark locations, reward compliant units, and guide underperforming ones.
5️⃣ Monthly Trends Page
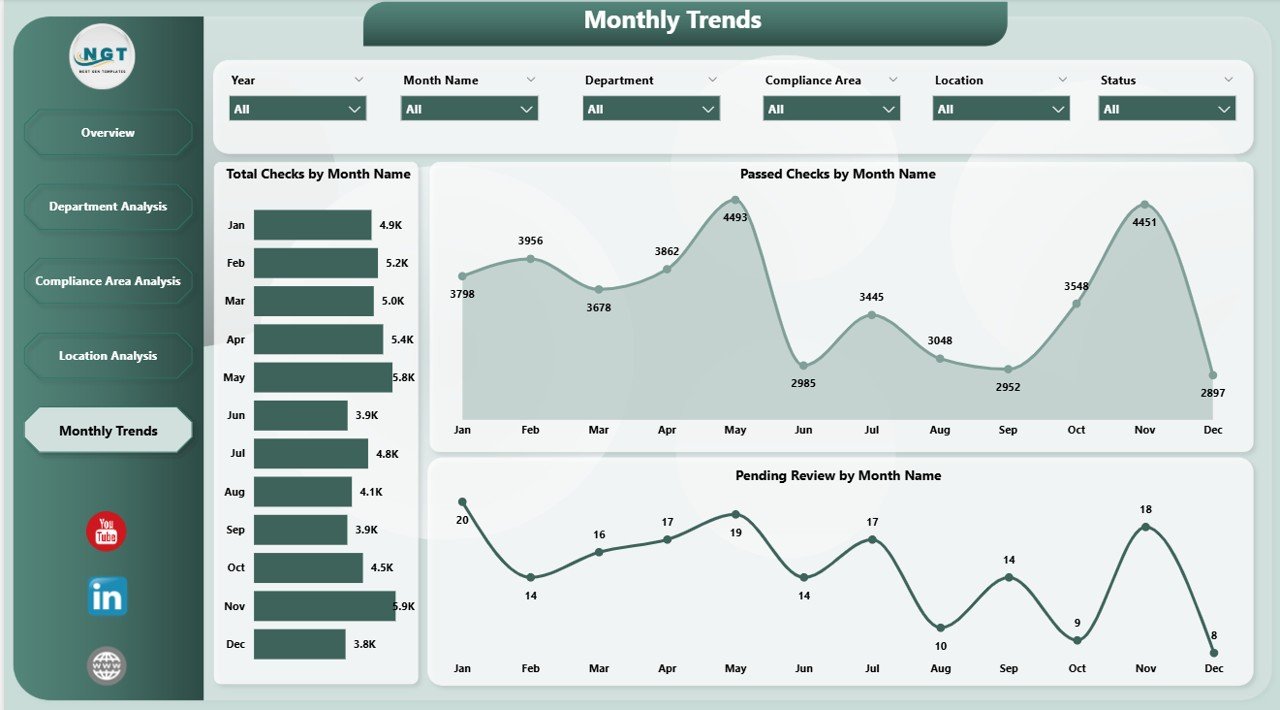
This is the final and one of the most insightful pages. It displays Total Checks by Month to help monitor trends over time.
By tracking month-on-month compliance performance, managers can:
-
Identify seasonal patterns or recurring issues.
-
Evaluate the effectiveness of compliance initiatives.
-
Forecast future compliance status.
The trends page supports proactive planning rather than reactive management.
Click to Purchases Compliance Dashboard in Power BI
⚙️ How the Compliance Dashboard Works
-
Data Collection: Compliance data — such as audit findings, checklists, and risk assessments — is recorded in an Excel file.
-
Integration: Power BI connects directly to this Excel source using Power Query.
-
Data Transformation: Data is cleaned, formatted, and standardized for consistency.
-
Visualization: Interactive visuals such as bar charts, pie charts, and cards are created to display KPIs.
-
Automation: Once configured, the dashboard refreshes automatically whenever new data is added.
This seamless process ensures that stakeholders always view the most current compliance information without manual updates.
💡 Why Your Organization Needs a Compliance Dashboard
Monitoring compliance manually can lead to inefficiencies, data silos, and delayed reporting. A Power BI dashboard addresses these issues by offering:
-
Centralized Data View: All compliance information in one place.
-
Real-Time Monitoring: Track progress live as new audits or checks occur.
-
Transparency: Clear accountability for each department or location.
-
Early Risk Detection: Visual alerts for deviations from standards.
-
Actionable Insights: Data-driven decision-making for continuous improvement.
🧭 Advantages of Using a Compliance Dashboard in Power BI
Implementing a Power BI-based compliance dashboard brings several tangible benefits:
✅ 1. Improved Visibility
All stakeholders can access compliance insights instantly without digging through reports or emails.
✅ 2. Faster Decision Making
Real-time visuals help leaders identify red flags and act before risks escalate.
✅ 3. Automation and Efficiency
Automated data refreshes remove manual reporting, saving countless hours.
✅ 4. Enhanced Accountability
Each department’s results are transparent, promoting responsibility and compliance ownership.
✅ 5. Customizable Views
Users can personalize dashboards by selecting relevant filters, KPIs, or time periods.
✅ 6. Better Risk Management
Visual risk ratings and trend charts provide early warnings, allowing mitigation strategies.
🚀 How to Build a Compliance Dashboard in Power BI — Step by Step
If you want to create your own version, here’s a simple workflow:
-
Collect Compliance Data in Excel or any database.
-
Clean and Prepare the Data using Power Query Editor.
-
Define KPIs and Metrics like Completed %, Risk Rating, and Pending Reviews.
-
Design the Dashboard Layout:
-
Use cards for high-level metrics.
-
Add bar charts for departmental comparisons.
-
Create maps for location-based analysis.
-
-
Add Slicers and Filters for interactive navigation.
-
Apply Conditional Formatting to highlight risks with colors and icons.
-
Publish and Share the dashboard through Power BI Service for collaboration.
📊 Examples of Insights You Can Gain
A well-structured dashboard answers questions like:
-
Which departments have the highest compliance risk?
-
Where do we have the most pending reviews?
-
How do compliance scores vary month to month?
-
What percentage of checks have failed this quarter?
-
Which locations are performing best?
These insights transform the way compliance teams operate — from reactive reporting to predictive intelligence.
💼 Industries That Benefit from a Compliance Dashboard
The dashboard is versatile and valuable across various sectors:
-
Banking and Finance – Monitor regulatory compliance and audit results.
-
Healthcare – Track patient data privacy and safety compliance.
-
Manufacturing – Ensure safety and environmental standards.
-
Education – Maintain accreditation and policy adherence.
-
Retail and E-commerce – Audit vendor and product compliance.
-
IT and Cybersecurity – Monitor data security and GDPR compliance.
🧠 Best Practices for Using the Compliance Dashboard in Power BI
Follow these best practices to ensure consistent accuracy and reliability:
💡 1. Maintain Data Quality
Regularly update and validate data sources to avoid inconsistencies.
💡 2. Standardize KPI Definitions
Use uniform definitions and calculation methods for each metric.
💡 3. Enable Role-Based Access
Limit data visibility based on user roles to ensure confidentiality.
💡 4. Automate Data Refresh Schedules
Set automatic updates to reflect the latest audit results and review status.
💡 5. Include Drill-Down Options
Allow users to click through charts for detailed insights and root cause analysis.
💡 6. Visualize Trends
Always include time-based visuals to identify patterns or recurring issues.
💡 7. Provide Contextual Narratives
Add descriptions or text boxes explaining what each metric means.
💡 8. Regularly Review Compliance KPIs
Continuously align indicators with evolving regulations and business needs.
The Impact of a Compliance Dashboard on Business Performance
Implementing a compliance dashboard has a measurable impact on both efficiency and governance:
-
Reduced Reporting Time: From hours to minutes.
-
Higher Audit Accuracy: Thanks to centralized data validation.
-
Better Decision Making: Visual insights improve strategic choices.
-
Enhanced Culture of Accountability: Everyone owns their compliance score.
-
Long-Term Sustainability: Continuous monitoring prevents major compliance failures.
Conclusion
The Compliance Dashboard in Power BI is more than just a reporting tool — it is a strategic asset for maintaining transparency, ensuring accountability, and fostering a culture of compliance.
By integrating Excel data with Power BI’s powerful visualization capabilities, organizations can transform routine audits into valuable business intelligence. With pages dedicated to overview, departments, compliance areas, locations, and trends, every stakeholder gains the clarity they need to stay compliant and confident.
If your organization still relies on spreadsheets or static reports, now is the time to switch to a Power BI Compliance Dashboard and take control of your compliance landscape with real-time, actionable insights.
❓ Frequently Asked Questions (FAQs)
1️⃣ What is a Compliance Dashboard in Power BI?
It is an interactive Power BI tool that visualizes compliance data from Excel or other sources to monitor risk ratings, reviews, and adherence levels across departments and locations.
2️⃣ How does Power BI help in compliance management?
Power BI automates data collection, analyzes KPIs in real time, and creates visual alerts for non-compliance, helping teams take immediate action.
3️⃣ Can the dashboard be customized for different industries?
Yes, it can be tailored for finance, healthcare, education, manufacturing, and more by modifying KPIs and visuals to fit specific compliance frameworks.
4️⃣ Is Power BI better than Excel for compliance reporting?
Yes. While Excel handles data storage, Power BI adds automation, visualization, and interactive analysis, making reporting faster and more accurate.
5️⃣ How often should compliance data be updated?
Ideally daily or weekly. With Power BI scheduled refresh, the dashboard can stay updated automatically based on new audit entries.
6️⃣ Can multiple users view the dashboard simultaneously?
Absolutely. Once published to the Power BI Service, authorized users can access it anytime from web or mobile devices.
7️⃣ Does the dashboard support data security?
Yes, Power BI supports role-based access and data encryption to protect sensitive compliance information.
8️⃣ What skills are required to maintain the dashboard?
Basic knowledge of Power BI, Excel, and data refresh settings is sufficient to maintain and update the dashboard regularly.
Visit our YouTube channel to learn step-by-step video tutorials
Click to Purchases Compliance Dashboard in Power BI