Home>Blogs>Charts and Visualization>Conditional Formatting in a Lollipop Chart in Excel>CF in LP Chart-4
CF in LP Chart-4
23
Feb 2019
252Comments Off on CF in LP Chart-4
PK
Meet PK, the founder of PK-AnExcelExpert.com! With over 15 years of experience in Data Visualization, Excel Automation, and dashboard creation. PK is a Microsoft Certified Professional who has a passion for all things in Excel. PK loves to explore new and innovative ways to use Excel and is always eager to share his knowledge with others. With an eye for detail and a commitment to excellence, PK has become a go-to expert in the world of Excel. Whether you're looking to create stunning visualizations or streamline your workflow with automation, PK has the skills and expertise to help you succeed. Join the many satisfied clients who have benefited from PK's services and see how he can take your Excel skills to the next level!
https://www.pk-anexcelexpert.com
Related Articles
Street Lighting Services KPI Dashboard in Power BI
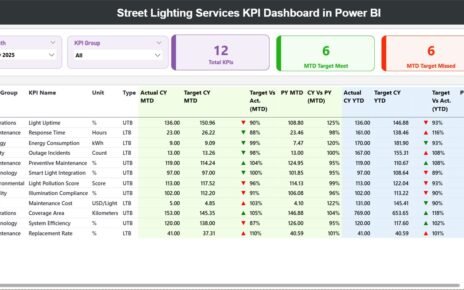
Street lighting services play a vital role in maintaining safe and functional urban environments. Well-managed lighting infrastructure improves road safety,
Consulting Dashboard in Power BI
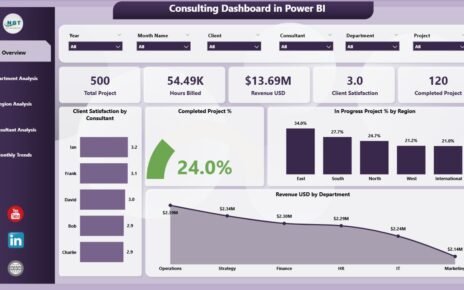
In today’s consulting world, data drives every decision. Whether you manage clients, projects, or performance metrics, the ability to visualize
Revenue Analysis Report in Excel
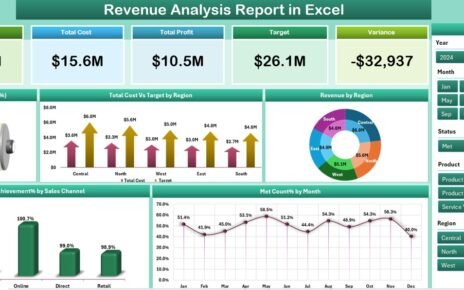
In today’s data-driven world, businesses must stay on top of their financial performance to remain competitive. Revenue is one of


