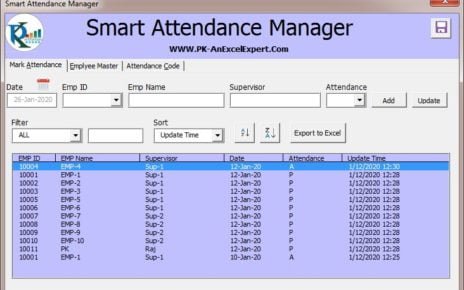
In this article, we have developed a Smart Attendance Manager in Excel Using VBA using VBA User forms. You can use
Excel, a powerful tool for data manipulation and analysis, has a range of functions and features, but one that stands
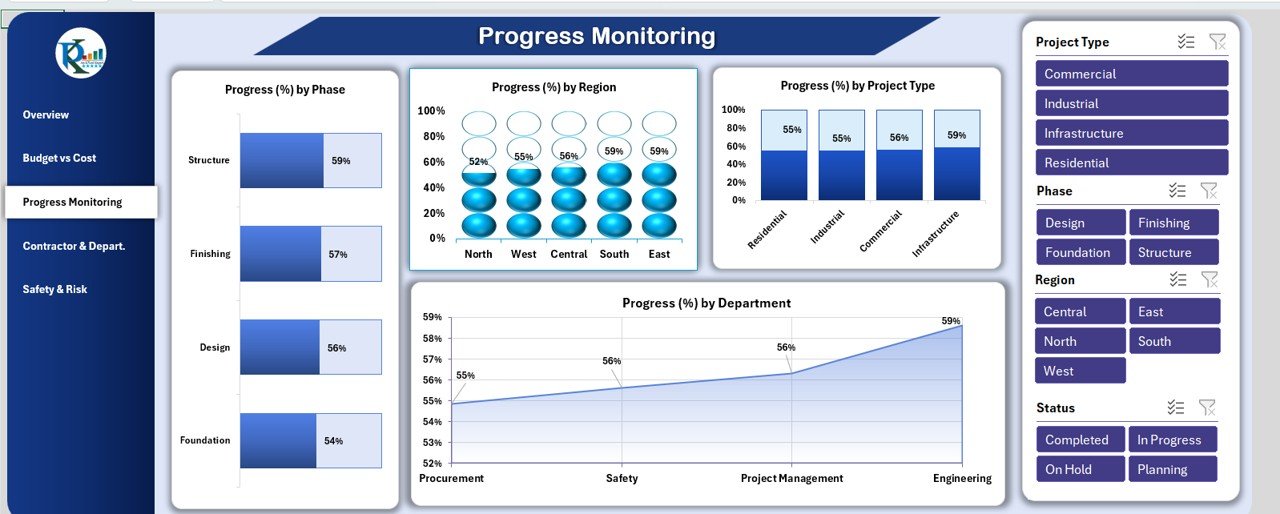
Inventory management plays a critical role in every organization that handles physical goods. Whether you operate a warehouse, retail store,