Contracts are the backbone of every organization. They define obligations, protect interests, and drive revenue. However, managing contracts without clear performance tracking often leads to missed deadlines, compliance risks, revenue leakage, and operational inefficiencies. When contract data remains scattered across emails, folders, or static spreadsheets, visibility drops and decision-making suffers.
That is exactly where a Contract Management KPI Dashboard in Excel becomes an essential solution.
This ready-to-use Excel dashboard helps organizations monitor, analyze, and control contract performance using structured KPIs. Instead of relying on manual tracking, teams gain real-time visibility into contract health, compliance, and efficiency.
In this detailed guide, you will learn what a Contract Management KPI Dashboard in Excel is, how it works, why it is important, and how each worksheet supports better contract decisions. Moreover, you will explore its advantages, best practices, and frequently asked questions. By the end of this article, you will clearly understand how this Excel dashboard transforms contract data into actionable insights.
Click to Purchases Contract Management KPI Dashboard in Excel
What Is a Contract Management KPI Dashboard in Excel?
A Contract Management KPI Dashboard in Excel is a structured and interactive performance tracking tool designed to monitor key metrics related to contract lifecycle management.
Instead of reviewing multiple contract registers or manual reports, this dashboard consolidates all contract KPIs into a single Excel file. As a result, legal teams, procurement teams, finance teams, and management gain a unified view of contract performance.
This dashboard typically tracks:
-
Contract compliance metrics
-
Timeliness and renewal KPIs
-
Cost and value-related KPIs
-
Risk and deviation indicators
-
Historical performance comparisons
Since the dashboard is built in Excel, it remains flexible, user-friendly, and easy to customize.
Why Is Contract KPI Tracking Important?
Contract management involves deadlines, obligations, and financial commitments. Therefore, even a small oversight can create legal or financial risks.
A KPI-based dashboard helps organizations:
-
Monitor contract performance continuously
-
Identify risks before they escalate
-
Compare actual performance against targets
-
Track trends across months and years
-
Support data-driven contract decisions
Moreover, KPI tracking improves accountability across teams.
Introduction to Contract Management KPI Dashboard in Excel (Paid Template)
The Contract Management KPI Dashboard in Excel is a ready-to-use, professionally designed Excel template created to simplify contract performance tracking.
This dashboard allows you to:
-
Track contract KPIs monthly and yearly
-
Compare MTD and YTD performance
-
Benchmark against previous year data
-
Visualize performance using indicators
-
Maintain standardized KPI definitions
Because everything works inside Excel, users do not need advanced tools or technical skills.
Key Features of Contract Management KPI Dashboard in Excel
Below are the main features that make this dashboard practical and effective.
📊 Centralized KPI Monitoring
Track all contract-related KPIs in one structured dashboard.
📅 Month-Wise Performance Analysis
Analyze contract performance for each selected month using dynamic dropdowns.
🎯 MTD and YTD KPI Tracking
Monitor both short-term and long-term contract performance.
🔁 Previous Year Comparison
Compare current performance with previous year values.
📈 KPI Trend Analysis
Understand performance movement using MTD and YTD trend charts.
🎨 Conditional Formatting Indicators
Instantly identify performance status using up and down arrows.
Click to Purchases Contract Management KPI Dashboard in Excel
Worksheets Included in Contract Management KPI Dashboard in Excel
This dashboard consists of seven well-structured worksheets, each serving a specific purpose.
1. Home Sheet – Central Navigation Hub
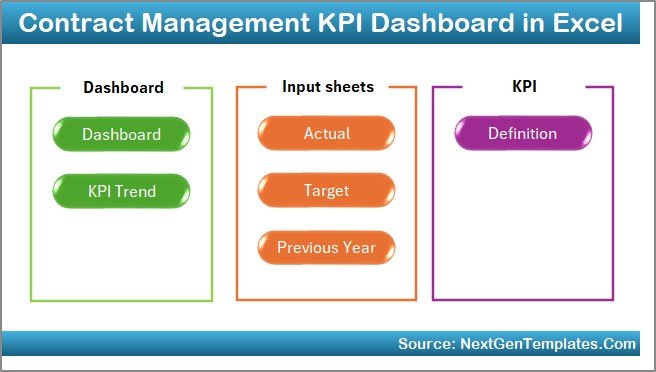
The Home Sheet works as an index page for the dashboard.
Key Features of Home Sheet
-
Six navigation buttons to jump to different sheets
-
Clean and user-friendly layout
-
Quick access to all dashboard components
As a result, users navigate the dashboard smoothly without scrolling through tabs.
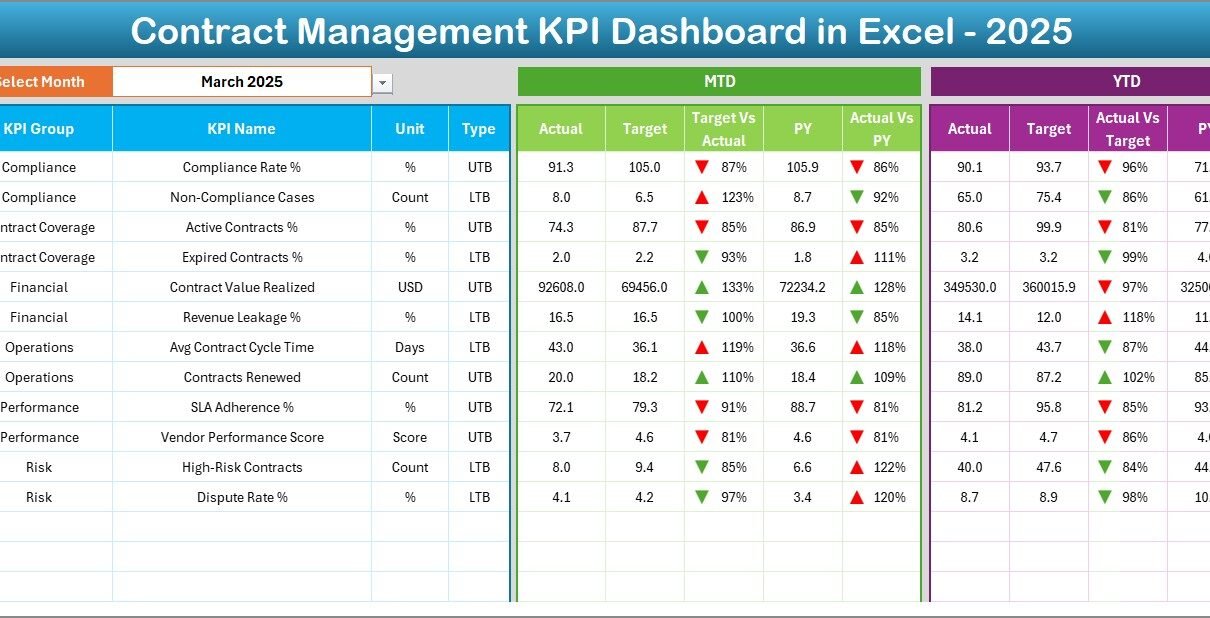
2. Dashboard Sheet – Overall KPI Performance View
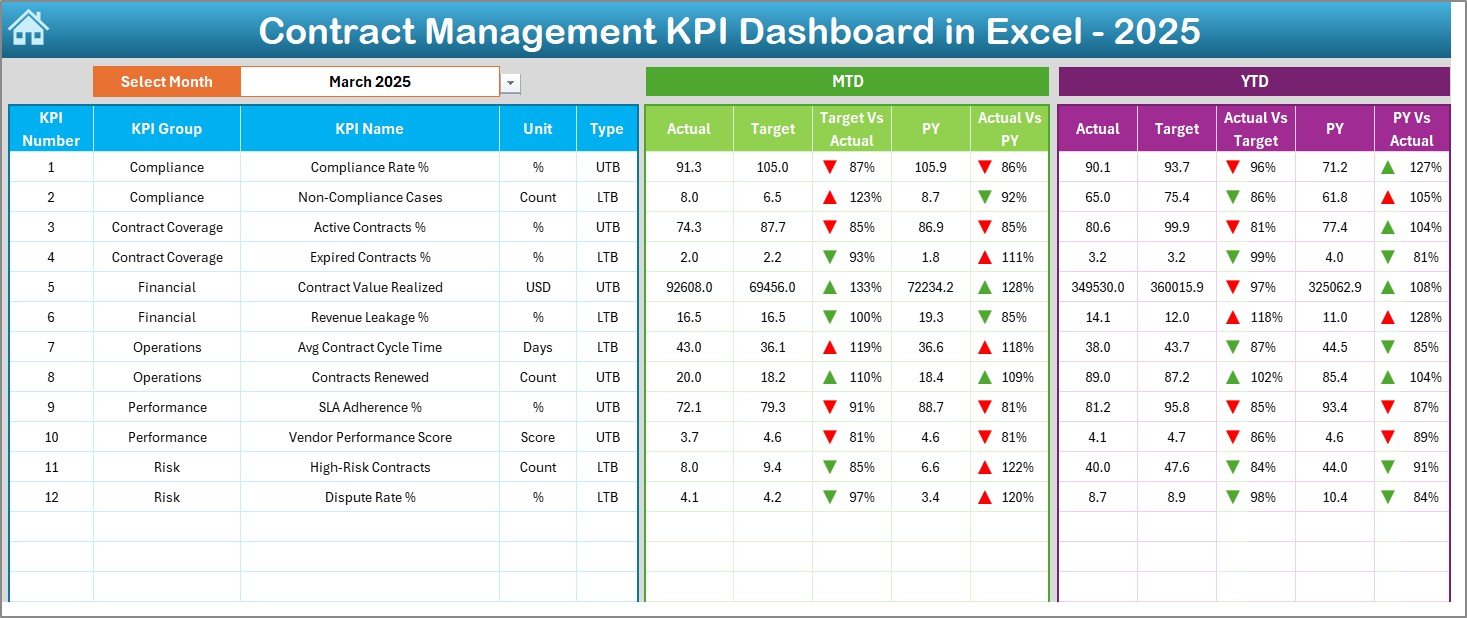
The Dashboard Sheet is the main analytical view of the entire KPI dashboard.
How the Dashboard Sheet Works
🔽 Month Selection Dropdown
You can select the required month from the dropdown in cell D3. Once selected, all KPI values update automatically.
📊 MTD Performance Tracking
The dashboard displays:
-
MTD Actual
-
MTD Target
-
MTD Previous Year
-
Target vs Actual
-
PY vs Actual
Conditional formatting arrows highlight performance direction clearly.
📈 YTD Performance Tracking
The dashboard also shows:
-
YTD Actual
-
YTD Target
-
YTD Previous Year
-
Target vs Actual
-
PY vs Actual
This helps track cumulative contract performance throughout the year.
Click to Purchases Contract Management KPI Dashboard in Excel
3. KPI Trend Sheet – Detailed KPI Analysis

The KPI Trend Sheet allows users to analyze one KPI in detail.
Key Features of KPI Trend Sheet
🔽 KPI Selection Dropdown
Select a KPI name from the dropdown available in cell C3. The entire sheet updates automatically.
📌 KPI Details Section
This section displays:
-
KPI Group
-
KPI Unit
-
KPI Type (Lower the Better / Upper the Better)
-
KPI Formula
-
KPI Definition
This ensures consistency and clarity.
📊 MTD and YTD Trend Charts
Trend charts display:
-
Actual values
-
Target values
-
Previous Year values
As a result, performance patterns become easy to interpret.
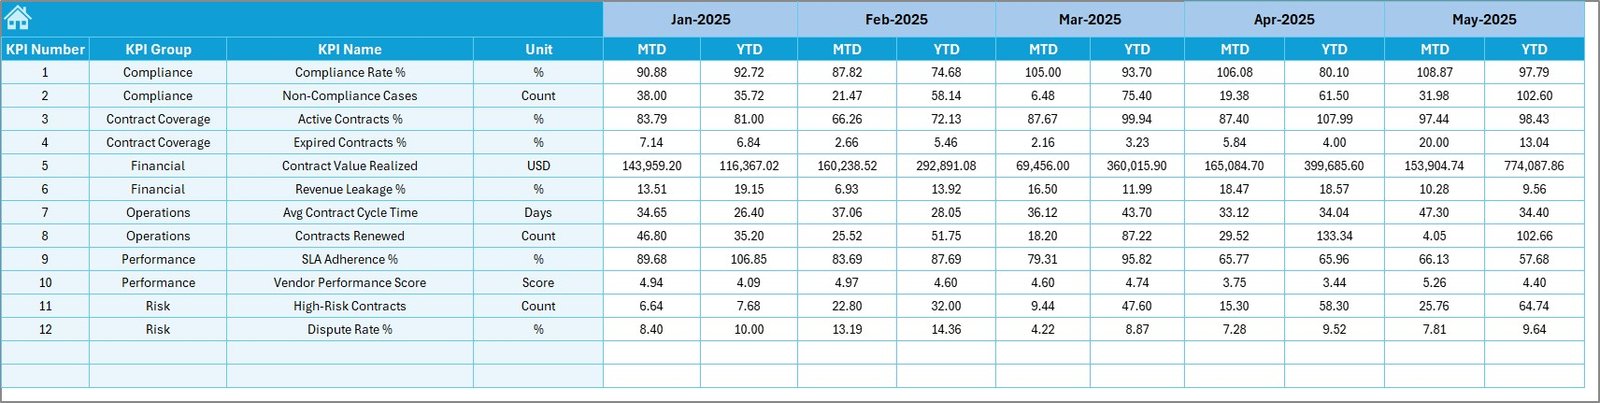
4. Actual Numbers Input Sheet – Enter Performance Data
The Actual Numbers Input Sheet is used to enter real performance data.
Key Highlights
-
Enter MTD and YTD actual values
-
Change the month from cell E1
-
Automatically update dashboard visuals
This structure ensures accurate and timely data updates.
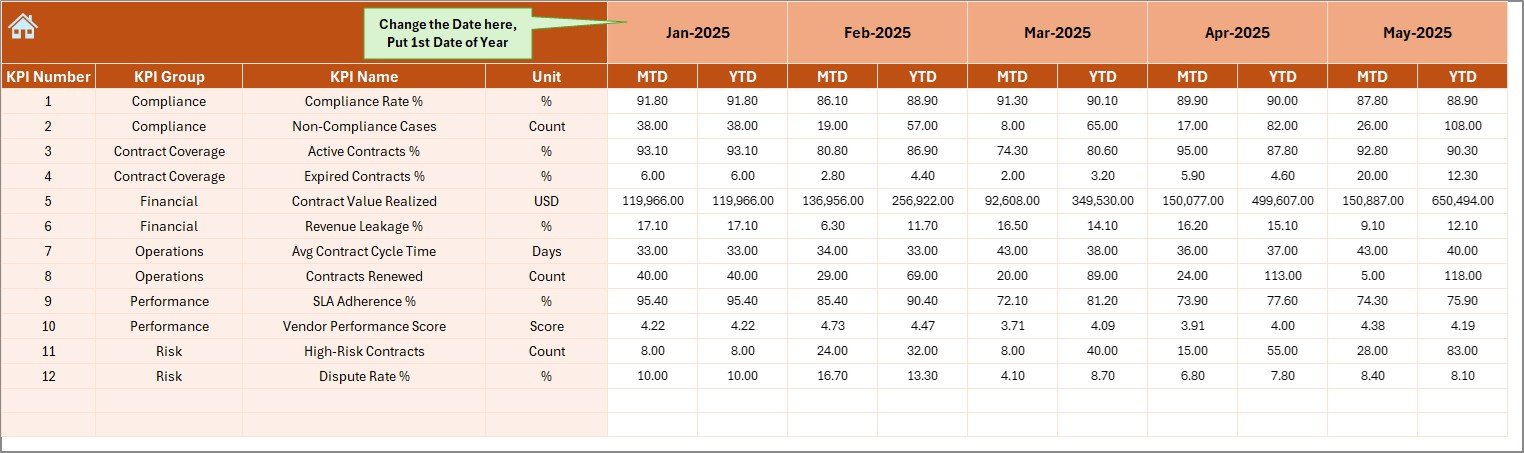
5. Target Sheet – Define KPI Targets
The Target Sheet stores target values for each KPI.
Features of Target Sheet
-
Enter monthly MTD targets
-
Enter cumulative YTD targets
-
Maintain consistent performance benchmarks
Targets drive accountability and performance focus.
Click to Purchases Contract Management KPI Dashboard in Excel
6. Previous Year Number Sheet – Historical Comparison
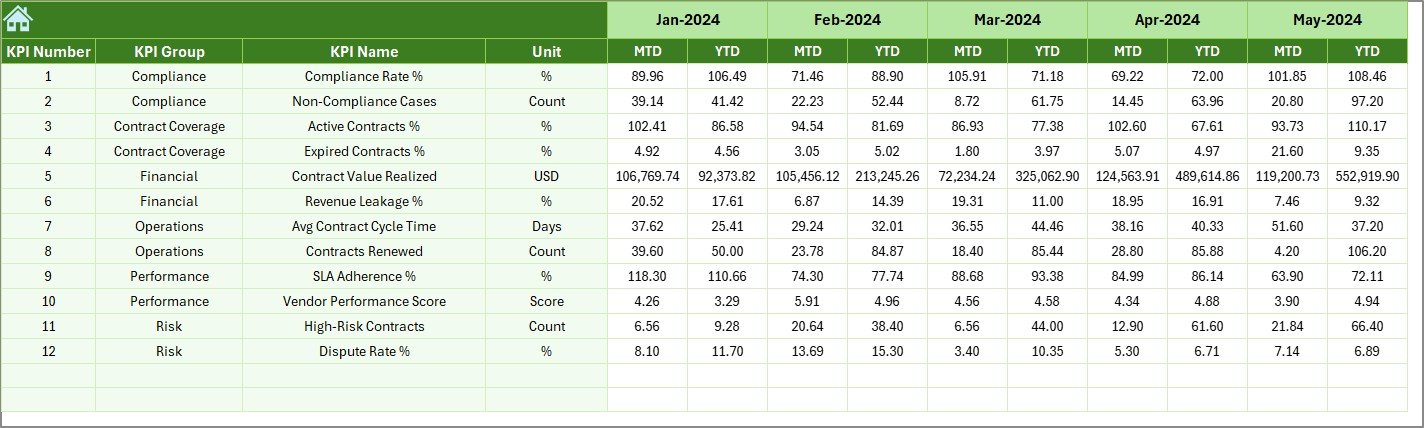
The Previous Year Number Sheet captures last year’s KPI values.
Why This Sheet Matters
-
Enables year-over-year comparison
-
Highlights improvement or decline
-
Supports long-term trend analysis
Historical data adds depth to performance insights.
7. KPI Definition Sheet – Standardize KPI Knowledge
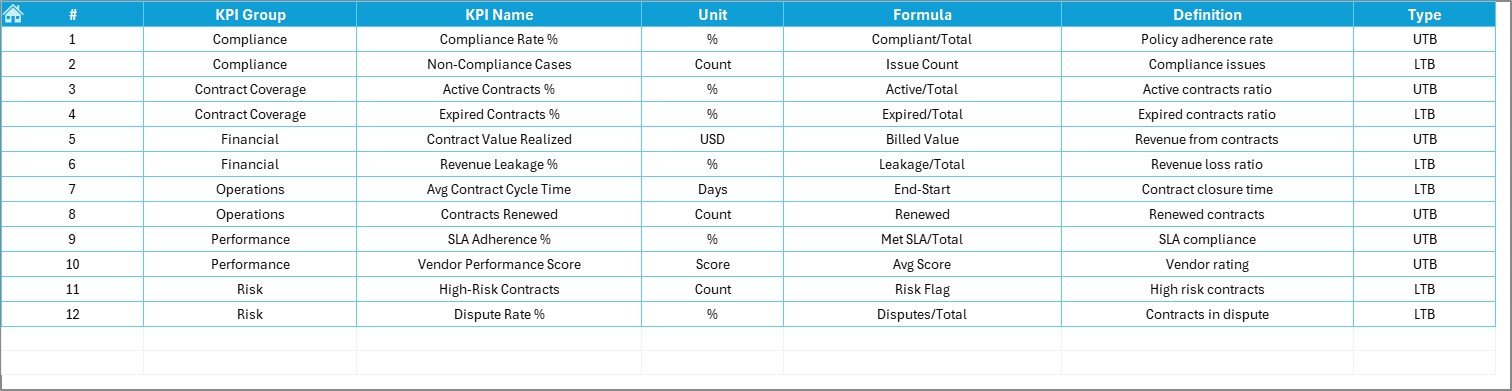
The KPI Definition Sheet acts as a reference table for all KPIs.
Information Captured
-
KPI Name
-
KPI Group
-
Unit of Measurement
-
KPI Formula
-
KPI Definition
This sheet ensures every stakeholder understands KPI logic.
How Does This Dashboard Improve Contract Decisions?
Because the dashboard combines real-time performance, trends, and benchmarks, it supports better decision-making.
-
Risks get identified early
-
Missed targets become visible
-
Contract renewals improve
-
Compliance tracking strengthens
Therefore, organizations move from reactive contract management to proactive control.
Click to Purchases Contract Management KPI Dashboard in Excel
Advantages of Contract Management KPI Dashboard in Excel
Using this dashboard provides several important advantages.
✅ Complete Performance Visibility
All contract KPIs appear in one dashboard.
✅ Better Compliance Control
Deviations become visible instantly.
✅ Time-Saving Reporting
Automated calculations reduce manual effort.
✅ Improved Accountability
Targets and actuals promote ownership.
✅ Excel-Based Flexibility
Easily customize KPIs and structure.
Click to Purchases Contract Management KPI Dashboard in Excel
Best Practices for Contract Management KPI Dashboard in Excel
Follow these best practices to maximize dashboard value.
📌 Define Relevant KPIs
Select KPIs aligned with contract goals.
📌 Update Data Regularly
Maintain monthly discipline in data entry.
📌 Review Trends Frequently
Focus on trends rather than single values.
📌 Keep KPI Definitions Clear
Avoid ambiguity in KPI formulas.
📌 Train Dashboard Users
Ensure all users understand dashboard logic.
Who Can Use This Dashboard?
This dashboard suits:
-
Contract managers
-
Legal teams
-
Procurement professionals
-
Finance teams
-
Senior management
Anyone with basic Excel knowledge can use it effectively.
Conclusion
The Contract Management KPI Dashboard in Excel is a powerful yet simple solution for tracking contract performance.
Instead of relying on fragmented reports and manual tracking, this ready-to-use Excel dashboard provides clarity, structure, and actionable insights. By tracking MTD, YTD, targets, and previous year performance, organizations gain full control over contract management.
If you want to improve visibility, reduce risk, and make smarter contract decisions, this KPI dashboard is the right choice.
Click to Purchases Contract Management KPI Dashboard in Excel
Frequently Asked Questions (FAQs)
❓ What is a Contract Management KPI Dashboard in Excel?
It is an Excel-based tool used to track, analyze, and monitor contract performance KPIs.
❓ Can I customize KPIs in this dashboard?
Yes, you can easily add, remove, or modify KPIs.
❓ Does the dashboard support MTD and YTD tracking?
Yes, it supports both Month-to-Date and Year-to-Date analysis.
❓ Do I need advanced Excel skills?
No, basic Excel knowledge is enough to use this dashboard.
❓ Can I use this dashboard for different contract types?
Yes, the dashboard works for procurement, legal, and service contracts.
Click to Purchases Contract Management KPI Dashboard in Excel
Visit our YouTube channel to learn step-by-step video tutorials