Corporate audits play a critical role in ensuring compliance, reducing risk, and improving operational efficiency. However, many organizations still manage audit data using spreadsheets, emails, and static reports. As a result, audit teams struggle with delayed insights, scattered information, and limited visibility.
This is exactly where a Corporate Audit Dashboard in Power BI delivers exceptional value.
By transforming raw audit data into interactive visuals, this dashboard helps auditors, compliance teams, and leadership monitor audit performance in real time. Moreover, it enables faster decision-making, improves transparency, and strengthens governance across the organization.
In this detailed guide, you will learn what a Corporate Audit Dashboard in Power BI is, how it works, its dashboard pages, key features, advantages, best practices, and frequently asked questions. By the end, you will clearly understand why this dashboard is essential for modern audit management.
Click to buy Corporate Audit Dashboard in Power BI
What Is a Corporate Audit Dashboard in Power BI?
A Corporate Audit Dashboard in Power BI is an interactive analytics solution designed to track, analyze, and visualize audit-related data in a structured and meaningful way.
Instead of reviewing long audit reports, users can instantly:
- Track total audits and completion status
- Monitor audit findings and recommendations
- Analyze cost impact across departments and locations
- Identify high-risk areas and trends
- Measure audit performance over time
Because Power BI supports dynamic filters and visuals, users can drill down into specific audit types, departments, locations, or time periods. Consequently, audit teams gain better control and clarity.
Why Do Organizations Need a Corporate Audit Dashboard?
Corporate audits generate large volumes of data. However, without proper visualization, that data fails to create value.
Here is why organizations need a Corporate Audit Dashboard in Power BI:
- Manual audit reports take too much time
- Excel files often contain errors and inconsistencies
- Leadership lacks real-time visibility into audit risks
- Follow-ups and action closures become difficult to track
- Cost impact insights remain hidden
Therefore, a centralized dashboard becomes essential. It connects all audit metrics in one place and presents them visually. As a result, organizations improve accountability and compliance.
How Does a Corporate Audit Dashboard in Power BI Work?
The Corporate Audit Dashboard in Power BI works by connecting structured audit data—usually from Excel or databases—to Power BI visuals.
Here is how the process flows:
- Audit data gets captured in structured tables
- Power BI imports and models the data
- Measures calculate KPIs like completion %, findings, and cost impact
- Interactive visuals display insights across pages
- Slicers allow users to filter by department, audit type, or time
Because of this workflow, audit teams spend less time preparing reports and more time acting on insights.
What Are the Key Features of a Corporate Audit Dashboard in Power BI?
This Corporate Audit Dashboard in Power BI includes five powerful analytical pages, each designed to answer specific audit questions.
Let’s explore them in detail.
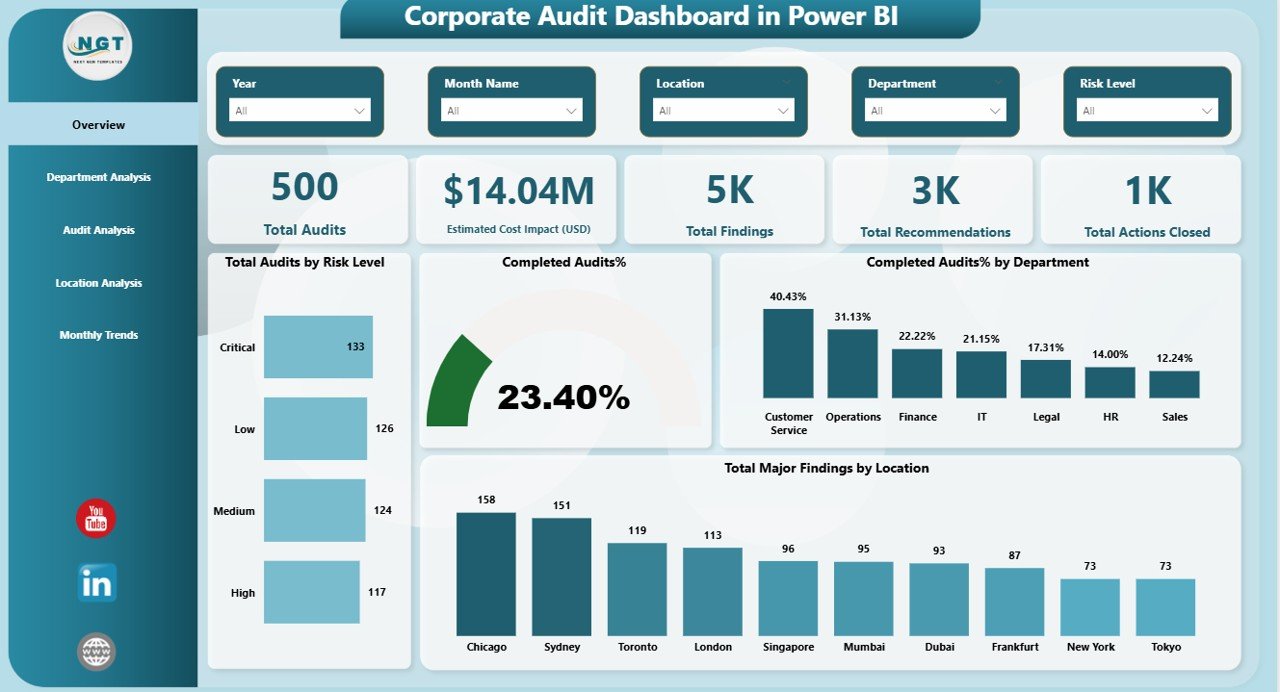
Overview Page: What Does the Audit Snapshot Show?
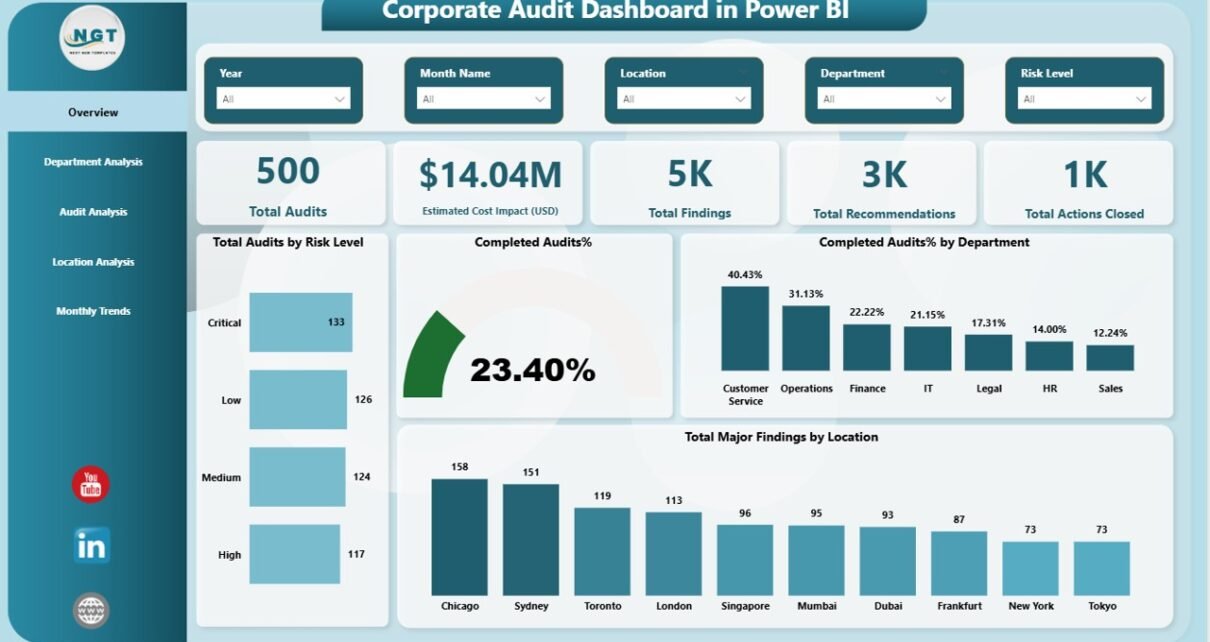
The Overview Page serves as the central snapshot of audit performance. It provides instant visibility into overall audit health.
Key Metrics on the Overview Page
This page includes high-level KPI cards such as:
- Total Audits
- Estimated Cost Impact (USD)
- Total Findings
- Total Recommendations
- Total Actions Closed
Because these KPIs appear at the top, users can quickly assess the audit status.
Visual Analysis on the Overview Page
In addition, the page includes insightful charts like:
- Total Audits by Risk Level
- Completed Audits %
- Completed Audits % by Department
- Total Major Findings by Location
Together, these visuals help leadership identify high-risk areas and performance gaps immediately.
Click to buy Corporate Audit Dashboard in Power BI
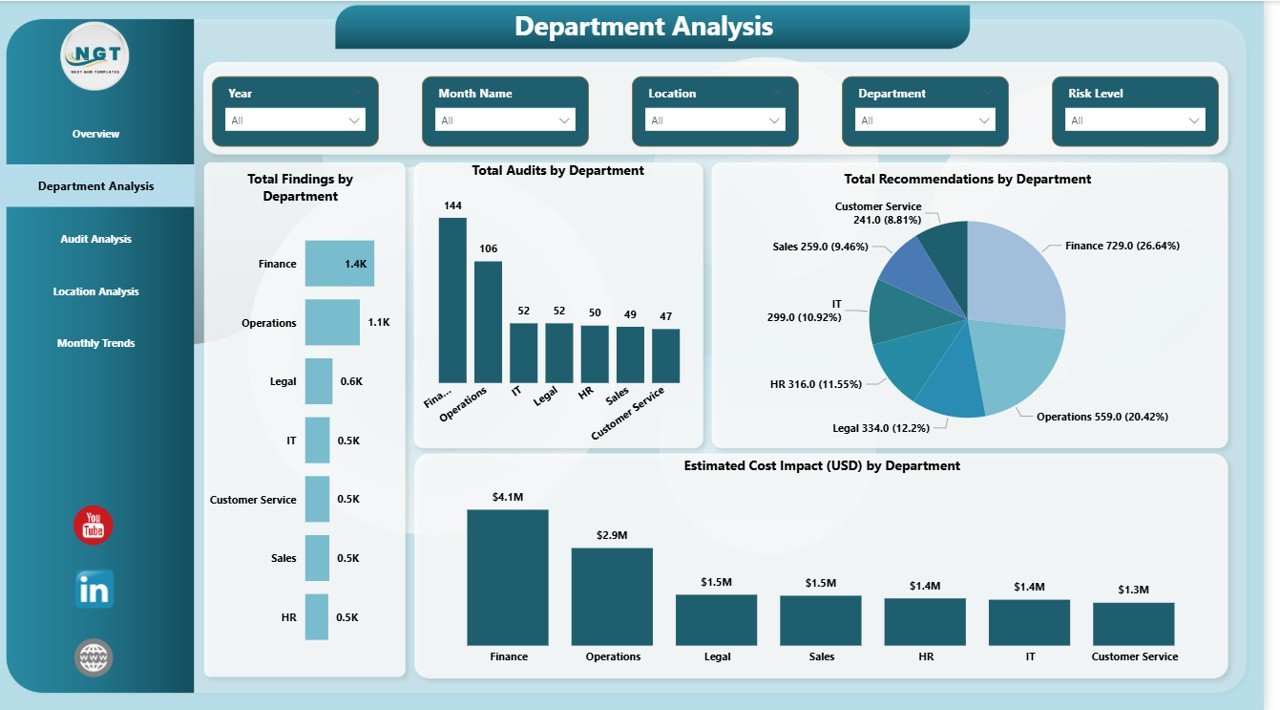
Department Analysis Page: Which Departments Need Attention?
The Department Analysis Page focuses on audit performance across departments. This page helps audit teams understand where issues occur most frequently.
Key Insights from Department Analysis
This page displays:
- Total Findings by Department
- Total Audits by Department
- Total Recommendations by Department
- Estimated Cost Impact by Department
Because of these insights, organizations can prioritize departments with higher risk exposure and cost impact.
Click to buy Corporate Audit Dashboard in Power BI
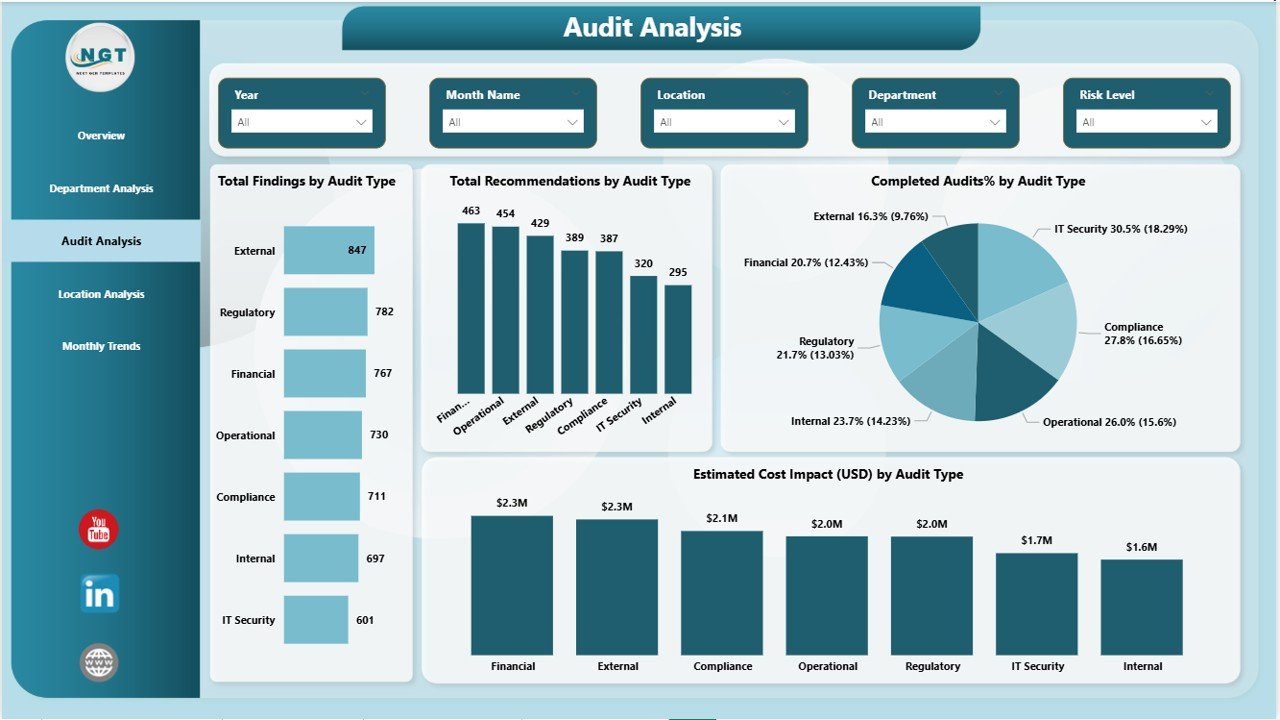
Audit Analysis Page: How Do Different Audit Types Perform?
The Audit Analysis Page evaluates performance by audit type. This analysis proves useful when organizations conduct multiple audit categories such as financial, operational, IT, or compliance audits.
Key Metrics on the Audit Analysis Page
This page includes:
- Total Findings by Audit Type
- Total Recommendations by Audit Type
- Completed Audits % by Audit Type
- Estimated Cost Impact (USD) by Audit Type
As a result, audit leaders can easily identify which audit types generate the most findings and require process improvements.
Click to buy Corporate Audit Dashboard in Power BI
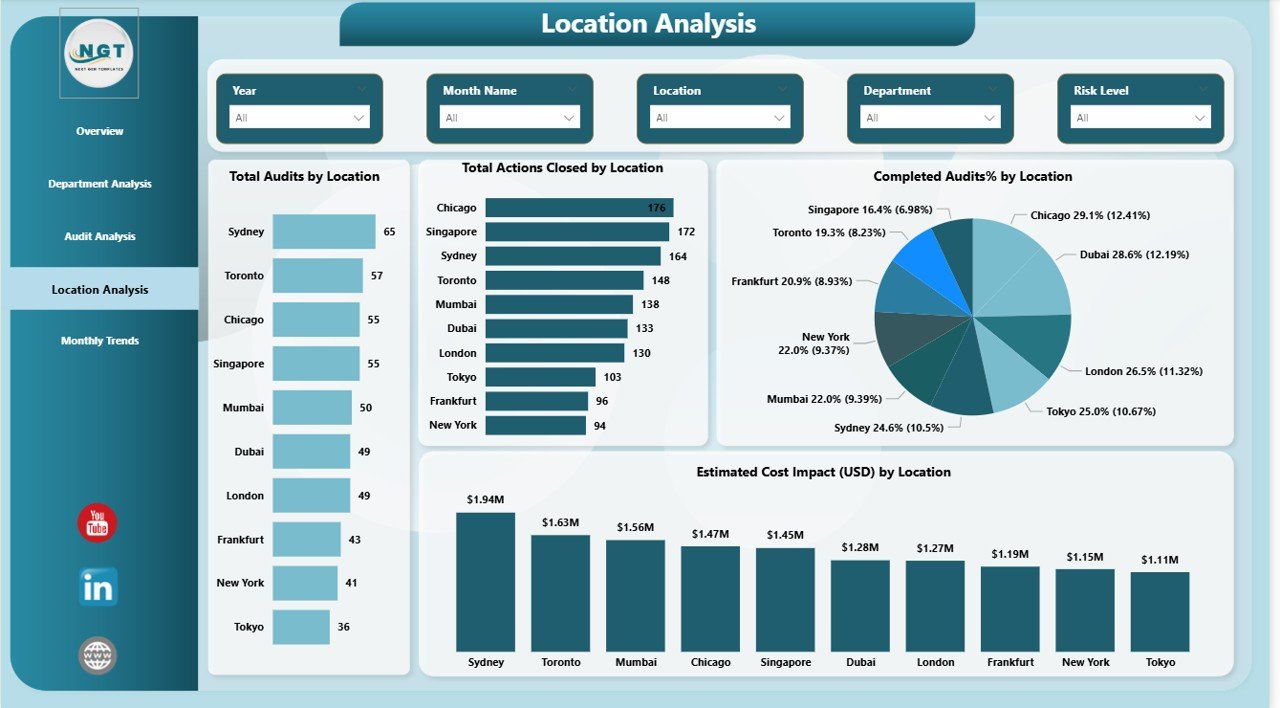
Location Analysis Page: Which Locations Show Higher Audit Risk?
The Location Analysis Page provides a geographical view of audit performance. This page helps organizations compare audit outcomes across branches, plants, or regions.
Visuals Included in Location Analysis
The dashboard shows:
- Total Audits by Location
- Total Actions Closed by Location
- Completed Audits % by Location
- Estimated Cost Impact by Location
Because of this analysis, management can focus on locations that consistently show higher risk or lower compliance.
Click to buy Corporate Audit Dashboard in Power BI
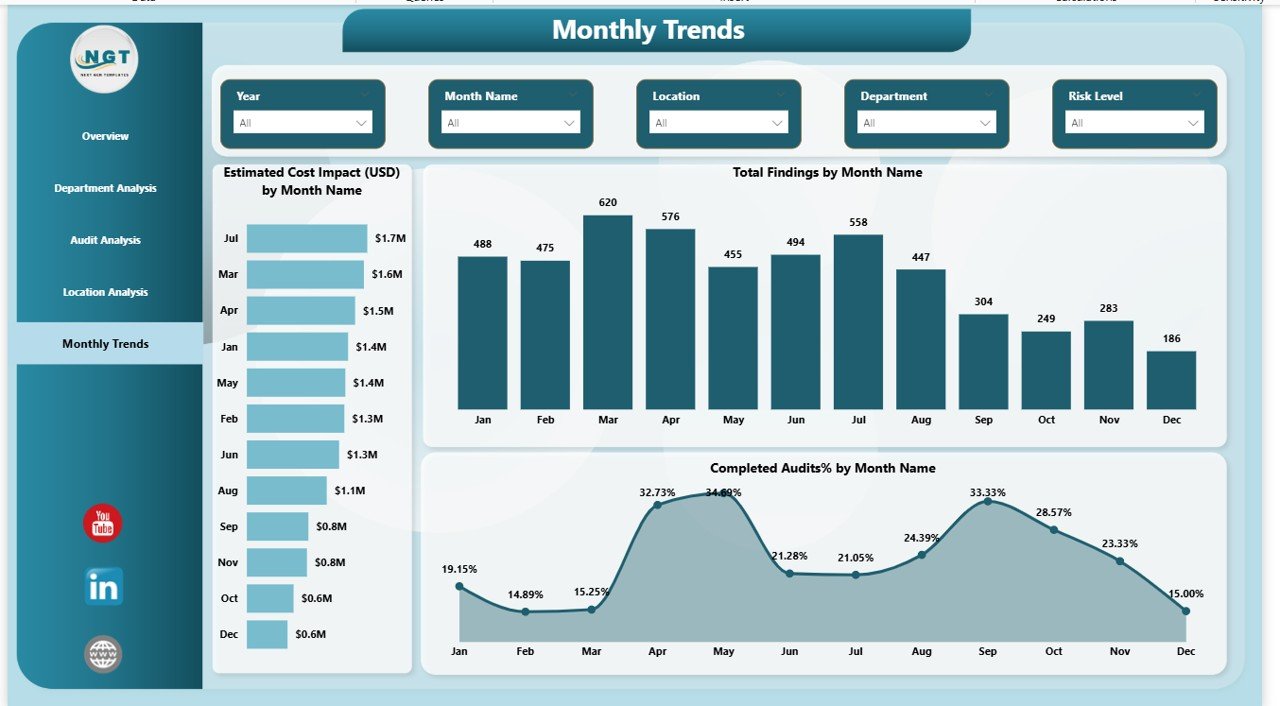
Monthly Trends Page: How Does Audit Performance Change Over Time?
The Monthly Trends Page highlights how audit performance evolves month by month. Trend analysis plays a vital role in long-term audit planning.
Key Trends Covered on This Page
This page includes:
- Estimated Cost Impact (USD) by Month
- Total Findings by Month
- Completed Audits % by Month
By tracking trends, organizations can detect recurring issues and measure improvement initiatives effectively.
Click to buy Corporate Audit Dashboard in Power BI
What KPIs Can You Track Using a Corporate Audit Dashboard?
A Corporate Audit Dashboard in Power BI enables tracking of multiple critical KPIs, including:
- Audit Completion Rate
- Number of Audit Findings
- Recommendation Closure Rate
- Risk-Level Distribution
- Cost Impact of Audit Issues
- Department-wise Audit Exposure
- Location-wise Compliance Performance
Since Power BI supports calculated measures, these KPIs update automatically with new data.
Advantages of Corporate Audit Dashboard in Power BI
Using a Corporate Audit Dashboard in Power BI offers several advantages for organizations of all sizes.
- Centralized Audit Visibility
The dashboard brings all audit metrics into one centralized view. Therefore, teams avoid switching between files and reports.
- Faster Decision-Making
Because insights update in real time, leaders can act quickly on high-risk findings and unresolved actions.
- Improved Audit Transparency
The dashboard improves transparency by clearly showing audit status, findings, and actions across departments and locations.
- Better Risk Management
By identifying high-risk areas early, organizations reduce potential financial and compliance risks.
- Time and Cost Savings
Automation eliminates manual reporting effort. As a result, audit teams save time and reduce reporting costs.
Who Should Use a Corporate Audit Dashboard?
A Corporate Audit Dashboard in Power BI benefits multiple roles within an organization:
- Internal Audit Teams
- Compliance Officers
- Risk Management Teams
- Finance and Operations Leaders
- Senior Management and Board Members
Since the dashboard supports role-based analysis, each stakeholder can focus on relevant insights.
How Does Power BI Improve Corporate Audit Reporting?
Power BI enhances audit reporting by offering:
- Interactive visuals instead of static tables
- Drill-down and drill-through capabilities
- Real-time data refresh
- Secure data access and sharing
- Easy integration with Excel and databases
Consequently, audit reporting becomes dynamic, accurate, and user-friendly.
Best Practices for the Corporate Audit Dashboard in Power BI
To maximize the value of a Corporate Audit Dashboard in Power BI, follow these best practices.
- Use Clean and Structured Data
Always maintain structured audit data with clear fields such as audit type, department, location, and dates.
- Focus on Actionable KPIs
Avoid overcrowding the dashboard. Instead, focus on KPIs that drive audit decisions and follow-ups.
- Use Consistent Risk Categories
Maintain consistent risk levels across audits to ensure accurate comparisons.
- Leverage Slicers Wisely
Use slicers for department, audit type, and time period to enhance interactivity without clutter.
- Review Dashboard Regularly
Update and review the dashboard periodically to align with evolving audit objectives.
How Secure Is a Corporate Audit Dashboard in Power BI?
Power BI provides enterprise-level security features, including:
- Role-based access control
- Secure data connections
- Encrypted data storage
- Controlled sharing and publishing
Therefore, organizations can confidently use Power BI for sensitive audit data.
Can Small and Mid-Sized Organizations Use This Dashboard?
Yes, absolutely.
Small and mid-sized organizations benefit significantly from a Corporate Audit Dashboard in Power BI because:
- It works seamlessly with Excel data
- It reduces dependency on manual audits
- It scales easily as audit volume grows
- It requires no complex infrastructure
As a result, organizations of any size can implement this solution effectively.
How Does This Dashboard Support Continuous Audit Improvement?
Continuous improvement depends on data-driven insights. This dashboard supports improvement by:
- Tracking audit trends over time
- Measuring closure of audit actions
- Highlighting recurring findings
- Comparing performance across departments and locations
Because of these capabilities, organizations strengthen their audit maturity.
Conclusion: Why Should You Use a Corporate Audit Dashboard in Power BI?
A Corporate Audit Dashboard in Power BI transforms audit data into powerful insights. Instead of relying on static reports, organizations gain real-time visibility into audit performance, risks, and cost impact.
By using this dashboard, audit teams improve efficiency, leadership gains clarity, and organizations strengthen compliance. Most importantly, it turns audits into a strategic advantage rather than a compliance burden.
If your organization wants better audit control, faster insights, and improved governance, this dashboard becomes an essential solution.
Frequently Asked Questions (FAQs)
What is the main purpose of a Corporate Audit Dashboard in Power BI?
The main purpose is to monitor audit performance, findings, risks, and cost impact through interactive visuals.
Can this dashboard work with Excel audit data?
Yes, Power BI connects easily with Excel files and updates visuals automatically.
Is Power BI suitable for sensitive audit data?
Yes, Power BI offers strong security features such as role-based access and encrypted data.
How often should audit data be updated?
Organizations should update audit data monthly or after every audit cycle for best results.
Does this dashboard support multiple audit types?
Yes, it supports analysis across various audit types such as financial, operational, and compliance audits.
Can leadership use this dashboard without technical skills?
Yes, the dashboard uses simple visuals and slicers, making it easy for non-technical users.
Visit our YouTube channel to learn step-by-step video tutorials
Watch the step-by-step video tutorial:
Click to buy Corporate Audit Dashboard in Power BI