Organizing and managing corporate events is no easy task. From tracking attendees to managing event budgets, venue feedback, and organizer performance — every detail matters. That’s where the Corporate Event Planning Dashboard in Power BI comes in. This dynamic, data-driven solution helps planners and event managers streamline every aspect of the event lifecycle using a visual and analytical approach.
In this detailed guide, you’ll discover how this dashboard works, its advantages, best practices, and answers to common questions. Whether you’re planning annual conferences, client meetings, team offsites, or leadership summits — this Power BI dashboard gives you the insights you need to plan successfully.
Click to Purchases Corporate Event Planning Dashboard in Power BI
What is the Corporate Event Planning Dashboard in Power BI?
The Corporate Event Planning Dashboard in Power BI is a fully interactive and ready-to-use business intelligence tool. It pulls event-related data from Excel into Power BI and transforms it into meaningful charts, cards, and trendlines across five analytical pages. With just a few clicks, you can view attendee metrics, analyze organizer effectiveness, compare costs across venues, and monitor feedback scores.
This dashboard is perfect for:
-
Event managers
-
HR professionals
-
Corporate planners
-
Marketing teams
-
Facility coordinators
Power BI’s dynamic filters and drill-down capabilities help stakeholders dive deep into performance metrics and improve event ROI.
Key Features of the Dashboard
The dashboard is divided into five insightful pages within the Power BI desktop file. Each page is rich with slicers (filters), summary cards, and visuals designed to answer key event planning questions.
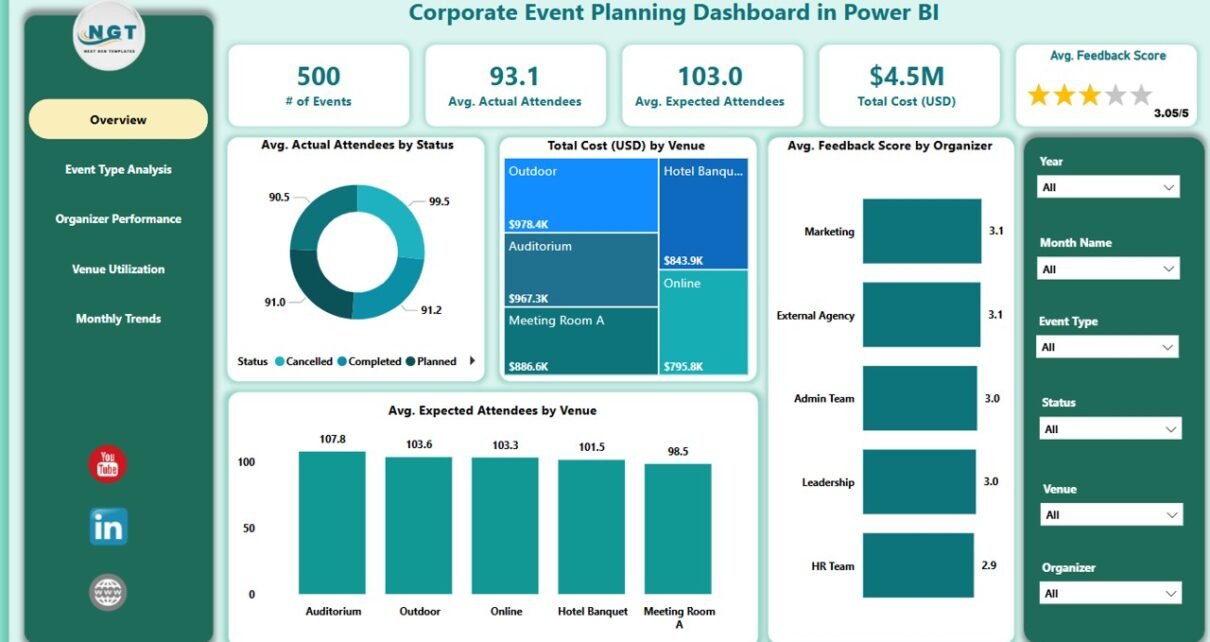
Overview Page
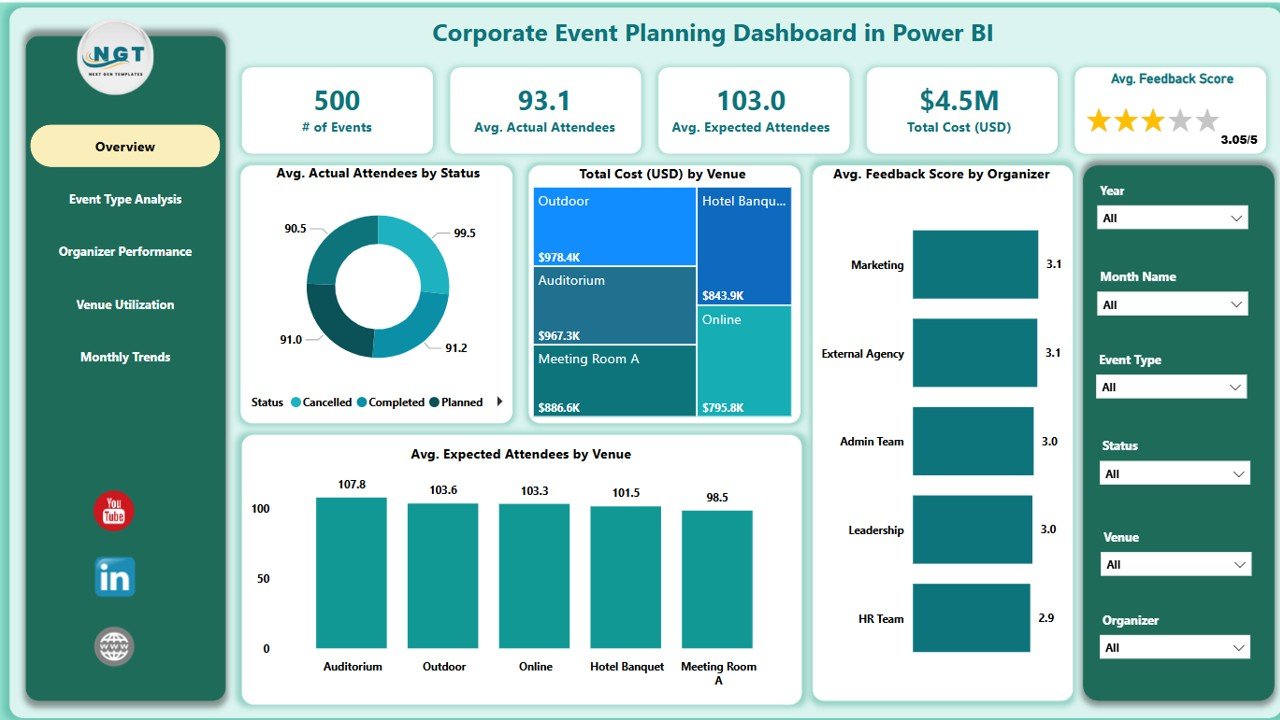
This is the primary summary page of the dashboard. It provides a high-level snapshot of current and past events. It includes:
✅ 6 slicers for quick filtering (Date, Status, Event Type, Venue, Organizer, etc.)
✅ 5 KPI Cards (Total Events, Expected Attendees, Actual Attendees, Total Cost, Avg. Feedback)
✅ 4 analytical charts:
- Average Actual Attendees by Status
- Total Cost (USD) by Venue
- Avg. Feedback Score by Organizer
- Avg. Expected Attendees by Venue
This page allows decision-makers to assess performance and resource allocation in a single glance.
Click to Purchases Corporate Event Planning Dashboard in Power BI
Event Type Analysis Page
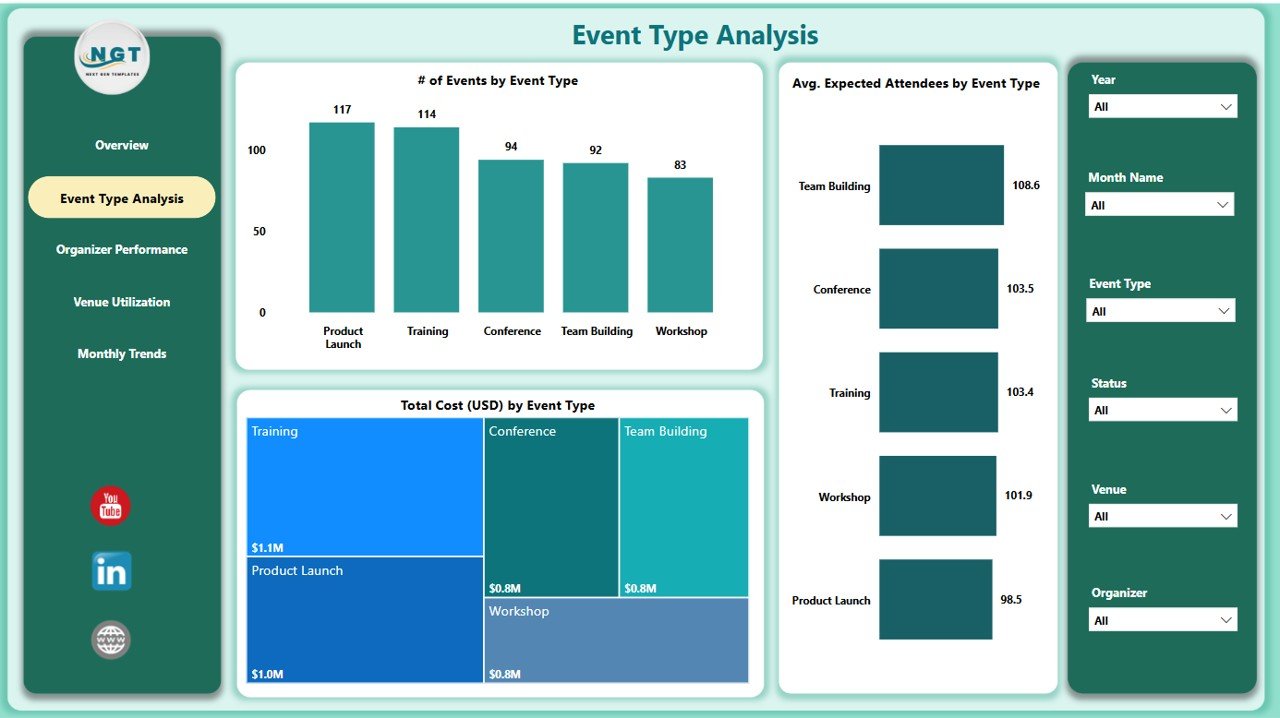
Understanding how different event types perform is crucial. This page focuses on:
🎯 6 slicers for flexible event filtering
📊 3 charts:
- Number of Events by Event Type
- Avg. Expected Attendees by Event Type
- Total Cost (USD) by Event Type
You can instantly compare the cost-effectiveness and popularity of different event types — such as workshops, seminars, training sessions, and executive meetings.
Organizer Performance Page
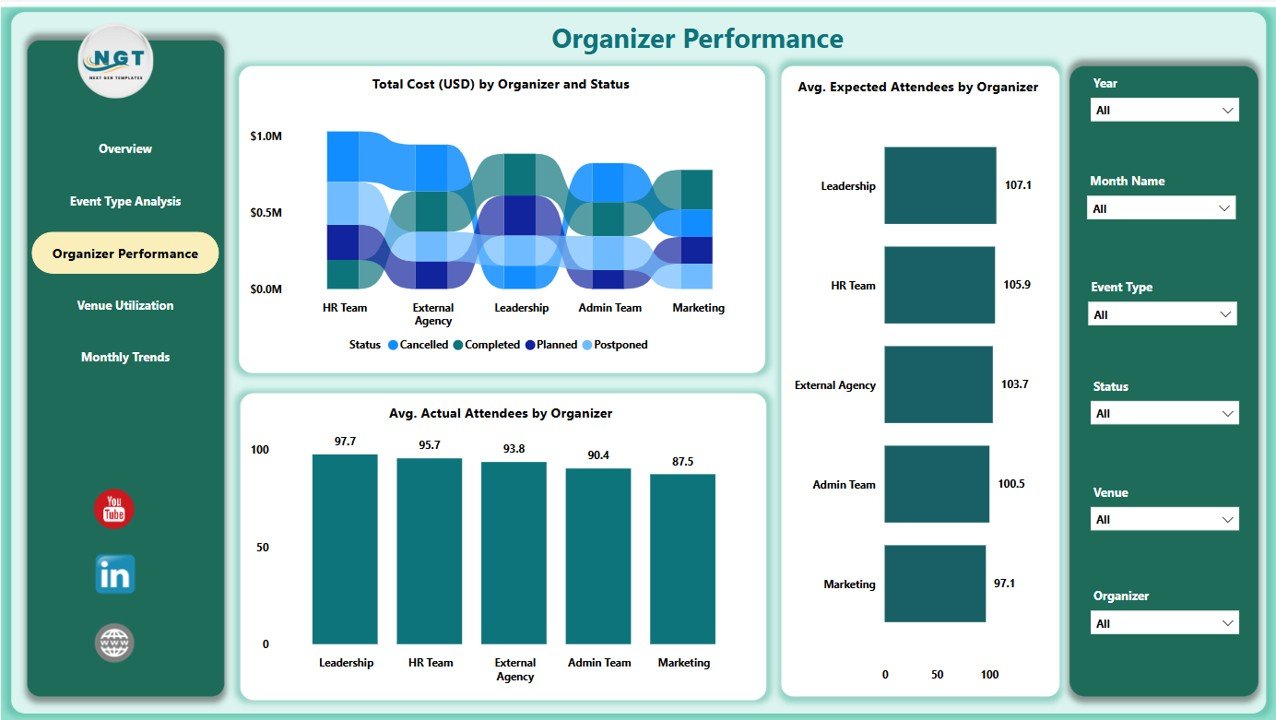
Organizer efficiency plays a key role in event success. This page includes:
🔍 6 slicers to isolate specific event data
📈 3 visualizations:
- Total Cost (USD) by Organizer and Event Status
- Avg. Expected Attendees by Organizer
- Avg. Actual Attendees by Organizer
Use this page to evaluate which organizers consistently drive better attendance, manage budgets wisely, and receive high participant feedback.
Venue Utilization Page
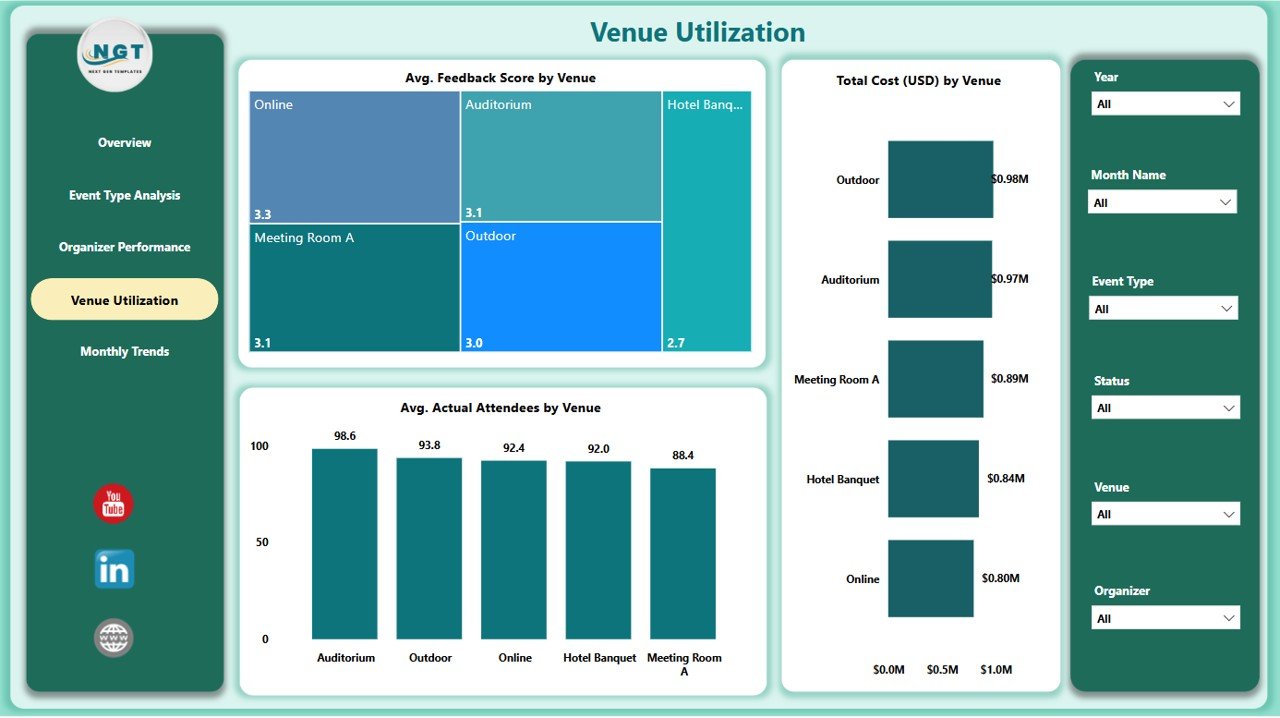
Venue selection affects logistics, attendance, and overall satisfaction. This page highlights:
Click to Purchases Corporate Event Planning Dashboard in Power BI
🧭 6 slicers for detailed filtering
📌 3 important charts:
- Avg. Feedback Score by Venue
- Total Cost (USD) by Venue
- Avg. Actual Attendees by Venue
It helps planners identify top-performing venues and those that need reconsideration.
Monthly Trend Page
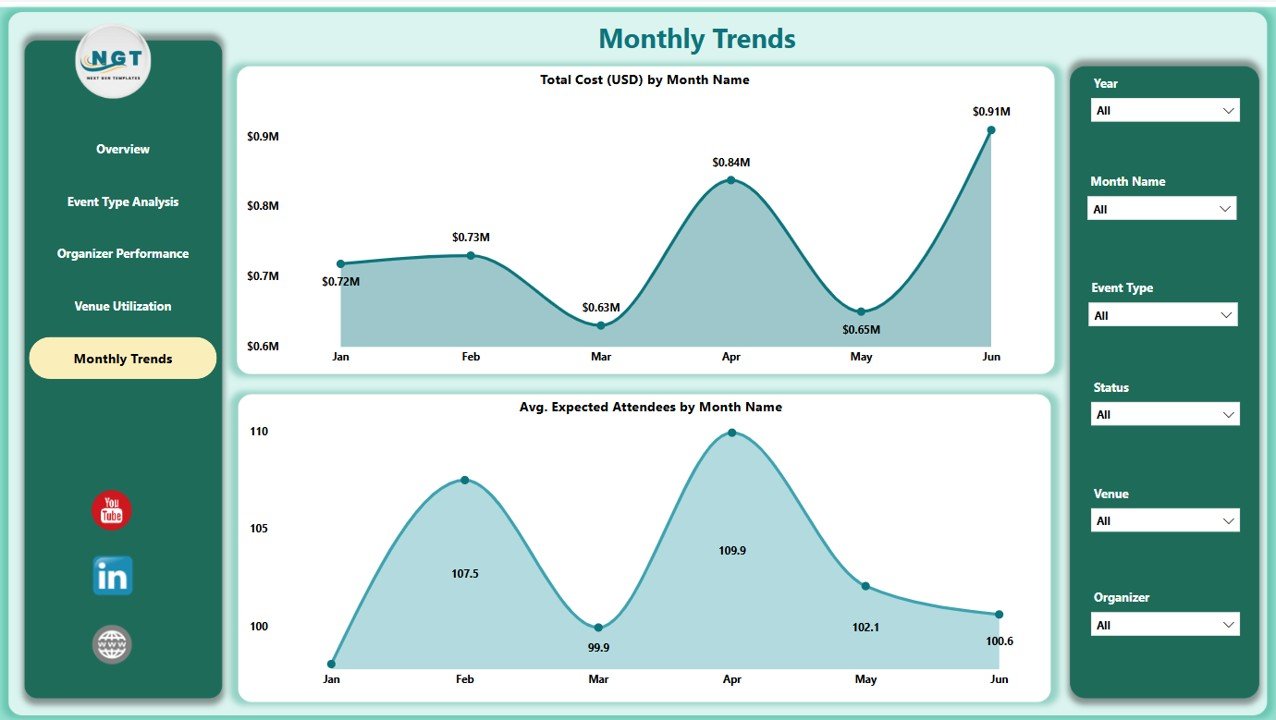
Tracking performance over time is essential. This final page includes:
📆 6 slicers for month-specific analysis
📅 2 trendline charts:
- Total Cost (USD) by Month Name
- Avg. Expected Attendees by Month Name
This view supports strategic decision-making for future event planning cycles.
Why Should You Use a Power BI Dashboard for Corporate Event Planning?
Let’s look at the advantages of using the Corporate Event Planning Dashboard in Power BI:
1. Real-time Data Visualization
Power BI provides live updates and visually appealing graphs that offer real-time insights into event KPIs.
2. Centralized Decision-Making
With all event-related data in one place, teams can collaborate better and make informed decisions.
3. Custom Filtering and Drill-Down
Users can apply filters to focus on specific event types, venues, timeframes, or organizers.
4. Enhanced Accountability
Each organizer’s performance can be tracked, improving responsibility and results.
5. Cost Optimization
Understand cost drivers by venue or event type and make smarter budgeting choices.
6. Feedback-Driven Improvements
Incorporating average feedback scores helps refine planning for future events.
Click to Purchases Corporate Event Planning Dashboard in Power BI
Best Practices for Using the Corporate Event Planning Dashboard
To get the most from this dashboard, follow these best practices:
✅ Update Data Regularly
Ensure your Excel data source is up to date. Scheduled refreshes in Power BI can automate this.
✅ Use Consistent Naming Conventions
Keep venue, event type, and organizer names consistent to avoid filter mismatches.
✅ Set Up Role-Based Access
Use Power BI’s security features to control who can see or edit sensitive data.
✅ Leverage Annotations
Add notes to visuals for context, such as reasons for high costs or low attendance.
✅ Monitor Feedback Trends
Use feedback scores as a qualitative KPI alongside attendance and cost figures.
✅ Export for Sharing
Power BI allows exporting visuals and dashboards as PDFs or images, making sharing easy during meetings.
How to Implement the Dashboard in Your Workflow?
Follow these steps to integrate the Corporate Event Planning Dashboard into your planning process:
-
Prepare Your Data – Ensure your Excel file has fields like Event Name, Date, Venue, Organizer, Expected Attendees, Actual Attendees, Cost, and Feedback Score.
-
Connect to Power BI – Import your Excel file and structure the data using Power BI queries.
-
Customize Visuals – Modify slicers, card labels, and visuals based on your event types and terminology.
-
Publish to Power BI Service – Share the report with your team using the Power BI cloud platform.
-
Analyze Regularly – Set weekly or monthly review meetings using dashboard insights.
Who Can Benefit from This Dashboard?
This dashboard is not just for event managers. It’s also a valuable tool for:
✅ Marketing Teams – Tracking promotional event performance
✅ HR Departments – Managing employee engagement activities
✅ Sales Leadership – Organizing client meets or trade shows
✅ Admin Staff – Booking venues and managing budgets
✅ CXOs – Reviewing ROI on corporate engagements
What Insights Can You Derive from the Dashboard?
Here are some actionable insights you can gain:
🔍 Compare budget usage across different event types
📉 Identify venues with high costs but low attendance
🎯 Spot organizers who consistently deliver results
📈 Track growth in attendee counts month over month
⭐ See how feedback scores align with actual attendance
Conclusion
The Corporate Event Planning Dashboard in Power BI is more than a visual reporting tool — it’s a powerful planning companion. With its multi-page layout, interactive slicers, insightful KPIs, and trend charts, you can take your event planning efforts to the next level.
Frequently Asked Questions (FAQs)
Q1. Can I use this dashboard with Google Sheets instead of Excel?
No. Currently, this Power BI dashboard is designed to connect with Excel. However, you can export Google Sheets to Excel format and then connect.
Q2. How often should I update the data?
It’s best to update the source Excel file weekly or after each event. You can also use Power BI’s scheduled refresh feature for automation.
Q3. Can I customize the visuals and KPI cards?
Yes. Power BI allows full customization. You can change visuals, add new charts, and modify slicers based on your organizational needs.
Q4. Is the dashboard mobile-friendly?
Yes. Once published to the Power BI Service, the dashboard can be viewed on mobile devices via the Power BI app.
Q5. What type of users should have edit access to the dashboard?
Only core planning and admin teams should have edit rights. Others can use view-only access to explore the dashboard without modifying anything.
Q6. How do I track ROI using this dashboard?
Use the cost and feedback score charts to compare money spent versus participant satisfaction. Over time, this highlights event value.
Visit our YouTube channel to learn step-by-step video tutorials