In the modern financial world, credit rating agencies play a critical role in maintaining trust and transparency in global markets. They assess the creditworthiness of companies, governments, and financial instruments, influencing investment decisions and economic stability.
However, to ensure credibility and accuracy, rating agencies must consistently monitor their performance across several dimensions—turnaround time, rating accuracy, client coverage, and compliance efficiency. Managing these metrics manually can be time-consuming and prone to error.
That’s why the Credit Rating Agencies KPI Dashboard in Excel is a game-changer. This ready-to-use Excel-based dashboard enables agencies to track their key performance indicators (KPIs) with precision, visualize trends, and make informed decisions—all from one centralized place.
Click to Purchases Credit Rating Agencies KPI Dashboard in Excel
What Is a Credit Rating Agencies KPI Dashboard in Excel?
A Credit Rating Agencies KPI Dashboard is a structured Excel template designed to measure and visualize the core KPIs that define operational performance in credit assessment processes.
This dashboard consolidates monthly and yearly performance data into easy-to-read charts and tables. It gives a complete overview of your organization’s performance—helping you ensure accuracy, timeliness, compliance, and efficiency across every department.
The dashboard is dynamic and fully interactive. You can select the desired month, review Month-to-Date (MTD) and Year-to-Date (YTD) performance, and analyze trends over time—all through automated formulas and visual indicators.
Click to Purchases Credit Rating Agencies KPI Dashboard in Excel
Key Features of the Credit Rating Agencies KPI Dashboard in Excel
The dashboard contains seven structured worksheet tabs, each serving a specific purpose for seamless data management and performance analysis.
1. Home Sheet
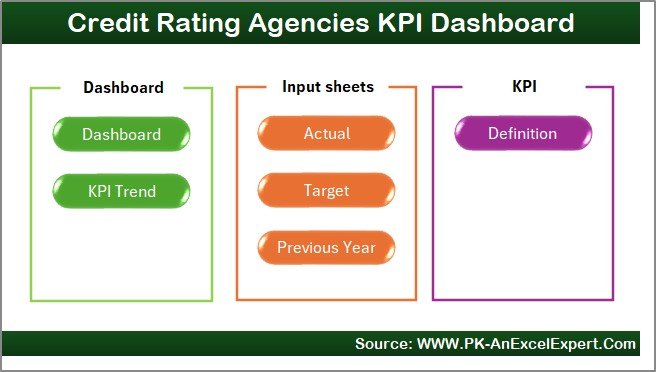
The Home sheet serves as the index page of the workbook.
Key Highlights:
-
Contains six navigation buttons that instantly take you to specific sheets.
-
Designed with a clean and professional layout for ease of use.
-
Acts as a central hub to access dashboard, trend, data input, and definition pages.
This sheet improves user experience and saves time during navigation.
2. Dashboard Sheet Tab
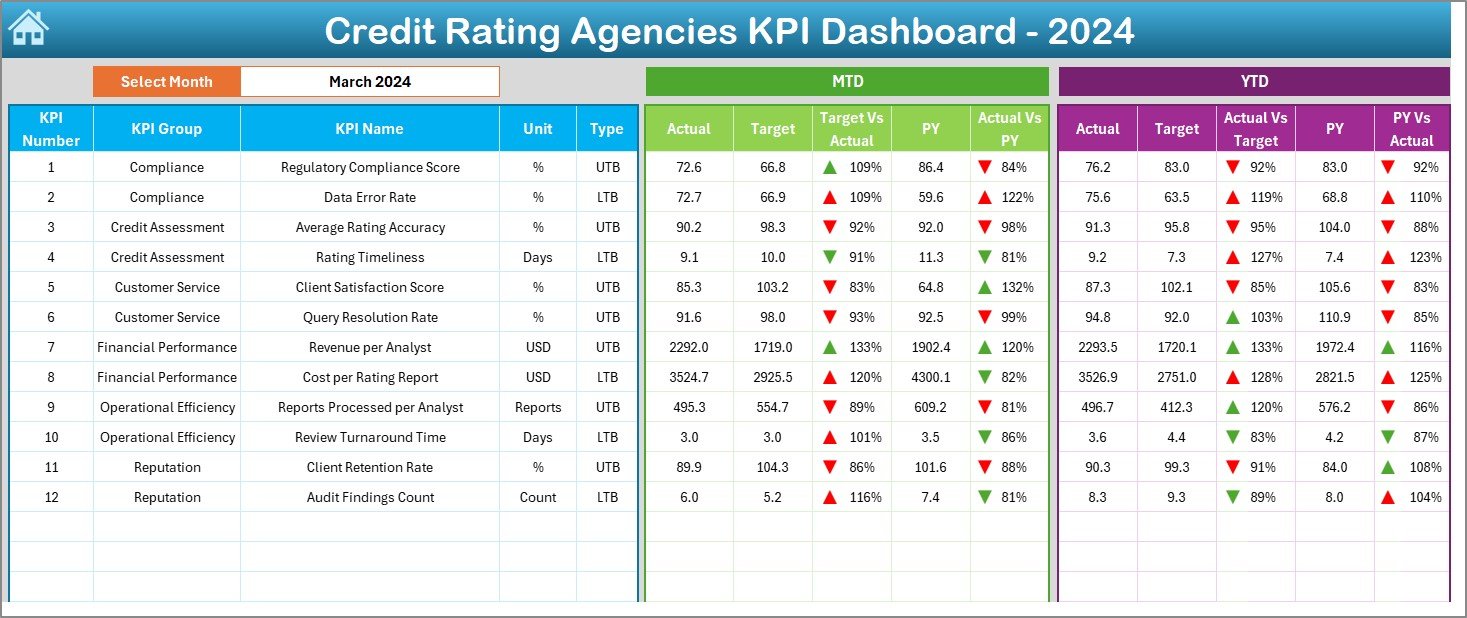
The Dashboard sheet is the heart of this Excel file. It provides a complete snapshot of KPI performance across months and years.
Key Functionalities:
-
Month Selector (Cell D3): Choose any month from the dropdown to update all dashboard numbers instantly.
-
MTD and YTD Sections:
-
Displays Actual, Target, and Previous Year (PY) data.
-
Shows comparisons through Target vs Actual and PY vs Actual.
-
Conditional formatting (↑↓ arrows) highlights performance trends.
-
-
Interactive Visuals: Quickly identify performance gaps through color-coded metrics and trend indicators.
This main sheet helps executives and analysts understand how their rating operations perform in real time.
3. KPI Trend Sheet Tab
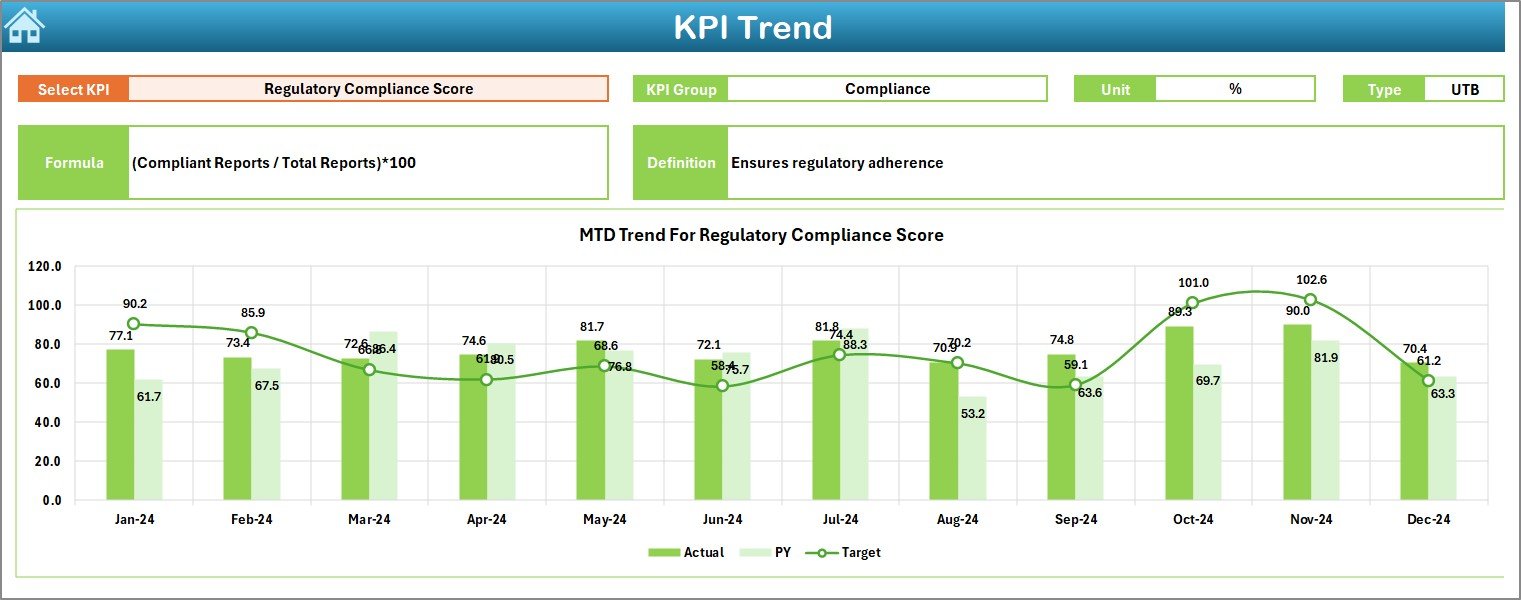
The KPI Trend sheet offers in-depth insights into how each KPI changes over time.
Features Include:
-
Dropdown Selection (Cell C3): Choose any KPI to analyze.
-
Displays KPI Group, Unit, Formula, Definition, and Type (Lower/Upper the Better).
-
MTD and YTD trend charts visualize Actual, Target, and PY data.
-
Detects performance patterns and seasonal variations easily.
This tab enables proactive monitoring of performance and timely corrective actions.
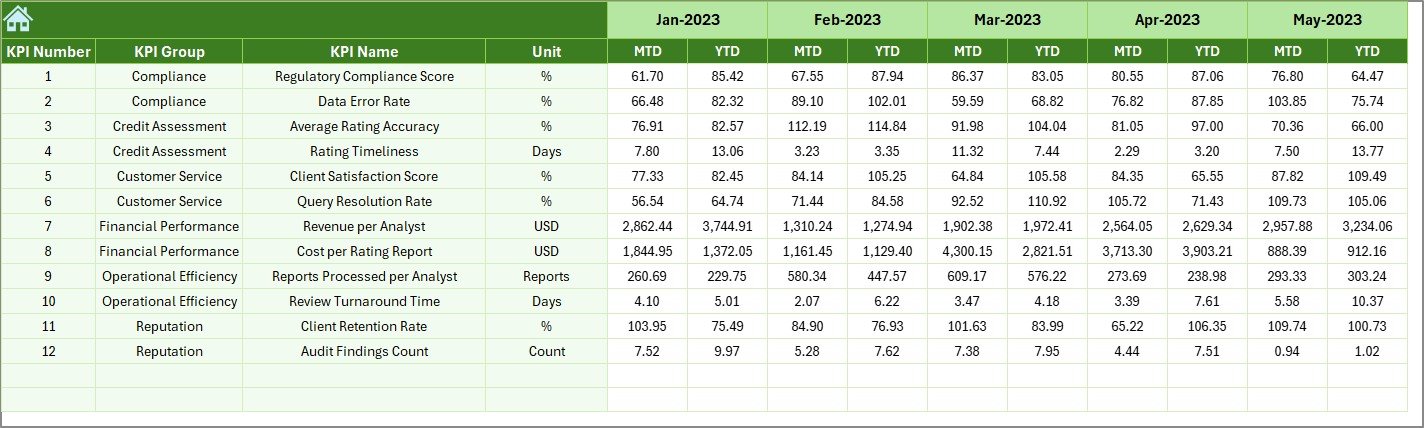
4. Actual Numbers Input Sheet
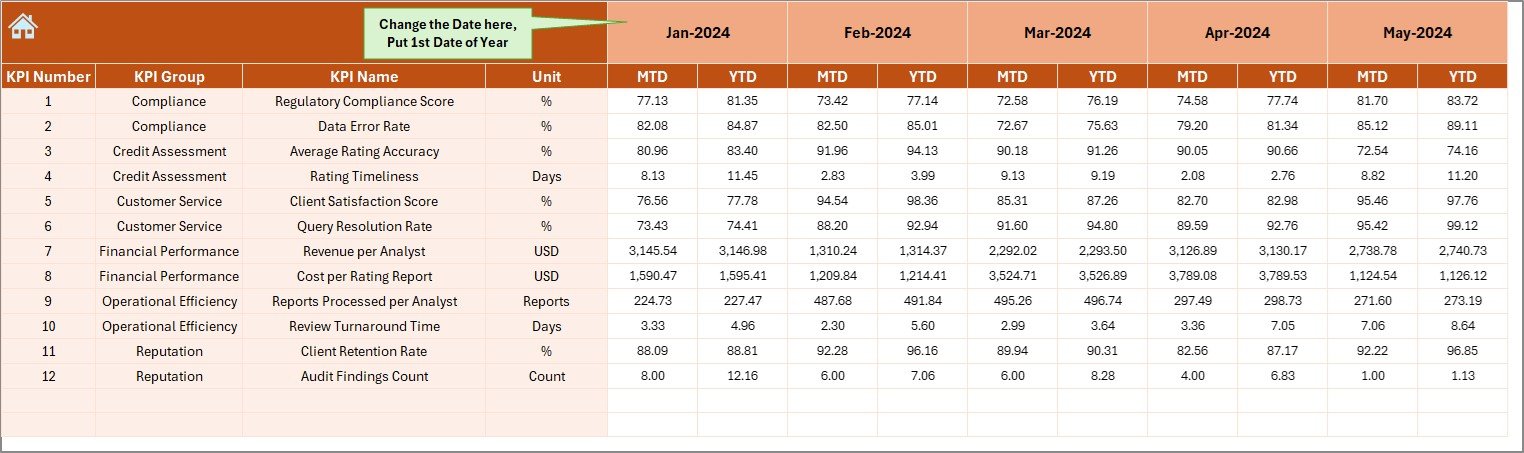
This is where you enter monthly performance data for each KPI.
Key Highlights:
-
Enter MTD and YTD actual numbers for all months.
-
Month can be set dynamically from cell E1—input the first month of your financial year.
-
As soon as you update actual values, all linked dashboards update automatically.
This sheet ensures accuracy and consistency in performance tracking.
5. Target Sheet Tab
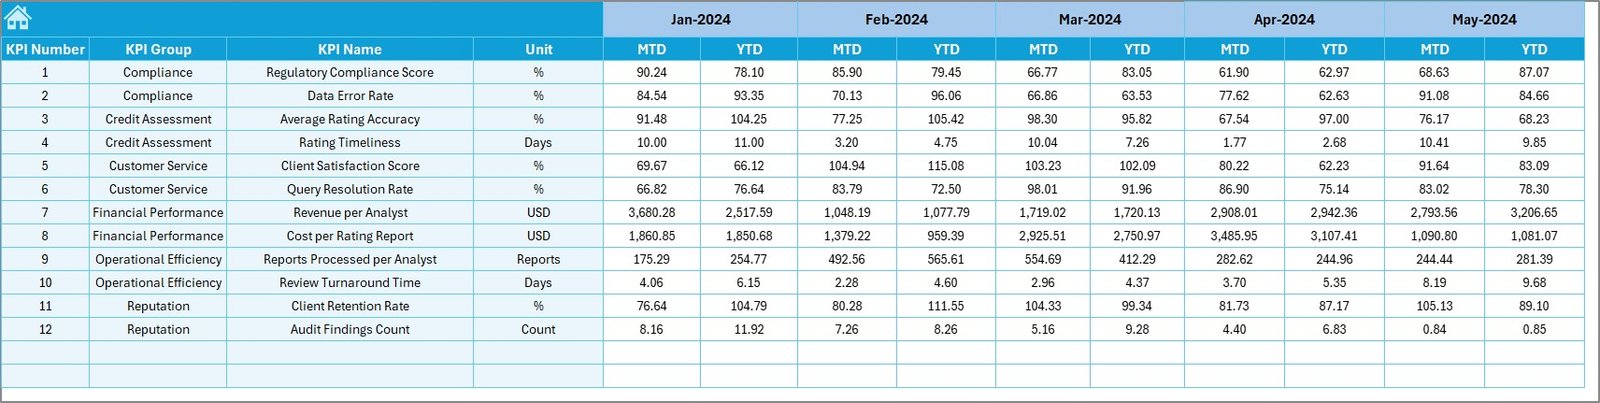
Targets serve as the benchmark for evaluation.
Key Features:
-
Enter both MTD and YTD target values for each KPI.
-
Maintain month-wise goals for the entire financial year.
-
All calculations on the Dashboard are based on these target inputs.
Setting realistic and measurable targets ensures that performance analysis is meaningful and aligned with business goals.
6. Previous Year Numbers Sheet Tab
This tab provides historical data for comparison purposes.
Functions:
-
Enter last year’s MTD and YTD data for each KPI.
-
Enables automatic calculation of PY vs Actual metrics on the Dashboard.
-
Helps visualize year-over-year growth or decline trends.
Comparing past and present performance helps identify long-term improvements and potential risks.
7. KPI Definition Sheet Tab
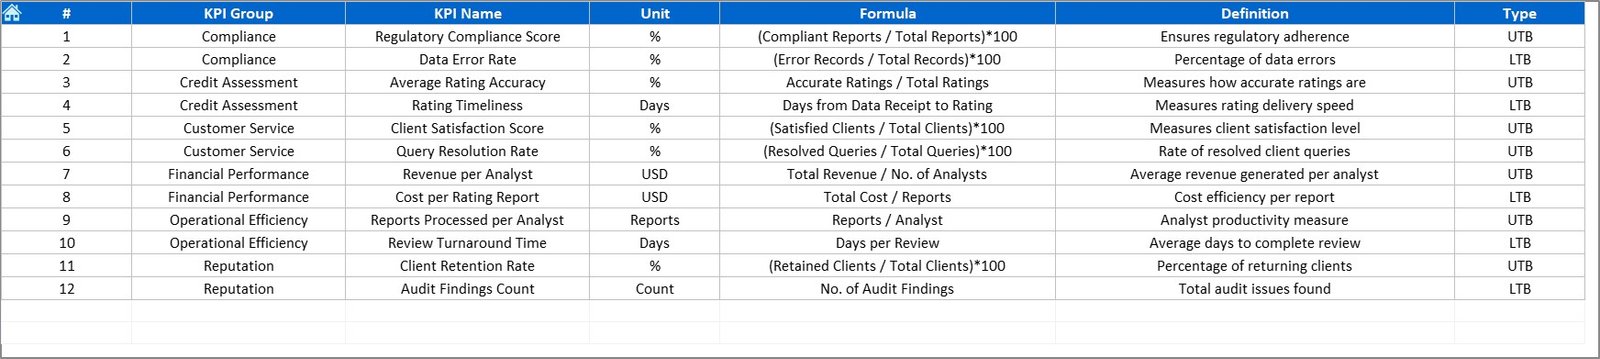
This sheet defines each KPI to ensure clarity and uniformity across all users.
Includes Columns For:
-
KPI Name
-
KPI Group
-
Unit
-
Formula
-
KPI Definition
A well-defined KPI structure ensures that everyone in the organization interprets metrics the same way.
Why Credit Rating Agencies Need a KPI Dashboard
Credit rating agencies handle vast data sets, from client details and risk profiles to financial and regulatory reports. Monitoring all these areas manually is inefficient and error-prone.
A KPI Dashboard solves this challenge by offering real-time visibility and data-driven insights into performance metrics that matter most.
Key Reasons to Use It:
-
Ensures Data Accuracy: Reduces manual calculations through automation.
-
Improves Decision-Making: Visual reports reveal trends that guide strategy.
-
Increases Accountability: Assigns clear ownership for every KPI.
-
Supports Compliance: Monitors adherence to financial regulations and policies.
-
Saves Time: Automates reporting and data visualization.
In short, it helps agencies perform smarter, faster, and more efficiently.
Click to Purchases Credit Rating Agencies KPI Dashboard in Excel
Advantages of Credit Rating Agencies KPI Dashboard in Excel
The Excel-based KPI Dashboard provides several benefits that streamline operations and improve accuracy.
1. Real-Time Insights
Track MTD and YTD performance instantly without waiting for manual reports.
2. Visual Analytics
Conditional formatting, trend charts, and comparison arrows make it easy to spot performance gaps.
3. Complete Customization
Add or modify KPIs, formulas, and visuals based on your organization’s specific needs.
4. Centralized Data Management
Consolidate all performance data in one file for easy access and control.
5. Increased Transparency
Everyone—from analysts to executives—works with the same updated performance data.
6. Cost-Effective
No need for expensive software. Excel provides a simple, scalable, and powerful alternative.
7. Compliance and Audit Readiness
Structured data and reports simplify audits and regulatory reviews.
How to Use the Credit Rating Agencies KPI Dashboard
Follow these steps to make the most of your dashboard:
Step 1: Define KPIs
Start by listing all KPIs relevant to your organization in the KPI Definition sheet.
Step 2: Input Data
Enter monthly Actual, Target, and Previous Year numbers in their respective sheets.
Step 3: Select the Month
Go to the Dashboard sheet and choose the month from the dropdown (cell D3).
Step 4: Analyze Trends
Open the KPI Trend sheet to review performance progress for each metric.
Step 5: Take Action
Identify underperforming areas and apply corrective measures to stay aligned with business objectives.
With these steps, your data transforms into meaningful insights within minutes.
Best Practices for Using the KPI Dashboard
To achieve accurate results and long-term value, follow these best practices:
-
✅ Set SMART KPIs: Ensure KPIs are Specific, Measurable, Achievable, Relevant, and Time-bound.
-
✅ Update Data Regularly: Refresh actual and target data every month.
-
✅ Validate Input Data: Avoid manual entry errors through data validation and dropdowns.
-
✅ Assign KPI Owners: Make individuals responsible for specific KPIs.
-
✅ Review Trends Monthly: Compare MTD and YTD data for consistency.
-
✅ Secure the File: Protect sheets to prevent accidental overwriting.
-
✅ Use Color Codes Wisely: Let conditional formatting visually guide attention to critical metrics.
How This Dashboard Improves Decision-Making
The Credit Rating Agencies KPI Dashboard in Excel helps leaders make faster and more confident decisions.
By analyzing KPI trends, they can answer important questions like:
-
Are rating reports being delivered on time?
-
Is our rating accuracy improving year after year?
-
Which KPIs need urgent attention to maintain compliance?
The dashboard connects data with strategy—making performance management both transparent and effective.
Integration and Scalability
This Excel dashboard can easily fit into existing business workflows.
Integration Ideas:
-
Import data directly from SQL or Power Query connections.
-
Use VBA macros for automated updates.
-
Export charts for management presentations.
Because it’s built in Excel, the dashboard is scalable, lightweight, and easy to deploy across departments.
Conclusion
The Credit Rating Agencies KPI Dashboard in Excel empowers financial institutions to track performance with accuracy, speed, and confidence.
From rating accuracy to compliance metrics, every indicator is visualized clearly through this interactive Excel dashboard. Whether you’re managing analysts, compliance teams, or client relations, this tool provides the visibility and insight you need to achieve operational excellence.
Start using it today — and turn your credit rating performance data into powerful business intelligence! 🚀
Click to Purchases Credit Rating Agencies KPI Dashboard in Excel
Frequently Asked Questions (FAQs)
1. What is a Credit Rating Agencies KPI Dashboard?
It’s an Excel-based tool that tracks and visualizes performance metrics like rating accuracy, turnaround time, and compliance adherence.
2. How many KPIs should a credit rating agency track?
You can track around 10–15 KPIs for balanced and clear performance monitoring.
3. Can I customize the KPIs in this dashboard?
Yes. The template allows you to modify or add KPIs according to your agency’s needs.
4. Do I need advanced Excel skills to use it?
No. The dashboard is designed for simplicity, with pre-set formulas and dropdowns.
5. How often should I update the data?
Monthly updates are recommended to ensure fresh and accurate results.
6. Can this dashboard help during audits?
Yes. It provides transparent and well-organized performance records suitable for audit reviews.
7. Is this suitable for small and large credit rating agencies?
Absolutely. The dashboard scales easily for teams of any size.
8. What’s the benefit of using MTD and YTD tracking?
MTD (Month-to-Date) highlights short-term progress, while YTD (Year-to-Date) gives a cumulative annual view.
Click to Purchases Credit Rating Agencies KPI Dashboard in Excel
Visit our YouTube channel to learn step-by-step video tutorials