Customer relationships drive modern business growth. However, CRM development teams often struggle to measure performance clearly. They manage multiple metrics, track targets, monitor customer data, and report to management. Still, scattered Excel sheets and manual reports slow everything down.
So, how can CRM teams track performance in one structured system?
The answer is simple.
Click to Purchases CRM Development KPI Dashboard in Excel
You need a CRM Development KPI Dashboard in Excel.
In this detailed guide, you will learn:
-
What a CRM Development KPI Dashboard in Excel is
-
Why CRM teams need structured KPI tracking
-
Complete explanation of all 7 worksheets
-
Advantages of CRM Development KPI Dashboard in Excel
-
Best Practices for the CRM Development KPI Dashboard
-
Frequently Asked Questions with Answers
Let us explore everything step by step.
What Is a CRM Development KPI Dashboard in Excel?
A CRM Development KPI Dashboard in Excel is a ready-to-use performance tracking template designed specifically for CRM development teams.
It helps you:
-
Track Month-to-Date (MTD) and Year-to-Date (YTD) performance
-
Compare Actual vs Target values
-
Analyze Previous Year (PY) comparisons
-
Monitor CRM performance trends
-
Measure productivity and efficiency
-
Make faster, data-driven decisions
Instead of juggling multiple reports, you can centralize all CRM KPIs in one interactive dashboard.
As a result, leadership gains clarity. Moreover, teams focus on improvement instead of manual reporting.
Why Do CRM Development Teams Need a KPI Dashboard?
CRM systems manage leads, sales pipelines, customer data, automation, and reporting. Therefore, performance measurement becomes critical.
However, many teams face these problems:
-
They rely on manual tracking
-
They update numbers in different sheets
-
They miss important trends
-
They struggle to compare actual vs target
-
They cannot easily analyze yearly performance
Consequently, decision-making becomes slow and reactive.
On the other hand, when you use a structured CRM Development KPI Dashboard in Excel, you gain:
-
Real-time visibility
-
Centralized KPI monitoring
-
Automated comparisons
-
Trend analysis
-
Clear accountability
Therefore, performance improves consistently.
What Are the Key Features of CRM Development KPI Dashboard in Excel?
This dashboard contains 7 powerful worksheets, and each sheet plays a specific role.
Let us understand each one clearly.
1️⃣ Home Sheet – The Navigation Hub
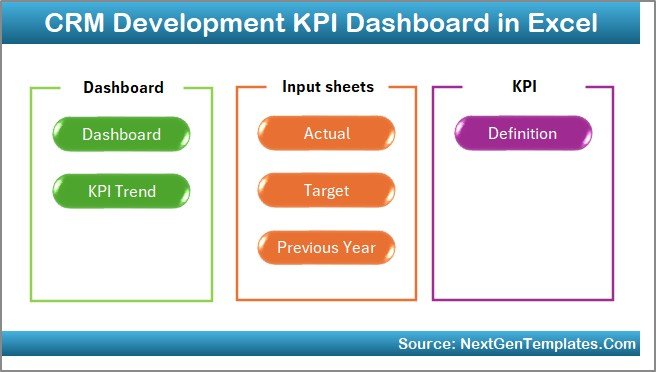
The Home sheet works as an index page.
Here, you will find 6 navigation buttons that help you jump to different sheets instantly.
Because of this structure:
-
Users save time
-
Reporting becomes simple
-
Navigation feels professional
-
The dashboard looks structured
Instead of scrolling through multiple sheets, you move with one click.
Click to Purchases CRM Development KPI Dashboard in Excel
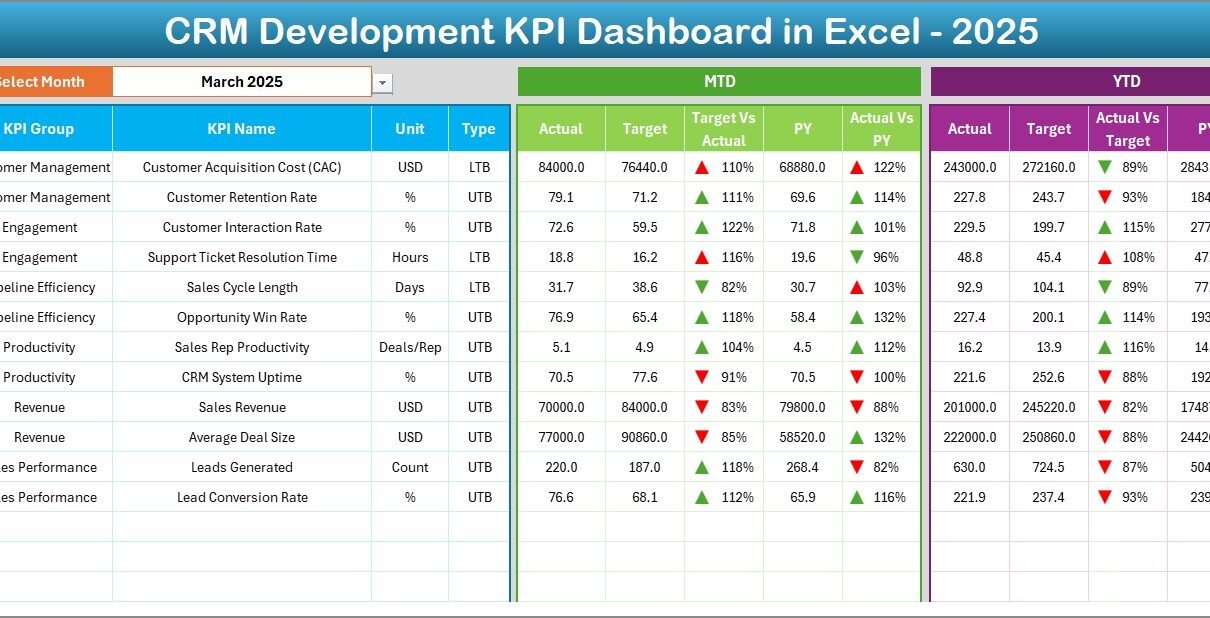
2️⃣ Dashboard Sheet – The Main Performance Page
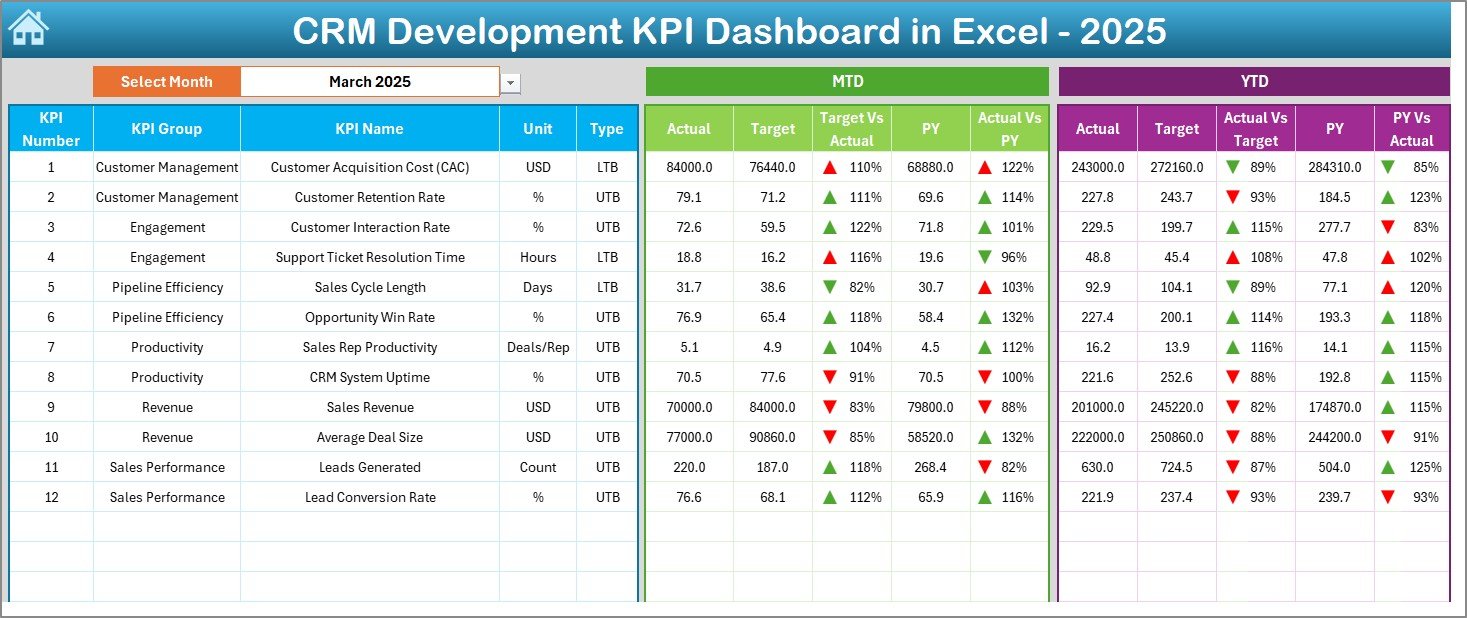
This sheet acts as the heart of the CRM Development KPI Dashboard.
🔹 Month Selector (Cell D3)
On range D3, you can select any month from a drop-down list.
As soon as you change the month:
-
Entire dashboard numbers update automatically
-
MTD figures refresh
-
YTD figures recalculate
-
Comparisons adjust instantly
Therefore, you get dynamic reporting without manual work.
🔹 MTD Performance Tracking
The dashboard displays:
-
MTD Actual
-
MTD Target
-
MTD Previous Year
-
Target vs Actual comparison
-
Previous Year vs Actual comparison
Moreover, the system uses conditional formatting with up and down arrows.
So:
-
Green arrow indicates strong performance
-
Red arrow shows performance gaps
This visual structure helps leadership understand performance in seconds.
🔹 YTD Performance Tracking
In addition to MTD, the dashboard also displays:
-
YTD Actual
-
YTD Target
-
YTD Previous Year
-
Target vs Actual
-
PY vs Actual
Therefore, you track both short-term and long-term performance simultaneously.
3️⃣ KPI Trend Sheet – Deep Performance Analysis
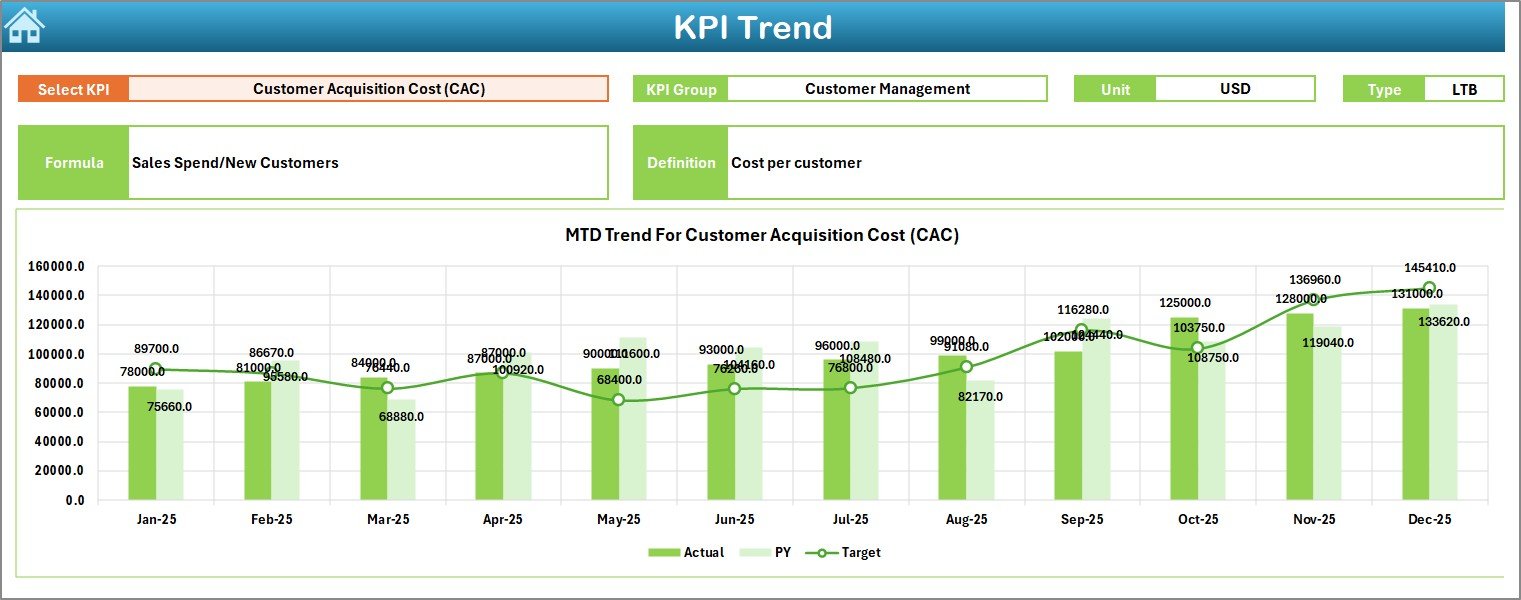
The KPI Trend sheet allows deeper analysis.
🔹 KPI Selection (Cell C3)
On range C3, you can select any KPI from the drop-down list.
Once selected, the sheet displays:
-
KPI Group
-
KPI Unit
-
KPI Type (Lower the Better or Upper the Better)
-
KPI Formula
-
KPI Definition
Because of this, users understand what they measure.
🔹 MTD and YTD Trend Charts
The sheet also shows:
-
MTD trend chart
-
YTD trend chart
-
Actual vs Target vs Previous Year lines
Therefore, you can:
-
Identify performance trends
-
Spot seasonal patterns
-
Detect sudden drops
-
Plan improvements
Trend visualization transforms raw data into insight.
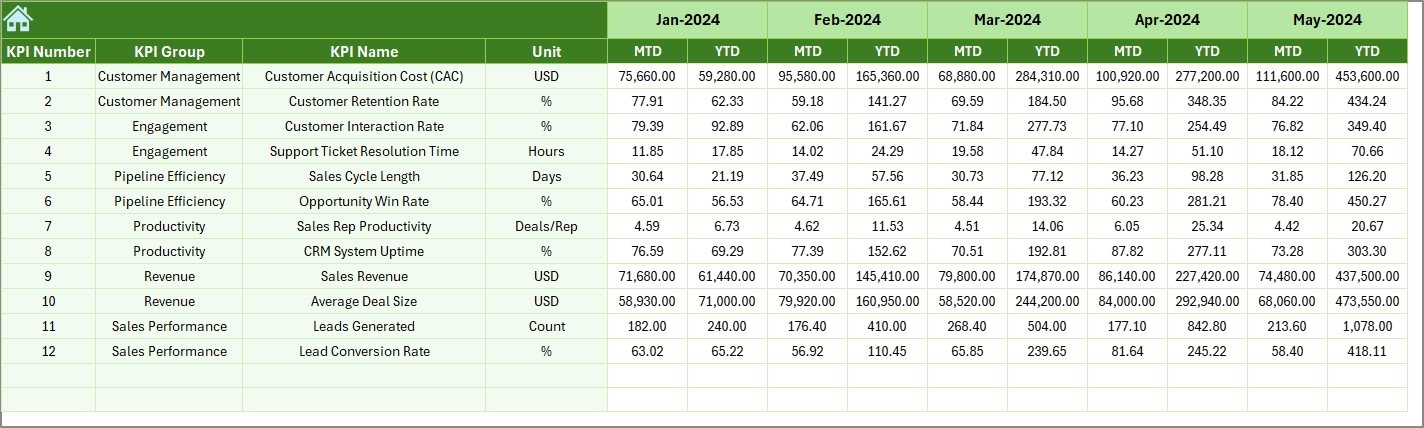
4️⃣ Actual Numbers Input Sheet – Data Entry Page
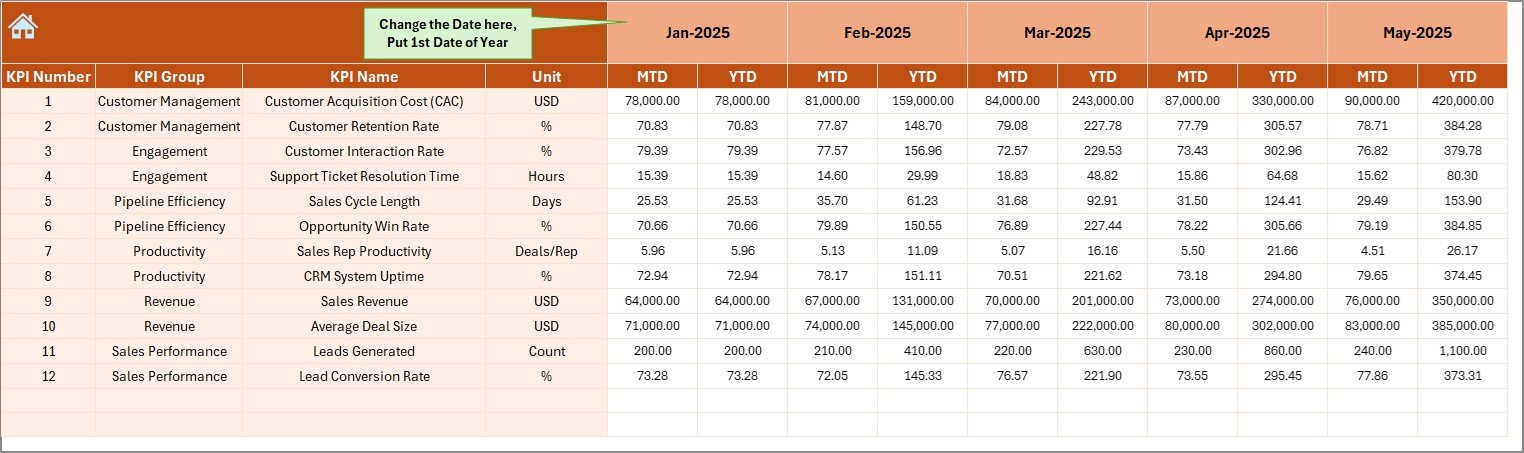
This sheet allows you to enter actual performance numbers.
🔹 Month Control (Cell E1)
On range E1, you enter the first month of the year.
Once set:
-
Entire structure adjusts automatically
-
Month references update
Then, you simply enter:
-
MTD values
-
YTD values
Therefore, data entry becomes systematic and controlled.
Click to Purchases CRM Development KPI Dashboard in Excel
5️⃣ Target Sheet – Goal Management
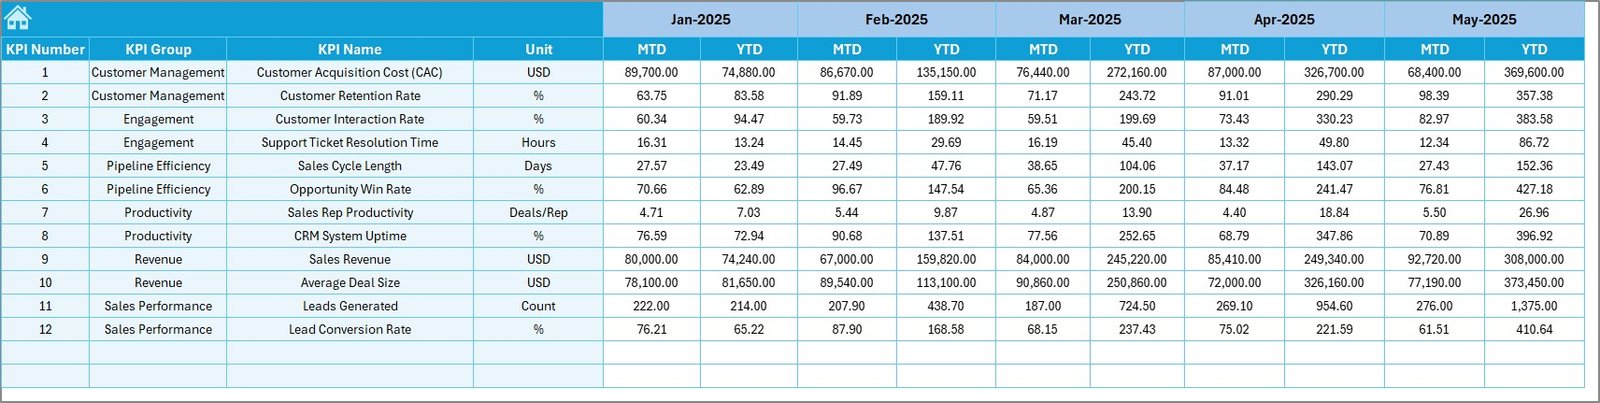
In this sheet, you enter:
-
Monthly MTD Targets
-
Monthly YTD Targets
Because you define targets clearly:
-
Teams stay accountable
-
Performance comparisons become accurate
-
Management evaluates success easily
Targets give direction. Without targets, numbers have no meaning.
6️⃣ Previous Year Number Sheet – Historical Comparison
Here, you enter previous year data in the same format as current year.
As a result:
-
You compare year-on-year performance
-
You measure growth
-
You detect decline
-
You understand long-term trends
Historical comparison drives strategic decisions.
7️⃣ KPI Definition Sheet – KPI Structure Page
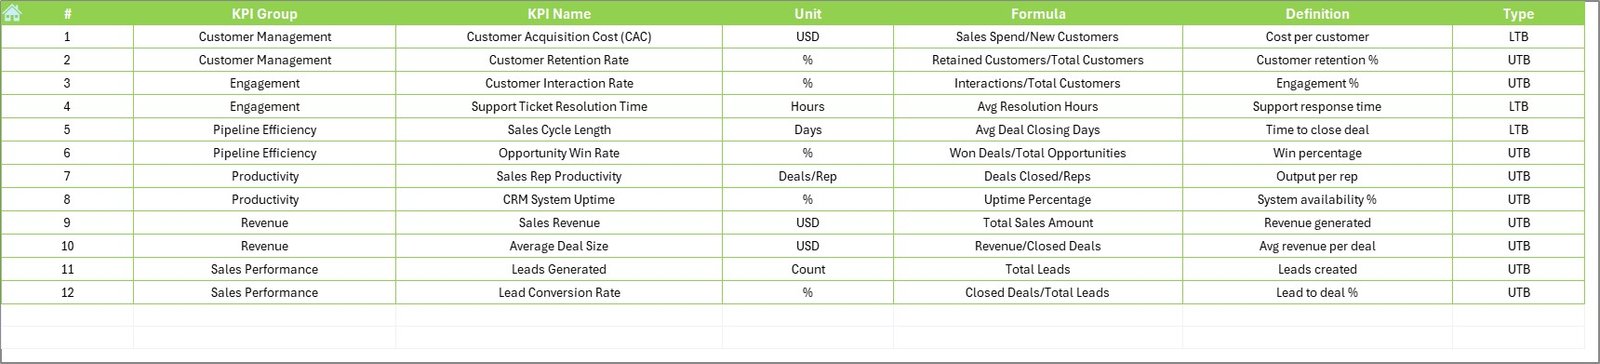
This sheet defines the entire KPI framework.
You enter:
-
KPI Name
-
KPI Group
-
KPI Unit
-
KPI Formula
-
KPI Definition
-
KPI Type (LTB or UTB)
Because of this structured design:
-
Users understand KPI logic
-
Reports stay consistent
-
Audit becomes easy
-
Standardization improves
A strong KPI foundation ensures reliable reporting.
Which KPIs Can You Track in CRM Development KPI Dashboard?
You can track various CRM development metrics such as:
-
Lead Conversion Rate
-
Customer Acquisition Cost
-
Customer Retention Rate
-
CRM System Uptime
-
Average Response Time
-
Ticket Resolution Time
-
Sales Pipeline Value
-
Customer Lifetime Value
-
Data Accuracy Rate
-
Automation Success Rate
-
User Adoption Rate
-
Revenue per Customer
Therefore, the dashboard supports both technical and business metrics.
Advantages of CRM Development KPI Dashboard in Excel
Click to Purchases CRM Development KPI Dashboard in Excel
Now, let us explore the key benefits.
1️⃣ Centralized KPI Monitoring
Instead of using multiple sheets, you track everything in one file.
2️⃣ Dynamic Month Selection
Because of drop-down functionality, reports update instantly.
3️⃣ MTD & YTD Tracking
You measure both short-term and long-term progress.
4️⃣ Visual Performance Indicators
Up and down arrows highlight performance quickly.
5️⃣ Year-on-Year Comparison
Historical comparison improves strategy planning.
6️⃣ Easy Customization
You can modify KPIs, targets, and definitions easily.
7️⃣ No Complex Software Required
You only need Microsoft Excel.
Therefore, this dashboard offers powerful analytics without expensive tools.
How Does This Dashboard Improve CRM Performance?
When teams measure performance clearly, they improve faster.
Because this dashboard:
-
Identifies weak KPIs
-
Highlights achievement gaps
-
Encourages accountability
-
Tracks growth trends
-
Supports monthly review meetings
Management can take immediate corrective actions.
As a result, CRM efficiency increases consistently.
Best Practices for the CRM Development KPI Dashboard
To maximize results, follow these best practices.
✔ Define KPIs Clearly
First, select KPIs that align with business goals.
✔ Update Data Monthly
Consistency improves reliability. Therefore, update data regularly.
✔ Review Trends, Not Just Numbers
Trend charts reveal performance direction.
✔ Compare with Previous Year
Year-on-year analysis supports strategic planning.
✔ Avoid Overloading KPIs
Too many KPIs create confusion. Focus on key drivers.
✔ Validate Data Accuracy
Incorrect data leads to wrong decisions.
✔ Conduct Monthly Review Meetings
Use dashboard insights to drive team discussions.
When you follow these practices, performance tracking becomes powerful and practical.
Who Should Use CRM Development KPI Dashboard in Excel?
This dashboard suits:
-
CRM Development Teams
-
Sales Operations Managers
-
CRM Analysts
-
Business Intelligence Teams
-
SaaS Companies
-
Marketing Teams
-
Startup Founders
-
Enterprise CRM Administrators
Therefore, any organization using CRM systems can benefit.
Why Choose Excel for CRM KPI Tracking?
Although many BI tools exist, Excel offers:
-
Familiar interface
-
Easy customization
-
No additional licensing cost
-
Fast implementation
-
Offline accessibility
-
Flexible formulas
-
Quick sharing
Therefore, Excel remains a powerful business intelligence tool when structured properly.
Conclusion
CRM development requires continuous monitoring. However, manual tracking slows teams down and creates confusion.
On the other hand, a CRM Development KPI Dashboard in Excel centralizes performance data, simplifies reporting, and improves decision-making.
Because it offers:
-
Dynamic month selection
-
MTD and YTD tracking
-
Target vs Actual comparison
-
Previous Year analysis
-
KPI trend visualization
-
Structured data entry sheets
Teams gain clarity, leadership gains insight, and performance improves.
If you want structured CRM KPI management without expensive tools, this ready-to-use dashboard delivers exactly what you need.
Frequently Asked Questions with Answers
1️⃣ What is a CRM Development KPI Dashboard in Excel?
It is a structured Excel template that tracks CRM performance metrics like MTD, YTD, Target vs Actual, and Previous Year comparison.
2️⃣ Can I customize KPIs in this dashboard?
Yes. You can modify KPI definitions, groups, targets, and formulas easily.
3️⃣ Does the dashboard support trend analysis?
Yes. The KPI Trend sheet displays MTD and YTD charts for Actual, Target, and Previous Year data.
4️⃣ Is Excel enough for CRM KPI tracking?
Yes. When structured properly, Excel provides dynamic, professional performance tracking.
5️⃣ How often should I update the dashboard?
You should update data monthly to maintain accuracy and relevance.
6️⃣ Can small businesses use this dashboard?
Yes. Small businesses and startups can benefit greatly because the dashboard does not require expensive BI software.
Visit our YouTube channel to learn step-by-step video tutorials