In today’s competitive business world, CRM development teams must track performance clearly and consistently. However, many teams still depend on scattered Excel sheets and manual reports. As a result, leaders struggle to measure productivity, customer engagement, delivery timelines, and revenue impact.
So, how can CRM teams gain full visibility into performance?
The answer is simple.
You need a CRM Development KPI Dashboard in Power BI.
Click to Purchases CRM Development KPI Dashboard in Power BI
This ready-to-use dashboard transforms raw Excel data into interactive insights. Moreover, it allows CRM managers, business heads, and leadership teams to monitor Month-to-Date (MTD) and Year-to-Date (YTD) performance instantly. Instead of spending hours preparing reports, you can focus on improving results.
Let us explore everything in detail.
What Is a CRM Development KPI Dashboard in Power BI?
A CRM Development KPI Dashboard in Power BI is a structured performance tracking system designed specifically for CRM development teams. It connects with an Excel data source and converts numbers into visual insights.
Instead of reviewing long spreadsheets, you can:
-
Track MTD and YTD performance
-
Compare Actual vs Target instantly
-
Analyze Previous Year (PY) performance
-
Identify underperforming KPIs
-
Drill through to detailed KPI definitions
Therefore, this dashboard works as a performance control center for CRM teams.
Why Do CRM Development Teams Need a KPI Dashboard?
CRM development projects involve multiple metrics. Teams track lead conversion, feature delivery, bug resolution, system uptime, customer retention, and revenue impact. However, when teams store data in different files, confusion increases.
Consequently, decision-making slows down.
On the other hand, a Power BI dashboard:
-
Centralizes all KPIs in one place
-
Updates numbers dynamically
-
Improves data visibility
-
Supports faster decision-making
-
Highlights performance gaps clearly
As a result, teams act quickly and improve productivity.
Key Features of CRM Development KPI Dashboard in Power BI
This dashboard includes three structured pages inside the Power BI Desktop file. Each page serves a specific purpose.
Click to Purchases CRM Development KPI Dashboard in Power BI
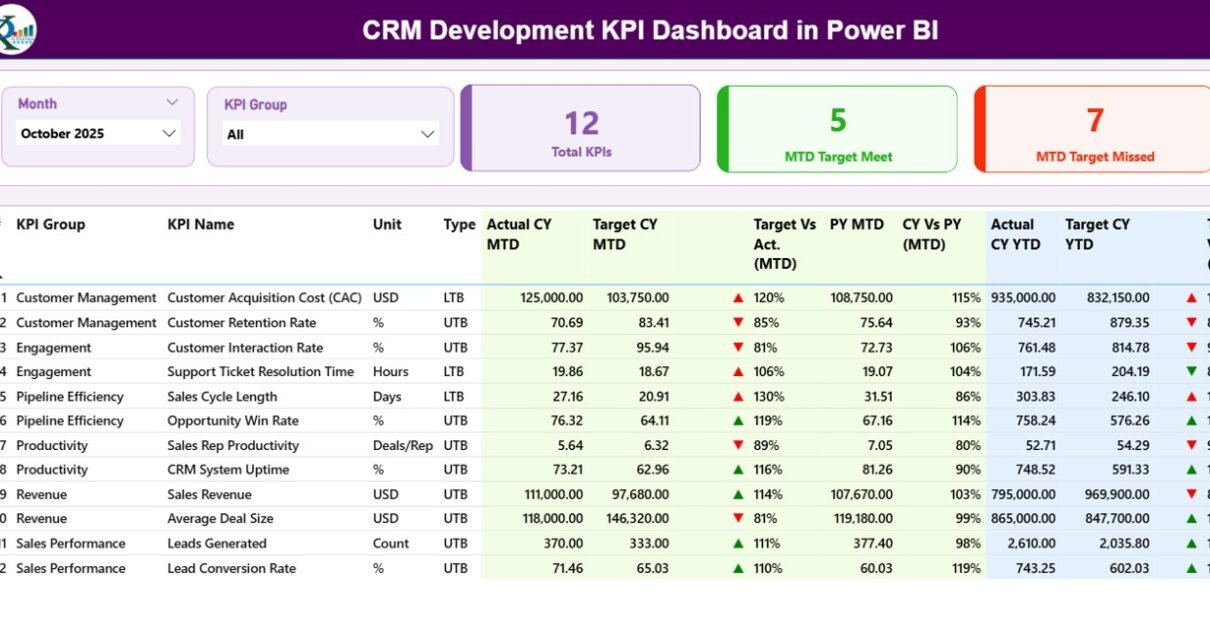
1️⃣ Summary Page – The Main Control Panel
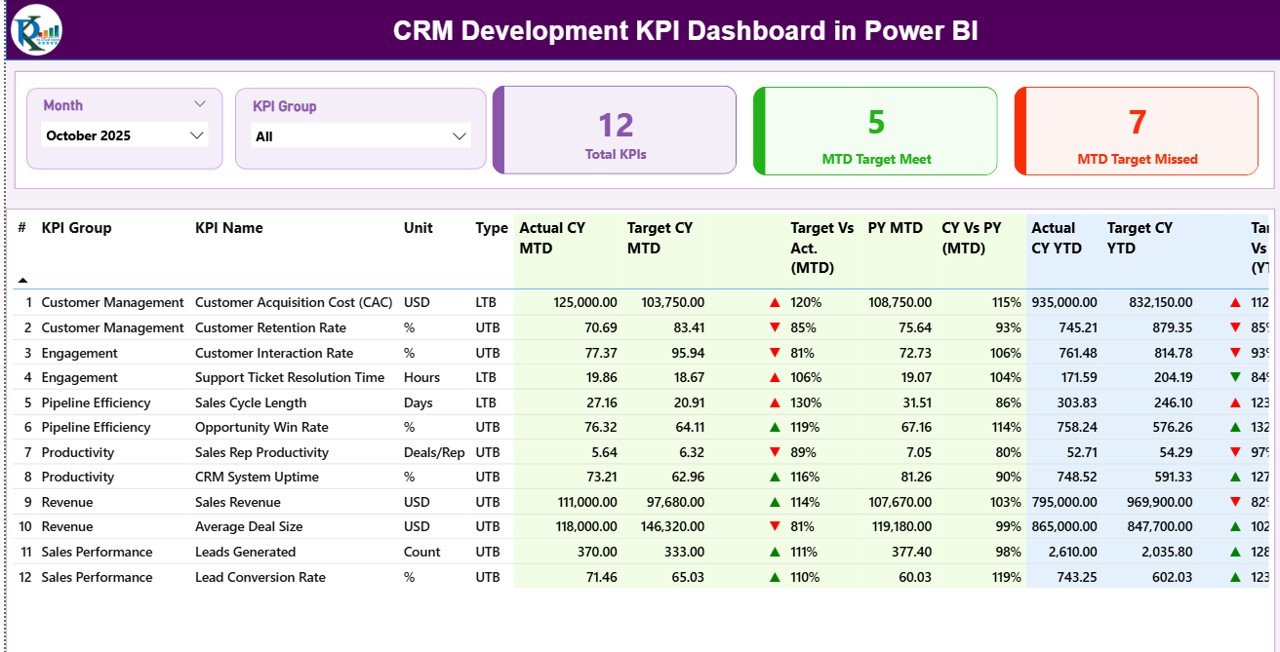
The Summary Page works as the core of the dashboard. Here, you can view all KPIs in one structured layout.
What Do You See at the Top?
-
Month Slicer – Select any month.
-
KPI Group Slicer – Filter by KPI category.
Therefore, you can customize the entire dashboard view instantly.
KPI Performance Cards
At the top, you will see three powerful cards:
-
Total KPIs Count
-
MTD Target Meet Count
-
MTD Target Missed Count
These cards immediately show overall performance status.
Detailed KPI Table – Complete Performance View
Below the cards, you can view a structured KPI table. This table includes:
-
KPI Number – Sequence number
-
KPI Group – KPI category
-
KPI Name – KPI title
-
Unit – Measurement unit
-
Type – LTB (Lower the Better) or UTB (Upper the Better)
MTD Section
The dashboard shows the following MTD values:
-
Actual CY MTD – Current Year actual MTD
-
Target CY MTD – Target value for MTD
-
MTD Icon (▲▼) – Visual indicator with green/red color
-
Target Vs Act. (MTD) – Formula:
Actual MTD / Target MTD -
PY MTD – Previous Year MTD value
-
CY Vs PY (MTD) – Formula:
Current Year MTD / Previous Year MTD
Therefore, you can instantly identify performance improvement or decline.
YTD Section
Similarly, the dashboard shows YTD metrics:
-
Actual CY YTD
-
Target CY YTD
-
YTD Icon (▲▼)
-
Target Vs Act. (YTD)
Formula:Actual YTD / Target YTD -
PY YTD
-
CY Vs PY (YTD)
Formula:Current Year YTD / Previous Year YTD
As a result, leaders can track long-term performance trends clearly.
2️⃣ KPI Trend Page – Visual Performance Analysis
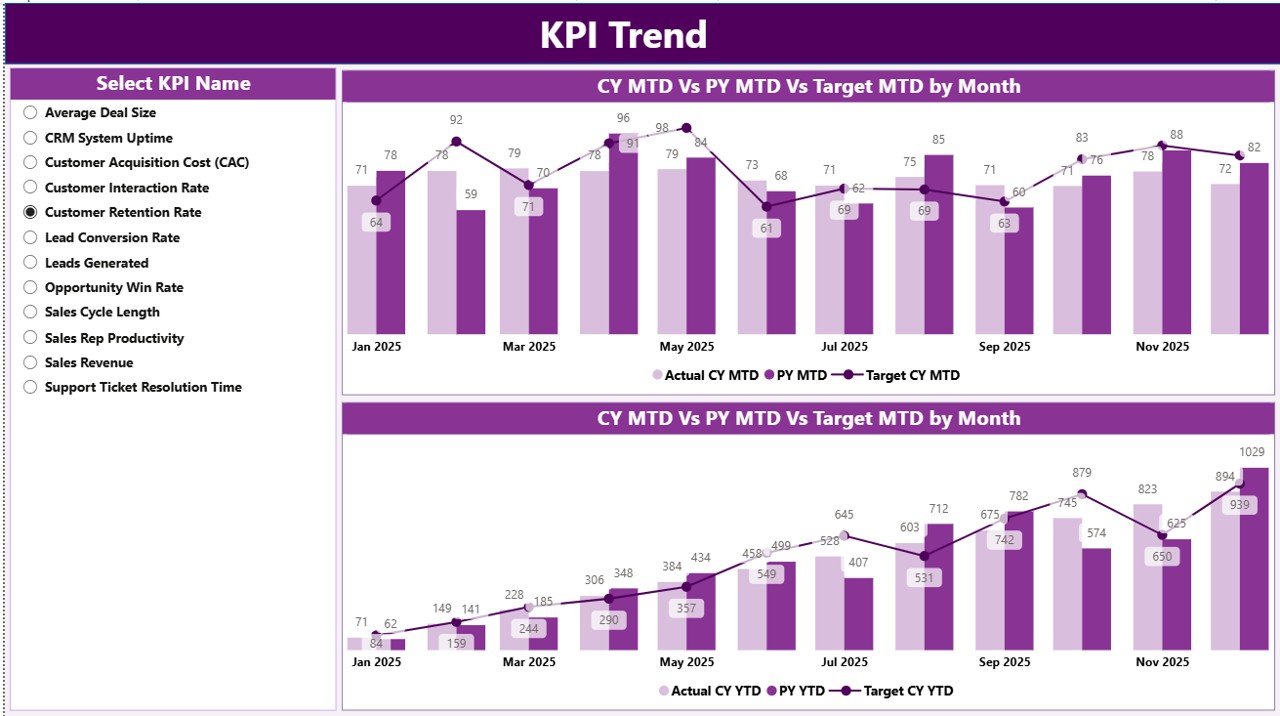
The KPI Trend Page focuses on graphical insights.
Here, you can:
-
Select a specific KPI using the slicer
-
View MTD combo chart
-
View YTD combo chart
Each combo chart displays:
-
Current Year Actual
-
Previous Year Actual
-
Target Values
Therefore, you can compare trends visually. Moreover, you can identify seasonal patterns and growth movements easily.
3️⃣ KPI Definition Page – Drill Through Details
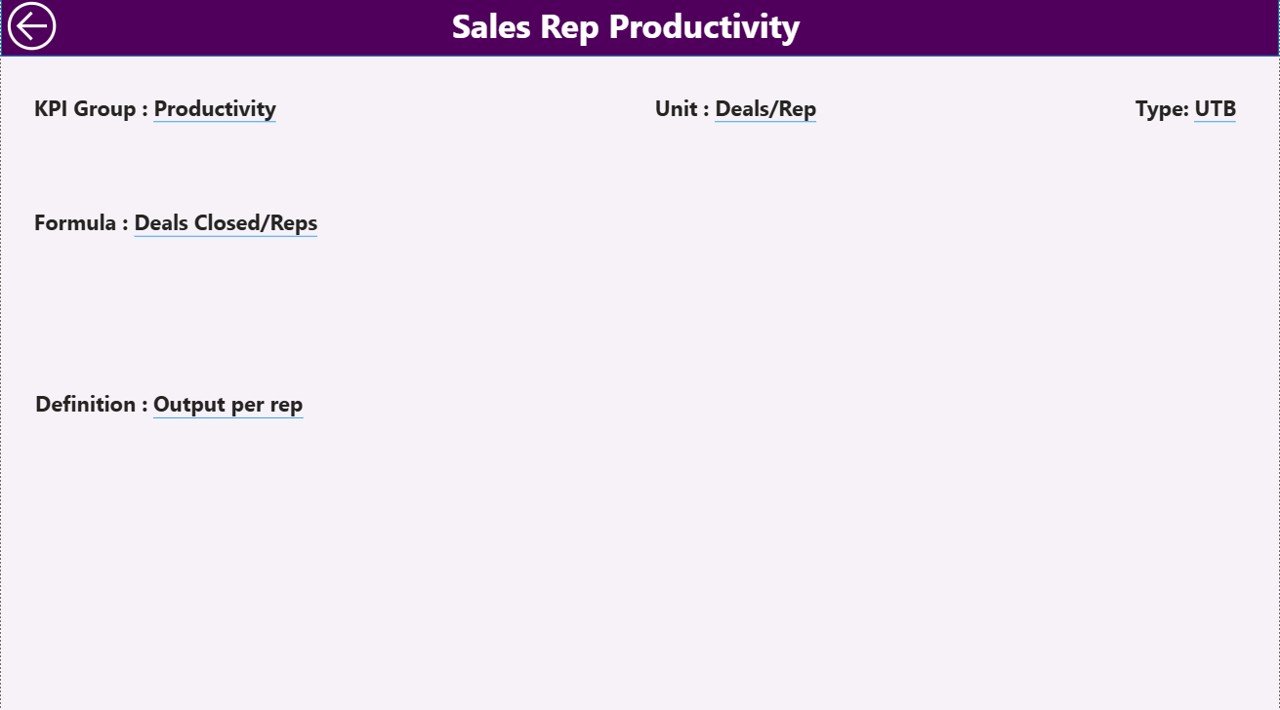
This page works as a drill-through page. Although it remains hidden, you can access it from the Summary page.
Here, you can view:
-
KPI Formula
-
KPI Definition
-
KPI Type (LTB or UTB)
To return, simply click the Back button at the top left corner.
As a result, the dashboard maintains clarity and simplicity.
Excel Data Source – Structured Data Input
The dashboard connects with an Excel file. Therefore, data entry remains simple and controlled.
The Excel file contains three worksheets.
1️⃣ Input_Actual Sheet
Here, you enter:
-
KPI Name
-
Month (use first date of month)
-
MTD number
-
YTD number
Therefore, you only update actual performance values.
2️⃣ Input_Target Sheet
Here, you enter:
-
KPI Name
-
Month
-
MTD Target
-
YTD Target
As a result, the dashboard compares performance against goals automatically.
3️⃣ KPI Definition Sheet
In this sheet, you define:
-
KPI Number
-
KPI Group
-
KPI Name
-
Unit
-
Formula
-
Definition
-
Type (LTB or UTB)
Consequently, the dashboard stays structured and consistent.
Click to Purchases CRM Development KPI Dashboard in Power BI
What KPIs Can You Track in CRM Development?
You can track multiple performance areas such as:
Financial KPIs
-
CRM Revenue Growth
-
Cost per Lead
-
Development Cost per Feature
Operational KPIs
-
Feature Delivery Time
-
Bug Resolution Time
-
System Uptime %
Customer KPIs
-
Customer Retention Rate
-
Lead Conversion Rate
-
Customer Satisfaction Score
Productivity KPIs
-
Developer Utilization %
-
Sprint Completion Rate
Therefore, this dashboard supports both strategic and operational tracking.
Advantages of CRM Development KPI Dashboard in Power BI
Why Should You Use This Dashboard?
1️⃣ Centralized Reporting
You can manage all CRM KPIs in one dashboard.
2️⃣ Real-Time Insights
You can update Excel data and refresh Power BI instantly.
3️⃣ Clear Visual Indicators
The ▲ and ▼ icons highlight performance gaps immediately.
4️⃣ Improved Decision-Making
You can identify weak KPIs and take action quickly.
5️⃣ Easy Filtering
You can analyze data by month or KPI group.
6️⃣ Drill-Through Capability
You can check KPI formulas and definitions easily.
7️⃣ Long-Term Performance Tracking
You can monitor YTD performance alongside MTD.
Therefore, this dashboard increases clarity, speed, and accountability.
Best Practices for the CRM Development KPI Dashboard
To maximize results, follow these best practices.
✔ Define Clear KPIs
Select KPIs that align with CRM goals.
✔ Maintain Data Accuracy
Update Excel sheets consistently.
✔ Use Proper KPI Types
Classify KPIs correctly as LTB or UTB.
✔ Review Dashboard Monthly
Analyze performance regularly.
✔ Focus on Target Gaps
Take corrective action when targets miss.
✔ Avoid Data Overload
Track only meaningful KPIs.
✔ Train Your Team
Ensure managers understand KPI calculations.
As a result, you will improve CRM performance continuously.
How Does This Dashboard Improve CRM Team Performance?
This dashboard improves visibility. Moreover, it reduces reporting time. Therefore, managers spend more time on strategy.
Additionally, it creates accountability. When teams see performance clearly, they focus on improvement.
Furthermore, it supports data-driven culture. Instead of guessing, teams act based on numbers.
Who Should Use CRM Development KPI Dashboard in Power BI?
Click to Purchases CRM Development KPI Dashboard in Power BI
This dashboard suits:
-
CRM Development Managers
-
Project Managers
-
Business Analysts
-
CTOs
-
CRM Product Owners
-
Senior Management Teams
Therefore, any organization running CRM development projects can benefit from this tool.
How to Implement the CRM Development KPI Dashboard?
Follow these steps:
-
Define KPIs clearly.
-
Prepare Excel data sheets.
-
Enter actual and target values.
-
Connect Excel to Power BI.
-
Refresh the dashboard.
-
Review monthly performance.
Consequently, you will create a structured reporting system quickly.
Conclusion
CRM development teams must measure performance consistently. However, manual reporting creates delays and confusion.
Therefore, the CRM Development KPI Dashboard in Power BI offers a structured, interactive, and efficient solution. It centralizes KPIs, tracks MTD and YTD performance, compares targets, and highlights gaps clearly.
Moreover, it supports better decision-making and improves accountability. As a result, organizations can optimize CRM performance and drive growth.
If you want clarity, control, and performance improvement, this dashboard provides the perfect solution.
Frequently Asked Questions (FAQs)
1️⃣ What is a CRM Development KPI Dashboard in Power BI?
It is an interactive dashboard that tracks CRM performance using Power BI connected to Excel data.
2️⃣ What is the difference between MTD and YTD?
MTD shows performance for the current month. YTD shows cumulative performance from the start of the year.
3️⃣ What does LTB and UTB mean?
LTB means Lower the Better (e.g., bug resolution time).
UTB means Upper the Better (e.g., revenue growth).
4️⃣ Can I customize the KPIs?
Yes. You can modify the KPI Definition sheet and adjust KPIs based on your needs.
5️⃣ Do I need advanced Power BI skills?
No. Since this dashboard is ready to use, you only need basic refresh knowledge.
6️⃣ How often should I update the data?
You should update data monthly. However, you can update weekly if required.
7️⃣ Can this dashboard support multiple KPI groups?
Yes. You can categorize KPIs by Financial, Operational, Customer, or Productivity groups.
Visit our YouTube channel to learn step-by-step video tutorials