Managing debt effectively has become extremely important for organizations, financial institutions, and even individuals. Businesses often rely on loans, credit facilities, and other financing options to support operations and growth. However, without proper monitoring, debt levels can quickly become difficult to control. Therefore, organizations need a structured way to track financial obligations and measure performance.
A Debt Management KPI Scorecard in Excel provides a practical solution for monitoring financial performance related to debt. It allows managers to evaluate repayment efficiency, track financial health, and monitor important indicators such as debt ratios, payment timelines, and outstanding balances.
In this article, we have created a Debt Management KPI Scorecard in Excel, which is a ready-to-use template designed to help organizations monitor their debt-related performance indicators effectively. Because the template combines structured KPI tracking with visual indicators, decision-makers can easily evaluate financial health and take timely actions.
Throughout this article, you will learn everything about the Debt Management KPI Scorecard in Excel, including its features, benefits, best practices, and implementation strategies.
Click to buy Debt Management KPI Scorecard in Excel
What is a Debt Management KPI Scorecard in Excel?
A Debt Management KPI Scorecard in Excel is a structured financial monitoring tool that helps organizations track key performance indicators related to debt management.
It collects financial data, compares actual performance with targets, and displays results through visual indicators such as charts and conditional formatting. As a result, financial managers can easily monitor how well the organization manages loans, repayments, and debt obligations.
Unlike traditional financial reports that present large amounts of data, a KPI scorecard focuses only on important performance indicators. Therefore, it provides quick insights into financial stability.
For example, organizations can track KPIs such as:
- Debt-to-Equity Ratio
- Interest Coverage Ratio
- Average Loan Repayment Time
- Total Outstanding Debt
- Loan Default Rate
- Debt Service Coverage Ratio
- Debt Collection Efficiency
- Overdue Payments
- Interest Cost Percentage
- Debt Reduction Rate
Because Excel supports formulas, charts, and conditional formatting, the scorecard becomes a powerful yet simple financial monitoring solution.
Why Is Debt Management Important for Organizations?
Every organization relies on financial resources to operate and grow. However, debt can become risky if companies do not monitor it carefully. Therefore, financial teams must track debt performance continuously.
Effective debt management helps organizations:
- Maintain financial stability
- Reduce interest expenses
- Improve credit ratings
- Plan future investments
- Prevent financial risks
Moreover, organizations that monitor debt KPIs regularly can detect problems early. Consequently, they can adjust strategies before financial risks grow.
Key Features of the Debt Management KPI Scorecard in Excel
In this template, we have created four worksheets that organize all KPI tracking activities.
Each worksheet performs a specific role in the monitoring process.
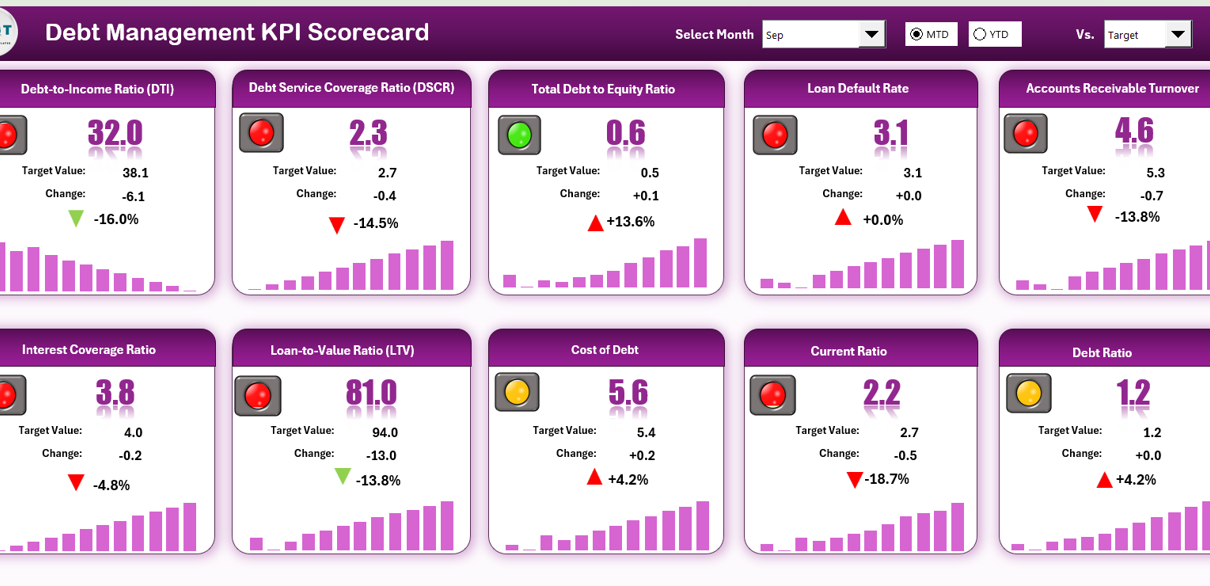
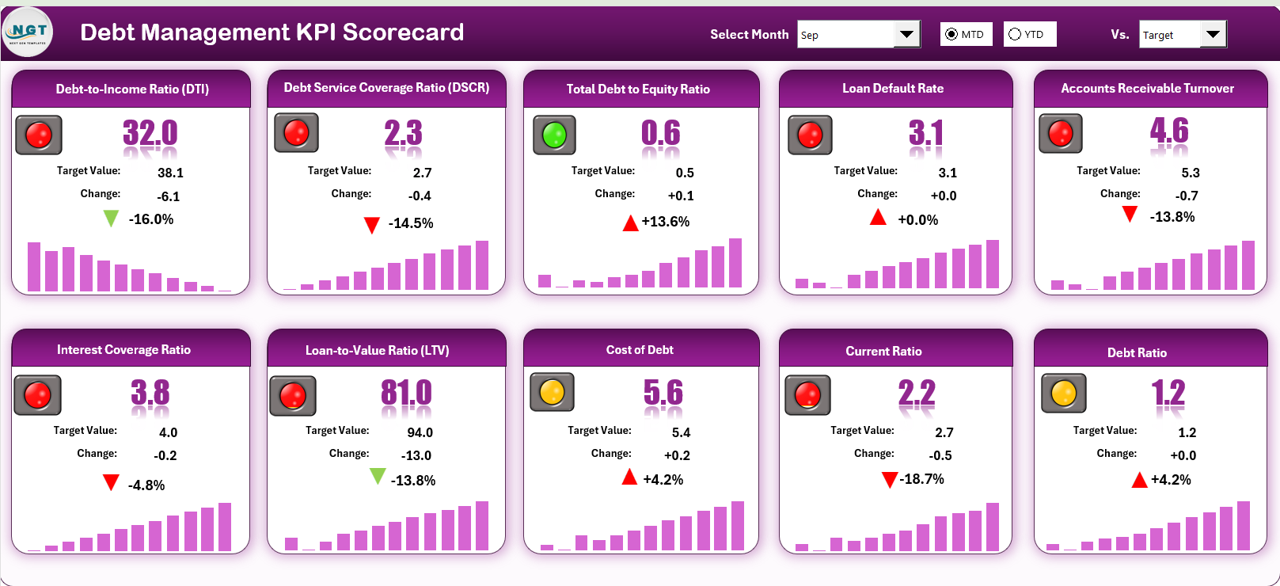
Scorecard Sheet – The Main Performance Dashboard
The Scorecard Sheet serves as the main interface where users can quickly review KPI performance.
This sheet provides a clear overview of financial indicators and allows managers to compare actual results with planned targets.
Key Features
- Dropdown Menus
Users can select the month, MTD (Month-to-Date), or YTD (Year-to-Date) analysis using dropdown options. - Actual vs Target Comparison
The scorecard compares real performance values against predefined targets. - Visual Indicators
Conditional formatting highlights performance status using color codes and arrows. Therefore, users can quickly identify whether performance meets expectations. - Comprehensive KPI Overview
The sheet displays all essential KPI information including MTD and YTD comparisons. - 10 KPIs in One View
The scorecard presents ten important KPIs together. As a result, decision-makers can review performance quickly without navigating multiple reports.
Because this sheet acts as the main dashboard, it provides immediate insights into financial performance.
Click to buy Debt Management KPI Scorecard in Excel
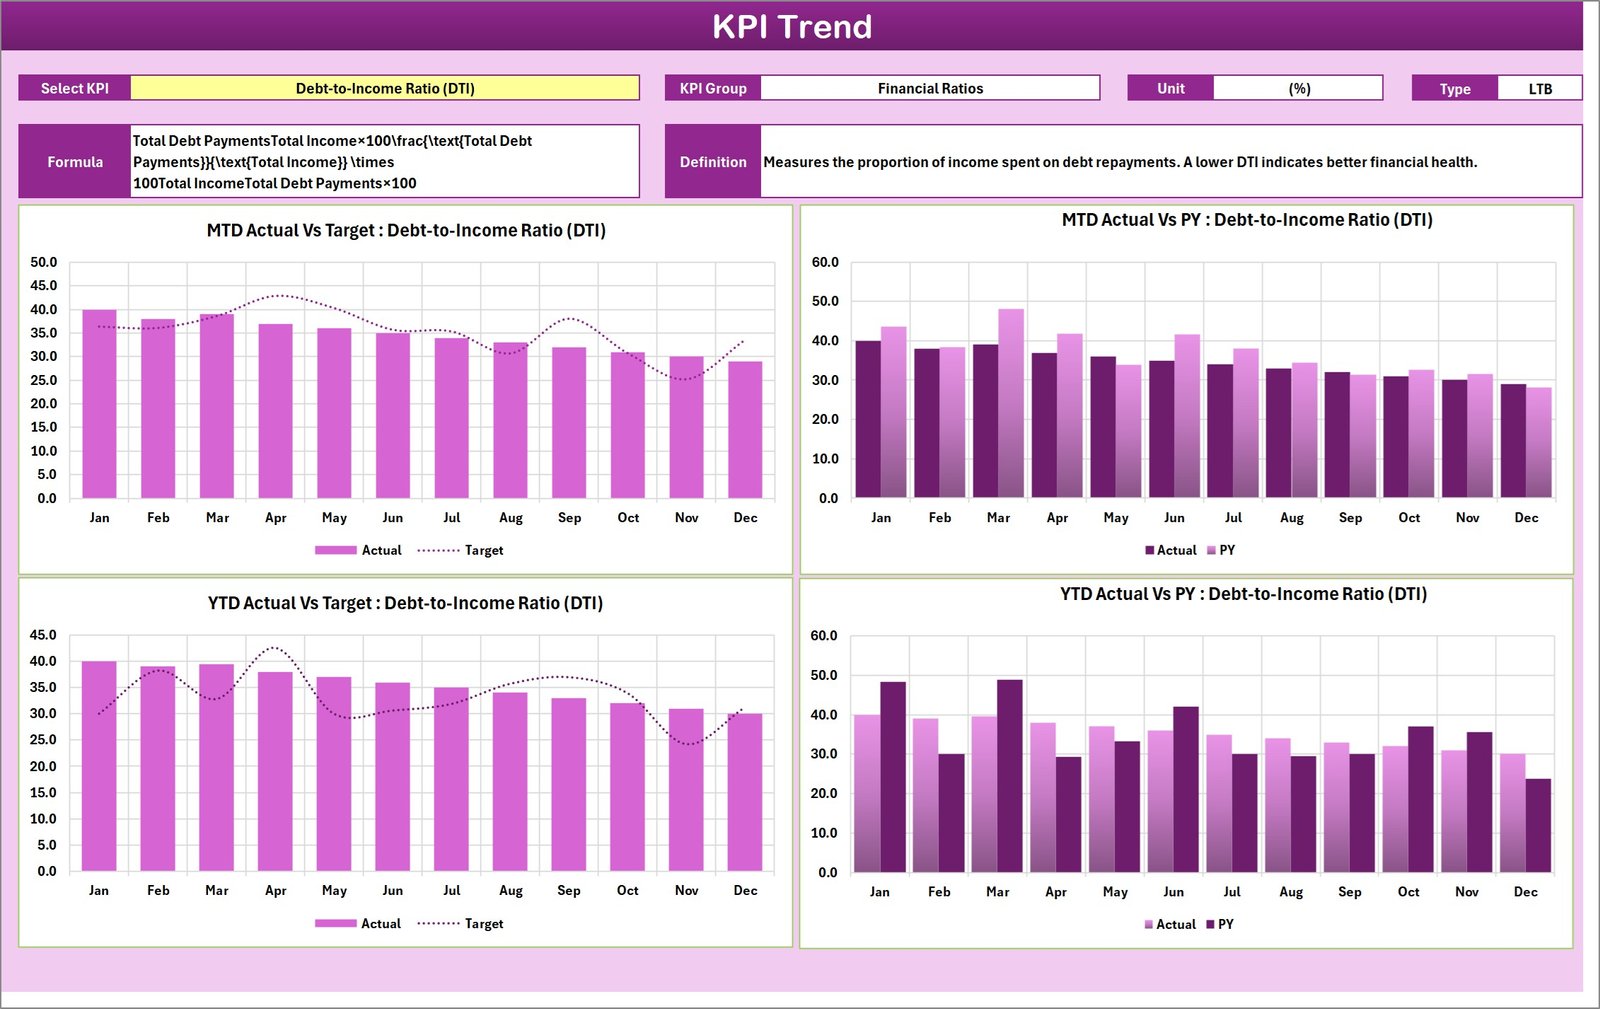
KPI Trend Sheet – Performance Trend Analysis
The KPI Trend Sheet focuses on analyzing the performance trends of individual KPIs.
Users can select any KPI using the dropdown menu available in Cell C3. Once selected, the sheet automatically displays detailed KPI information and trend charts.
Information Displayed
- KPI Group
- Unit of Measurement
- Type of KPI (Lower the Better or Upper the Better)
- KPI Formula
- KPI Definition
Charts and Analysis
The sheet also shows trend charts for MTD and YTD performance, including:
- Actual performance values
- Target values
- Previous Year (PY) performance
Because the charts display historical comparisons, managers can easily evaluate whether performance is improving or declining.
Furthermore, trend analysis helps organizations identify long-term patterns in debt performance.
Click to buy Debt Management KPI Scorecard in Excel
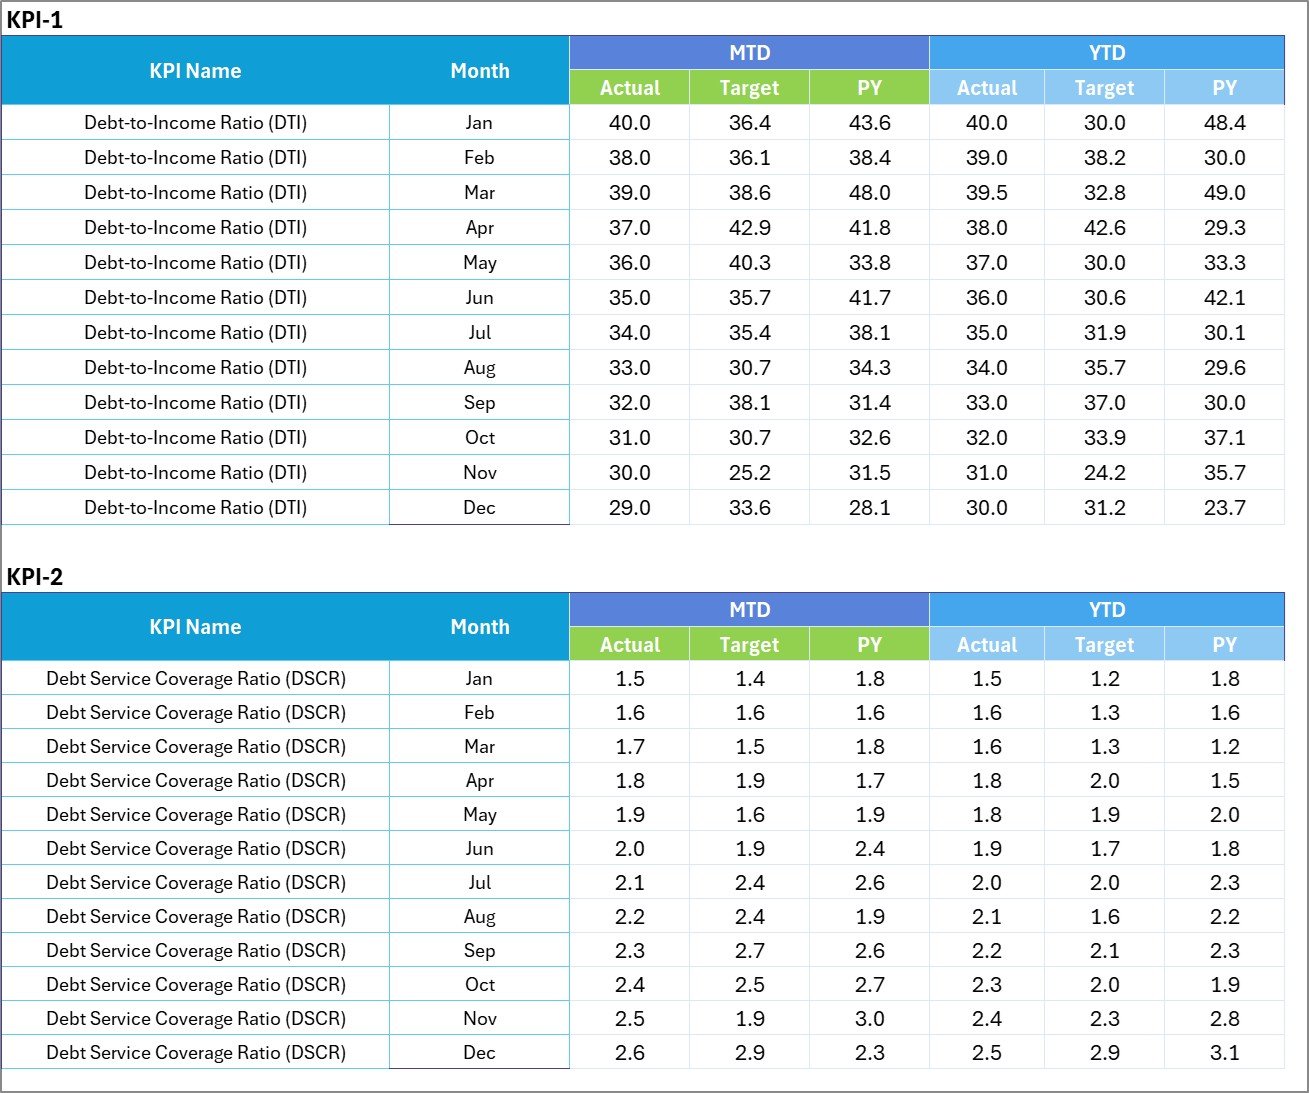
Input Data Sheet – Central Data Entry System
The Input Data Sheet acts as the central location for entering all KPI data.
This sheet ensures that the scorecard always reflects the latest financial performance.
Key Functions
- Record actual KPI values
- Enter target values
- Store monthly performance data
- Maintain structured data for analysis
Because the template links all calculations to this sheet, any update automatically refreshes the entire dashboard.
As a result, the scorecard always remains accurate and current.
Click to buy Debt Management KPI Scorecard in Excel
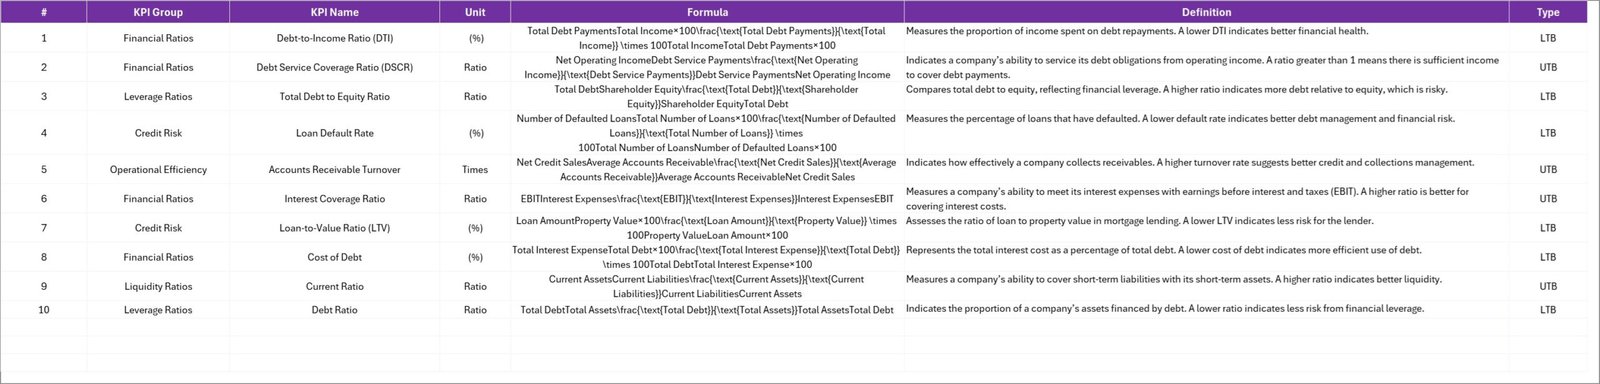
KPI Definition Sheet – KPI Documentation
The KPI Definition Sheet contains detailed information about each KPI used in the scorecard.
This sheet ensures consistency and clarity when multiple team members use the template.
Information Included
- KPI Name
- KPI Group
- Unit of Measurement
- KPI Formula
- KPI Definition
Because every KPI includes a definition, users can clearly understand how each metric works.
Moreover, the sheet helps organizations maintain standardized performance measurement across teams.
Click to buy Debt Management KPI Scorecard in Excel
What KPIs Can Be Tracked in a Debt Management Scorecard?
A debt management scorecard typically tracks several financial performance indicators.
Some common KPIs include:
Financial Stability KPIs
- Debt-to-Equity Ratio
- Debt-to-Asset Ratio
- Total Outstanding Debt
Repayment Efficiency KPIs
- Average Loan Repayment Time
- Debt Service Coverage Ratio
- Loan Repayment Rate
Cost-Related KPIs
- Interest Expense Ratio
- Average Interest Cost
Risk-Monitoring KPIs
- Loan Default Rate
- Overdue Debt Percentage
By tracking these KPIs regularly, organizations gain better visibility into their financial obligations.
Advantages of Debt Management KPI Scorecard in Excel
A well-designed KPI scorecard offers several advantages for financial teams.
- Clear Financial Visibility
The scorecard presents financial performance in a structured format. Therefore, managers can quickly understand the organization’s debt position.
- Better Decision-Making
Because the dashboard shows performance comparisons, managers can make data-driven decisions about borrowing and repayments.
- Early Risk Detection
When debt indicators decline, the scorecard highlights the issue immediately. As a result, organizations can take corrective action early.
- Performance Monitoring
Financial teams can monitor repayment efficiency and interest expenses regularly.
- Improved Financial Planning
Because the scorecard provides historical performance data, organizations can plan future debt strategies more effectively.
- Easy Implementation
Excel templates require no complex software installation. Therefore, organizations can implement the scorecard quickly.
Opportunities for Improvement in Debt Management KPI Monitoring
Although a KPI scorecard provides strong monitoring capabilities, organizations can improve its effectiveness by adopting additional practices.
Improve Data Accuracy
Organizations should verify financial data regularly to prevent reporting errors.
Integrate Automated Data Sources
Connecting Excel with financial systems can reduce manual data entry.
Expand KPI Coverage
Companies can include additional metrics such as credit risk indicators or loan portfolio performance.
Improve Data Visualization
Adding more charts and trend analysis can enhance insights.
By implementing these improvements, organizations can strengthen their debt management monitoring process.
Best Practices for the Debt Management KPI Scorecard
Organizations should follow several best practices to maximize the effectiveness of a KPI scorecard.
Define Clear KPIs
Each KPI should have a clear formula and measurable objective.
Maintain Accurate Data
Always verify financial data before updating the scorecard.
Review KPIs Regularly
Organizations should review KPI performance monthly to detect changes early.
Use Visual Indicators
Conditional formatting helps users identify performance issues quickly.
Align KPIs With Business Goals
Debt management KPIs should support overall financial strategies.
Train Team Members
Employees should understand how to use the scorecard and interpret KPI results.
How to Implement a Debt Management KPI Scorecard in Excel
Organizations can follow these steps to implement the scorecard successfully.
Step 1 – Define KPIs
First, identify the financial metrics that best represent debt performance.
Step 2 – Create KPI Definitions
Next, document each KPI including formulas, units, and definitions.
Step 3 – Collect Financial Data
Gather historical and current financial data related to loans, repayments, and interest expenses.
Step 4 – Populate the Input Sheet
Enter all KPI values into the input sheet.
Step 5 – Monitor Performance
Use the scorecard to compare actual performance with targets.
Step 6 – Analyze Trends
Review the KPI Trend sheet to understand performance patterns.
Following these steps helps organizations implement the scorecard efficiently.
Why Excel Is Ideal for KPI Scorecards
Excel remains one of the most widely used tools for financial monitoring.
Several reasons explain why Excel works well for KPI scorecards.
Flexibility
Users can easily customize templates according to business needs.
Powerful Calculations
Excel supports formulas, pivot tables, and advanced calculations.
Data Visualization
Charts and conditional formatting provide clear insights.
Accessibility
Most organizations already use Excel, so teams can adopt the scorecard quickly.
Because of these advantages, Excel continues to be a popular tool for KPI dashboards.
Conclusion
Effective debt management plays a crucial role in maintaining financial stability and supporting business growth. However, organizations must track financial obligations carefully to avoid risks.
The Debt Management KPI Scorecard in Excel provides a structured and easy-to-use solution for monitoring financial performance. By tracking key indicators such as repayment efficiency, interest costs, and debt ratios, organizations gain valuable insights into their financial health.
Moreover, the template simplifies performance monitoring by combining KPI tracking, trend analysis, and visual indicators in one centralized system.
When organizations implement this scorecard and follow best practices, they can improve financial decision-making, reduce risks, and maintain strong financial control.
Frequently Asked Questions (FAQs)
What is a Debt Management KPI Scorecard?
A Debt Management KPI Scorecard is a financial monitoring tool that tracks key indicators related to loans, repayments, and financial obligations.
Why should organizations track debt KPIs?
Organizations should track debt KPIs because they help monitor financial stability, control borrowing costs, and reduce financial risks.
How many worksheets are included in the template?
The template contains four worksheets:
- Scorecard Sheet
- KPI Trend Sheet
- Input Data Sheet
- KPI Definition Sheet
Can small businesses use this template?
Yes, small businesses can easily use this Excel template to track loans, repayments, and financial performance.
How often should KPI data be updated?
Organizations should update KPI data monthly. However, some financial teams update it weekly to monitor performance more closely.
What type of KPIs are included in debt management?
Common debt management KPIs include:
- Debt-to-Equity Ratio
- Interest Coverage Ratio
- Loan Default Rate
- Debt Service Coverage Ratio
- Total Outstanding Debt
Visit our YouTube channel to learn step-by-step video tutorials
Watch the step-by-step video tutorial:
Watch the step-by-step video tutorial:
Click to buy Debt Management KPI Scorecard in Excel