Modern defense organizations operate in highly complex environments where strategic decisions depend on accurate data, timely insights, and efficient resource management. Military operations involve massive budgets, personnel deployment, vehicle allocation, aircraft utilization, and risk monitoring. However, many defense departments still rely on scattered reports and manual spreadsheets, which slow decision-making and increase operational risk.Therefore, defense agencies increasingly adopt advanced analytics platforms to centralize information and monitor performance in real time. One of the most effective solutions available today is the Defense and Military Dashboard in Power BI.In this comprehensive guide, you will learn what a Defense and Military Dashboard in Power BI is, why defense organizations need it, how it works, its features, advantages, best practices, and frequently asked questions. Moreover, you will discover how data visualization transforms military planning into a smarter and faster decision-making process.Defense and Military Dashboard in Power BI
Click to buy Defense and Military Dashboard in Power BI
What Is a Defense and Military Dashboard in Power BI?
A Defense and Military Dashboard in Power BI is an interactive analytical system designed to monitor military operations, budgets, personnel deployment, vehicle usage, and operational performance using centralized data visualization.
Instead of reviewing multiple reports individually, decision-makers can analyze all operational metrics from a single dashboard interface. As a result, leadership teams gain immediate visibility into mission readiness and resource utilization.
Power BI connects multiple datasets and converts raw operational data into:Defense and Military Dashboard in Power BI
- Interactive charts
- KPI cards
- Dynamic filters (slicers)
- Trend analysis visuals
- Real-time performance insights
Consequently, military planners can track operations efficiently while maintaining transparency and accountability.
Why Do Defense Organizations Need a Military Dashboard?
Defense operations require precision, coordination, and accountability. However, traditional reporting methods often create delays and inconsistencies.
Common Challenges Without a Dashboard
- Data stored across multiple departments
- Slow reporting cycles
- Difficulty tracking budget utilization
- Limited visibility into deployment activities
- Manual calculation errors
- Lack of real-time insights
Because of these challenges, commanders struggle to make fast operational decisions. Therefore, organizations adopt Power BI dashboards to create a unified data environment.
How Power BI Solves These Problems
Power BI enables organizations to:
- Centralize operational data
- Monitor KPIs instantly
- Compare budget vs actual spending
- Track personnel and vehicle deployment
- Analyze risk and maintenance metrics
As a result, leadership teams make informed decisions with confidence.
Key Features of the Defense and Military Dashboard in Power BI
This ready-to-use dashboard contains five analytical pages inside the Power BI Desktop application. Each page focuses on a specific operational perspective.
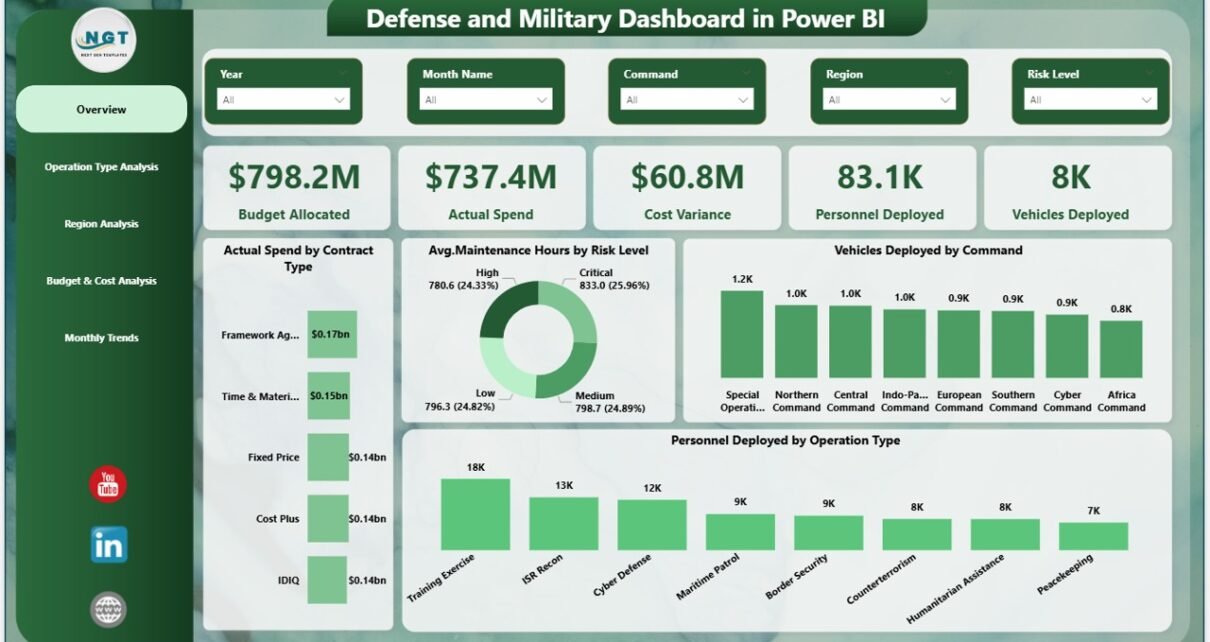
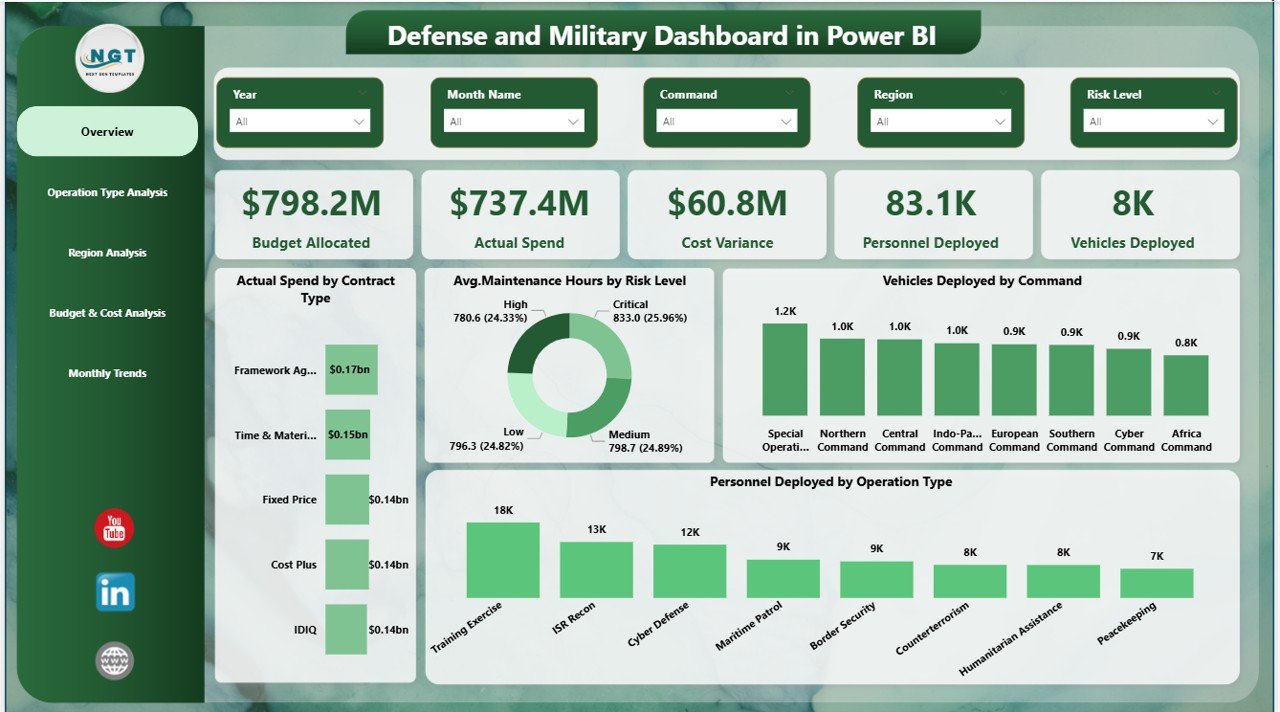
Overview Page – Central Command Monitoring
The Overview Page acts as the main command center of the dashboard. Here, users immediately understand overall operational performance.
KPI Cards Available
- Budget Allocated
- Actual Spend
- Cost Variance
- Personnel Deployed
- Vehicles Deployed
These cards provide instant performance visibility. Therefore, users quickly identify whether operations remain within budget limits.
Charts Included
- Actual Spend by Contract Type
- Average Maintenance Hours by Risk Level
- Vehicles Deployed by Command
- Personnel Deployed by Operation Type
Because slicers allow filtering, users can analyze specific missions, commands, or time periods easily.
Click to buy Defense and Military Dashboard in Power BI
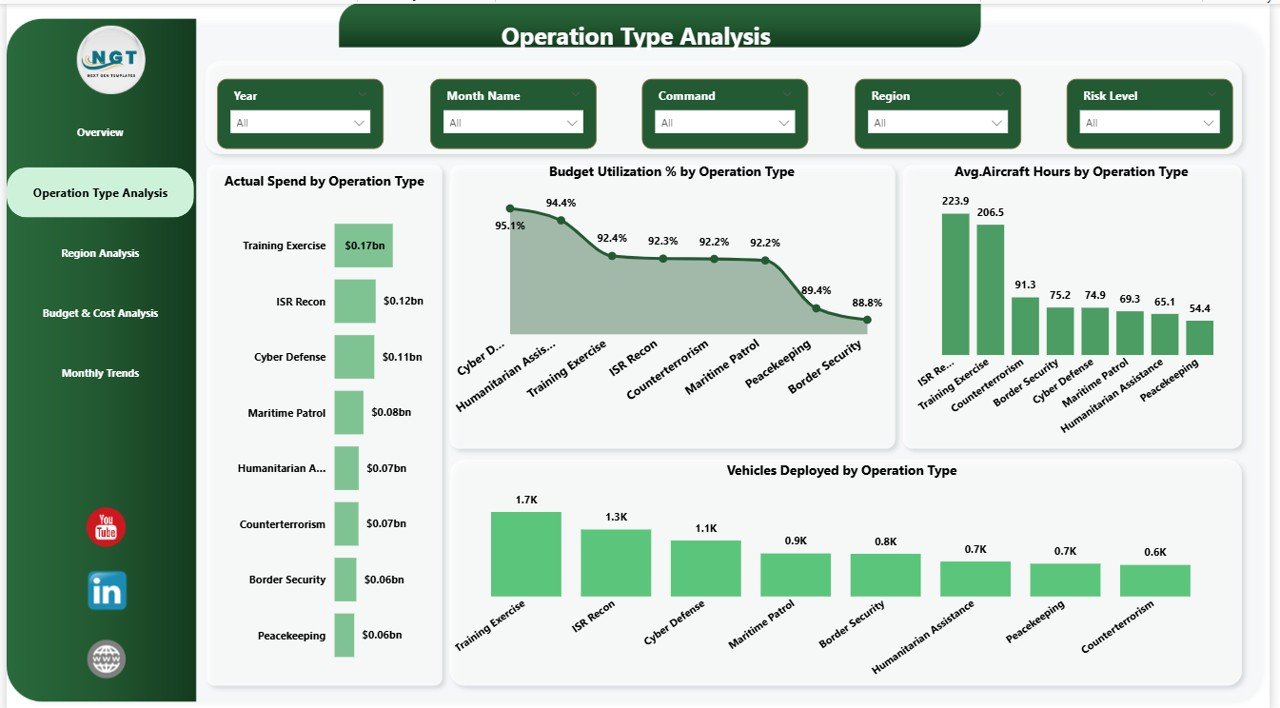
Operation Type Analysis – Mission Performance Insights
The Operation Type Analysis Page focuses on operational efficiency across different mission categories.
Charts Available
- Actual Spend by Operation Type
- Budget Utilization % by Operation Type
- Average Aircraft Hours by Operation
- Vehicles Deployed by Operation Type
This page helps analysts understand which operation types consume the most resources. Additionally, leadership teams can evaluate mission effectiveness.
For example:
- Training operations may require fewer vehicles.
- Combat operations may show higher aircraft usage.
- Support missions may demonstrate better budget efficiency.
Therefore, planners allocate resources strategically.
Click to buy Defense and Military Dashboard in Power BI
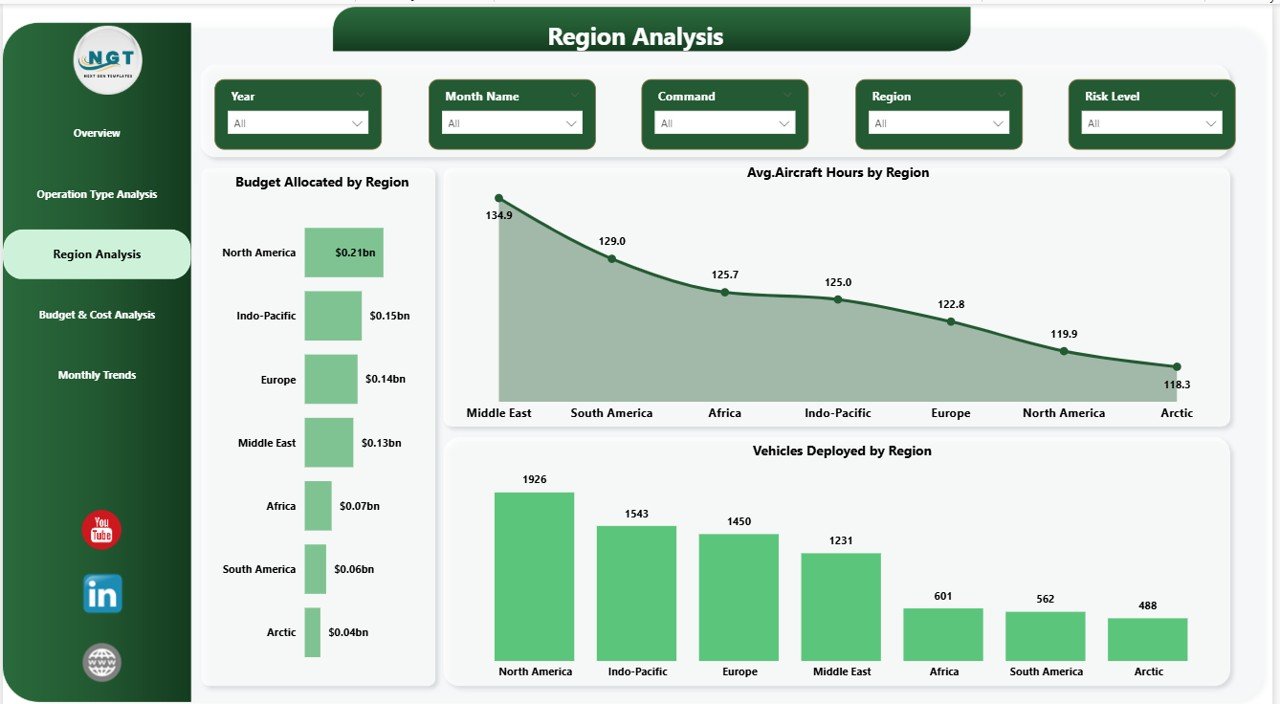
Region Analysis – Geographic Operational Visibility
Military operations often span multiple regions. Consequently, commanders must compare regional performance quickly.
The Region Analysis Page provides geographical insights.
Charts Included
- Budget Allocated by Region
- Average Aircraft Hours by Region
- Vehicles Deployed by Region
Using slicers, users can filter regions instantly. As a result, leaders identify regions requiring additional support or optimization.
Moreover, regional comparisons help improve logistical planning.
Click to buy Defense and Military Dashboard in Power BI
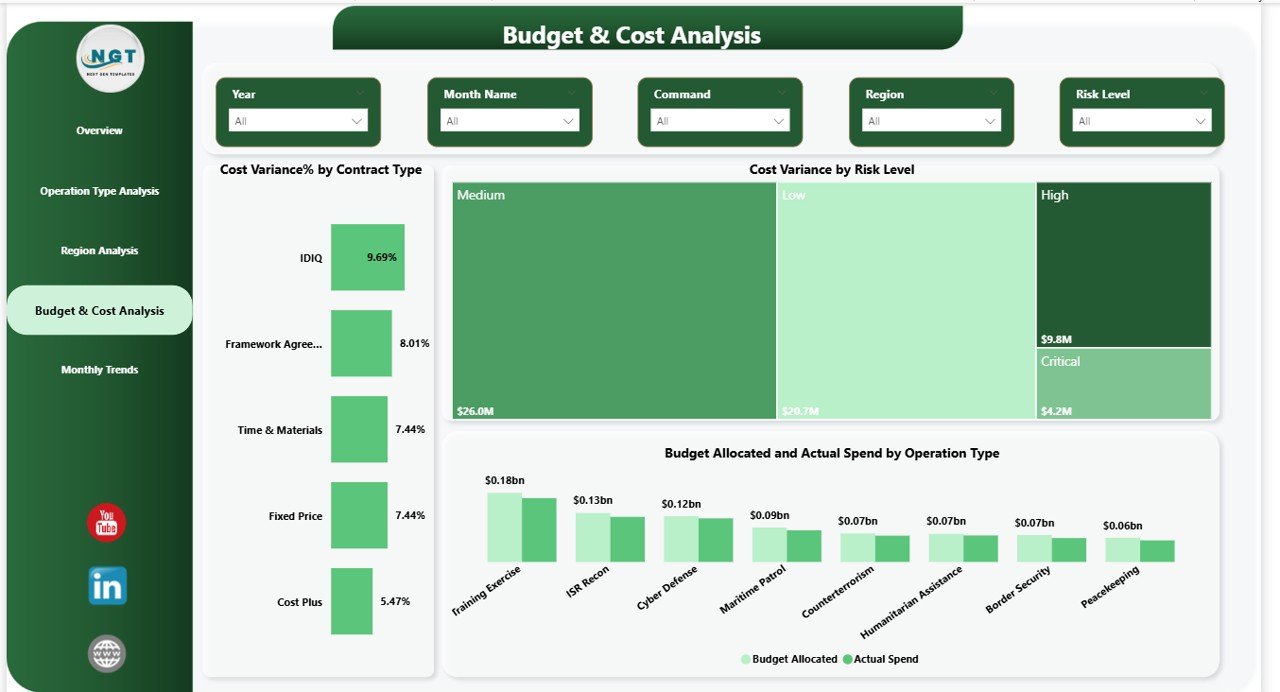
Budget & Cost Analysis – Financial Control Dashboard
Financial accountability plays a critical role in defense operations. Therefore, the dashboard includes a dedicated Budget & Cost Analysis Page.
Charts Available
- Cost Variance % by Contract Type
- Cost Variance by Risk Level
- Budget Allocated vs Actual Spend by Operation Type
This section allows finance teams to detect overspending early. Additionally, risk-based cost analysis highlights operational inefficiencies.
Because leaders receive clear visual comparisons, they take corrective action quickly.
Click to buy Defense and Military Dashboard in Power BI
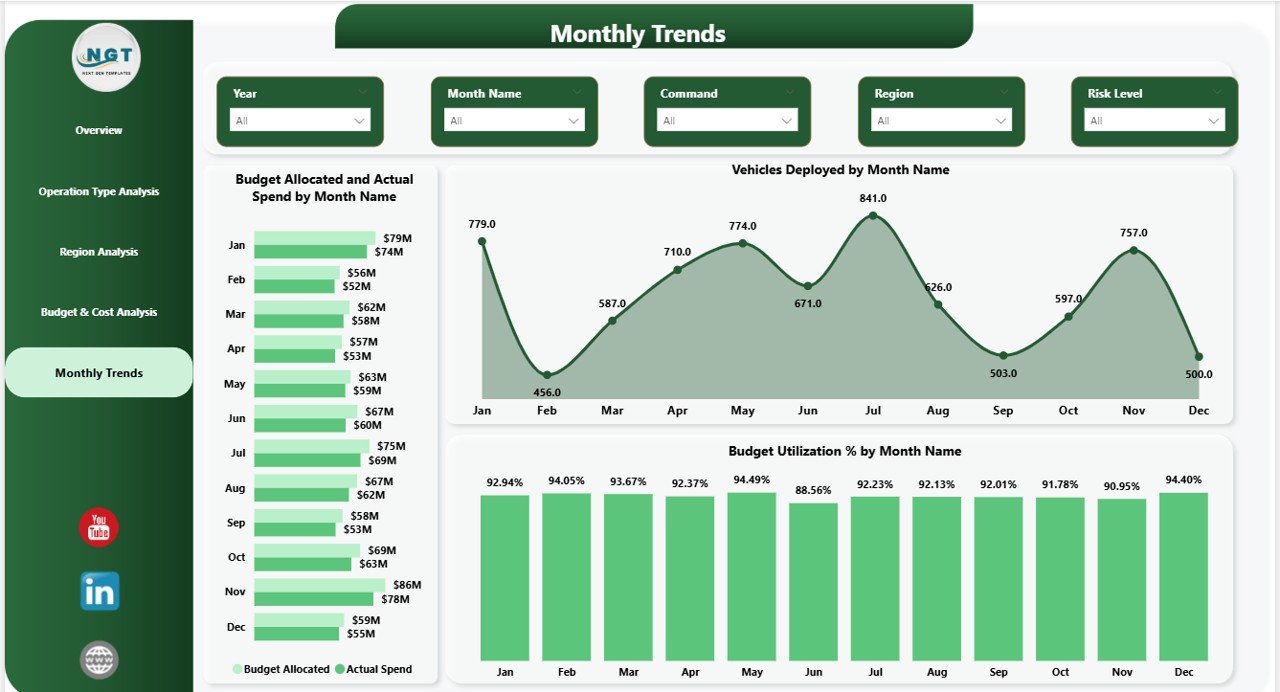
Monthly Trends – Performance Over Time
The Monthly Trends Page analyzes operational patterns across months.
Charts Included
- Budget Allocated vs Actual Spend by Month Name
- Vehicles Deployed by Month Name
- Budget Utilization % by Month Name
Trend analysis helps organizations understand seasonal operational changes. Furthermore, planners forecast future resource needs more accurately.
Click to buy Defense and Military Dashboard in Power BI
How Does the Defense Dashboard Work in Power BI?
The dashboard follows a structured data flow.
Step-by-Step Workflow
- Collect operational data from multiple sources.
- Import data into Power BI.
- Clean and transform data using Power Query.
- Create relationships between datasets.
- Build DAX measures for KPIs.
- Design interactive visuals.
- Apply slicers for filtering.
- Publish dashboard for secure access.
Because Power BI automates calculations, reports update automatically whenever data changes.
What KPIs Can Be Tracked Using This Dashboard?
A military dashboard tracks multiple performance indicators, including:
Financial KPIs
- Budget Allocated
- Actual Spend
- Cost Variance %
- Budget Utilization %
Operational KPIs
- Personnel Deployment
- Vehicles Deployment
- Aircraft Usage Hours
- Maintenance Hours
Risk KPIs
- Maintenance Risk Level
- Contract Risk Performance
- Operational Cost Risk
These KPIs help leadership maintain operational readiness.
Advantages of Defense and Military Dashboard in Power BI
Organizations gain significant benefits when they implement this dashboard.
Improved Decision-Making
Leaders analyze real-time data instead of waiting for reports.
Centralized Information
All operational metrics remain in one platform.
Better Budget Control
Finance teams monitor spending continuously.
Operational Transparency
Commanders view deployment status instantly.
Faster Reporting
Automated visuals eliminate manual reporting tasks.
Enhanced Strategic Planning
Historical trends support future mission planning.
How Does Power BI Improve Military Planning?
Power BI supports modern defense strategies through data intelligence.
Key Improvements
- Enables predictive planning
- Improves coordination across departments
- Reduces reporting delays
- Identifies operational risks early
- Enhances accountability
Therefore, organizations transition from reactive decisions to proactive strategies.
Who Can Benefit from This Dashboard?
Several stakeholders benefit from the Defense and Military Dashboard:
- Defense Ministries
- Military Command Centers
- Logistics Departments
- Budget & Finance Teams
- Strategic Planning Units
- Defense Contractors
- Security Agencies
Because the dashboard adapts easily, organizations customize it according to mission requirements.
How to Implement a Defense and Military Dashboard Successfully?
Implementation becomes easier when organizations follow structured steps.
Step 1: Define Objectives
Identify operational goals and KPIs.
Step 2: Prepare Data Sources
Collect data from finance, logistics, and operations systems.
Step 3: Standardize Data
Ensure consistent naming conventions and formats.
Step 4: Design Visual Layout
Create logical analytical pages.
Step 5: Validate Metrics
Confirm calculations with domain experts.
Step 6: Train Users
Educate teams on dashboard usage.
Step 7: Monitor and Improve
Update dashboard based on feedback.
Best Practices for the Defense and Military Dashboard in Power BI
Organizations achieve better results when they follow proven practices.
Keep Dashboard Simple
Avoid overcrowding visuals.
Use Clear KPIs
Focus on mission-critical metrics.
Apply Consistent Filters
Maintain uniform slicers across pages.
Ensure Data Accuracy
Validate sources regularly.
Secure Sensitive Data
Use role-based access control.
Monitor Performance Regularly
Review dashboard effectiveness monthly.
Optimize Visual Design
Use meaningful colors and labels.
Future of Defense Analytics with Power BI
Defense analytics continues evolving rapidly. Modern technologies integrate with dashboards to deliver advanced intelligence.
Emerging Trends
- AI-driven predictive analytics
- Real-time battlefield monitoring
- IoT-enabled equipment tracking
- Automated anomaly detection
- Cloud-based secure reporting
As technology advances, dashboards will become essential tools for mission readiness.
Conclusion
The Defense and Military Dashboard in Power BI transforms how defense organizations manage operations, budgets, and deployments. Instead of relying on disconnected reports, leadership teams gain centralized visibility through interactive analytics.
Because the dashboard combines financial tracking, operational monitoring, regional analysis, and trend insights, decision-makers respond faster and plan smarter. Moreover, automated reporting reduces workload while improving accuracy.
Organizations that adopt data-driven dashboards strengthen operational efficiency, enhance transparency, and improve strategic outcomes. Therefore, implementing a Power BI defense dashboard represents a major step toward modern military management.
Frequently Asked Questions (FAQs)
What is a Defense and Military Dashboard in Power BI used for?
It helps organizations monitor budgets, personnel deployment, vehicles, operations, and performance metrics using interactive visual reports.
Can the dashboard handle large military datasets?
Yes. Power BI efficiently processes large datasets and provides fast analytical performance.
Is the dashboard customizable?
Yes. Organizations customize KPIs, visuals, and filters based on operational needs.
Does the dashboard update automatically?
Yes. When connected data updates, Power BI refreshes visuals automatically.
Who should use this dashboard?
Commanders, analysts, finance teams, logistics managers, and defense planners benefit from it.
Is Power BI secure for defense data?
Power BI provides enterprise-level security, including role-based access and data protection features.
How often should the dashboard be updated?
Organizations should refresh data daily or weekly depending on operational requirements.
Visit our YouTube channel to learn step-by-step video tutorials
Click to buy Defense and Military Dashboard in Power BI
Watch the step-by-step video tutorial: