In today’s fast-moving financial markets, derivatives trading plays a critical role in risk management, hedging, and speculative strategies. However, managing derivatives data without a structured system often leads to confusion, delayed decisions, and hidden risks. Therefore, professionals increasingly rely on a Derivatives Trading Dashboard in Excel to gain clarity, control, and confidence.
A Derivatives Trading Dashboard in Excel transforms complex trading data into simple visuals, KPIs, and trends. As a result, traders, risk managers, treasury teams, and financial analysts can monitor exposure, margin requirements, profit and loss, and counterparty risk from a single, centralized file.
In this detailed article, you will learn what a Derivatives Trading Dashboard in Excel is, why it matters, how it works, its page-wise structure, advantages, best practices, and frequently asked questions. Moreover, the article uses clear language, active voice, and practical explanations to ensure easy understanding.
Click to Purchases Derivatives Trading Dashboard in Excel
What Is a Derivatives Trading Dashboard in Excel?
A Derivatives Trading Dashboard in Excel is a ready-to-use analytical tool that consolidates derivatives trading data into interactive charts, cards, and filters. Instead of reviewing multiple spreadsheets or static reports, users can analyze trading performance, exposure, and risk in real time.
Because the dashboard runs on Excel, it offers flexibility, transparency, and ease of use. Moreover, it allows users to customize metrics, add new trades, and extend analysis without advanced programming.
Most importantly, the dashboard converts raw trading data into actionable insights, which helps decision-makers respond faster to market changes.
Why Do Organizations Need a Derivatives Trading Dashboard?
Derivatives portfolios often include swaps, options, futures, and forwards across multiple counterparties and underlying assets. Consequently, tracking performance manually becomes time-consuming and risky.
A Derivatives Trading Dashboard in Excel solves this challenge because it:
-
Centralizes all derivatives trading data
-
Improves visibility into risk and exposure
-
Supports faster and better decision-making
-
Reduces dependency on manual calculations
Furthermore, the dashboard enhances governance and compliance by providing structured, auditable reporting.
How Does a Derivatives Trading Dashboard in Excel Work?
The dashboard works by connecting structured data tables with Excel visuals such as charts, cards, and slicers. As users update the data sheet, all visuals refresh automatically.
Typically, the dashboard includes:
-
A data sheet for raw transaction-level data
-
A support sheet for calculations, mappings, and helper columns
-
Multiple analysis pages for different business views
-
Interactive slicers for filtering by month, counterparty, derivative type, or asset
As a result, users can drill down into specific risks or performance drivers within seconds.
Key Features of the Derivatives Trading Dashboard in Excel
This Derivatives Trading Dashboard in Excel comes with a clean structure and powerful analytical features. Let us explore them in detail.
Page Navigator for Easy Navigation
The dashboard includes a Page Navigator on the left side, which allows users to move between pages effortlessly. Therefore, users do not waste time searching for sheets.
This feature improves usability and makes the dashboard presentation-ready for meetings and reviews.
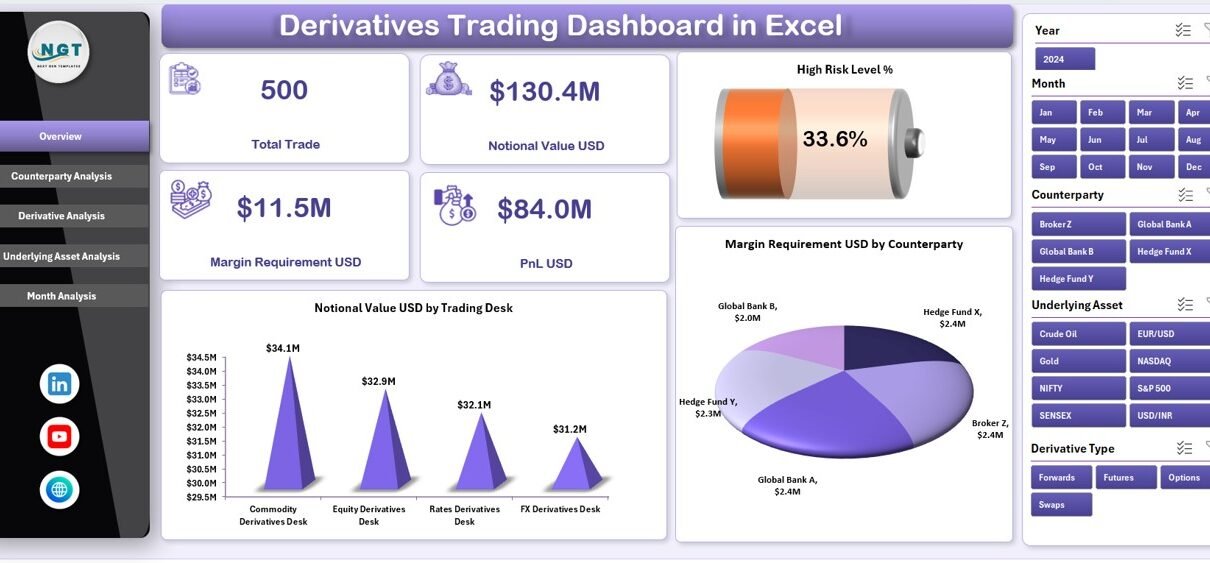
Overview Page: High-Level Snapshot of Derivatives Performance
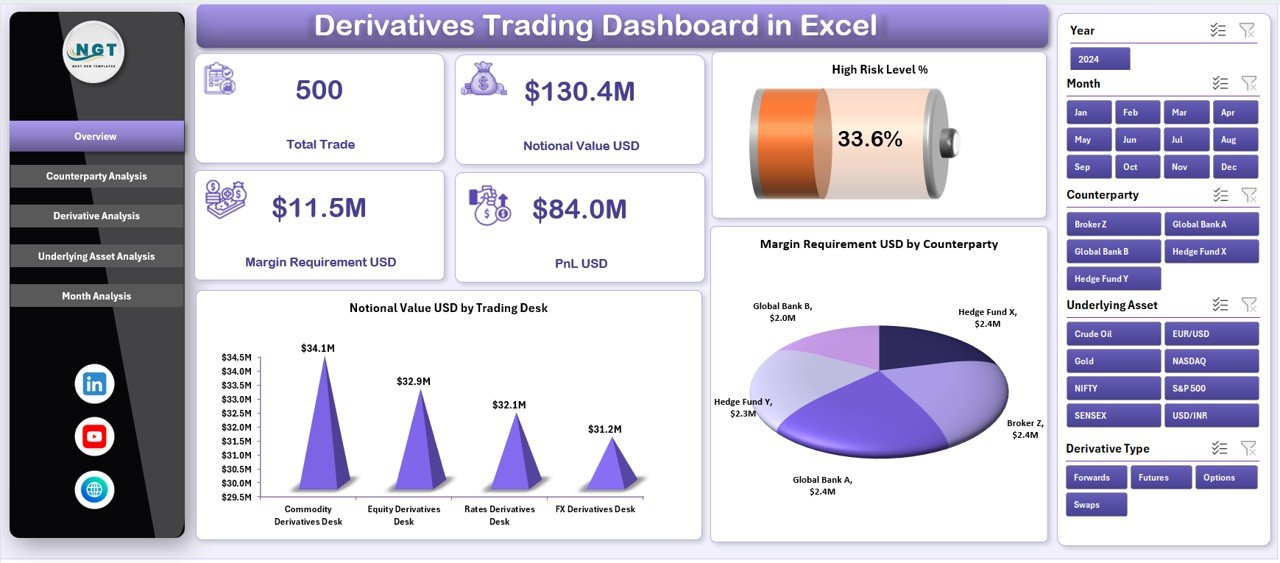
The Overview Page serves as the control center of the dashboard. It provides a quick summary of key risk and performance indicators.
Key Elements of the Overview Page
-
Right-side slicer to filter data dynamically
-
Four KPI cards for quick insights
-
Three main charts for risk and exposure analysis
Charts on the Overview Page
-
High Risk Level %
This chart highlights the proportion of trades classified as high risk. As a result, risk managers can immediately identify potential threats. -
Notional Value USD by Trading Desk
This visual shows exposure distribution across trading desks. Therefore, leadership can monitor concentration risk. -
Margin Requirement USD by Counterparty
This chart helps teams track margin obligations and liquidity impact.
Because this page summarizes the entire derivatives portfolio, it supports quick decision-making and executive reporting.
Counterparty Analysis Page: Managing Counterparty Risk Effectively
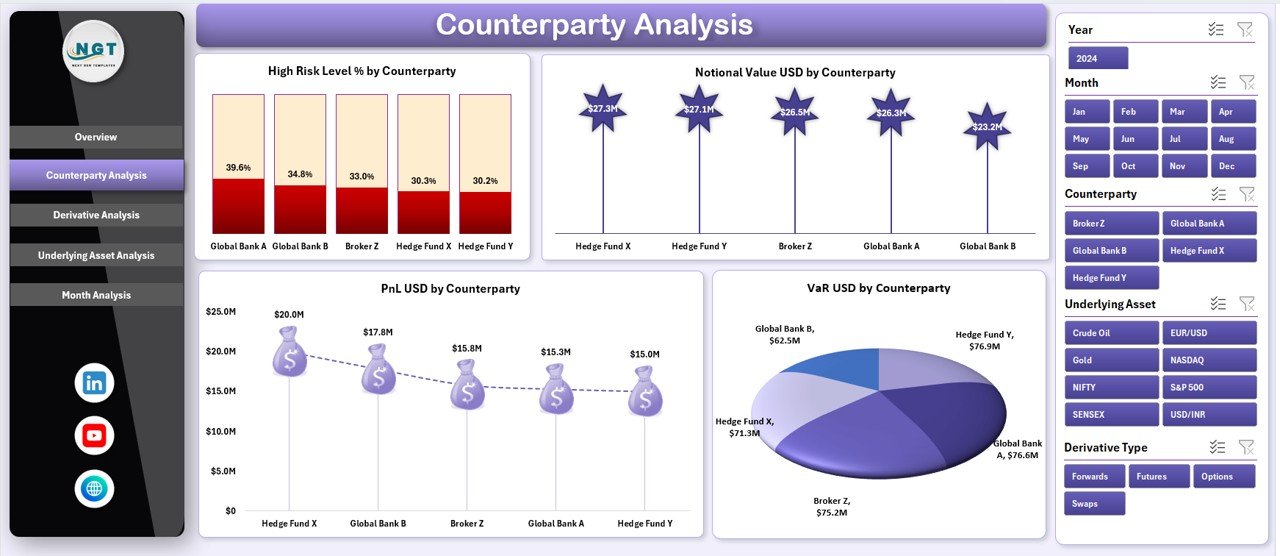
Counterparty risk remains one of the biggest concerns in derivatives trading. Therefore, the Counterparty Analysis Page focuses entirely on this aspect.
Key Features of Counterparty Analysis
-
Right-side slicer for filtering counterparties
-
Four detailed charts for performance and risk tracking
Charts on the Counterparty Analysis Page
-
High Risk Level % by Counterparty
This chart identifies counterparties with higher risk exposure. -
Notional Value USD by Counterparty
This visual highlights exposure concentration across counterparties. -
PnL USD by Counterparty
This chart shows profitability trends for each counterparty. -
VaR USD by Counterparty
This chart measures potential losses under adverse market conditions.
Because of this focused analysis, teams can renegotiate limits, adjust exposure, or enhance collateral strategies.
Click to Purchases Derivatives Trading Dashboard in Excel
Derivative Analysis Page: Understanding Instrument-Level Performance
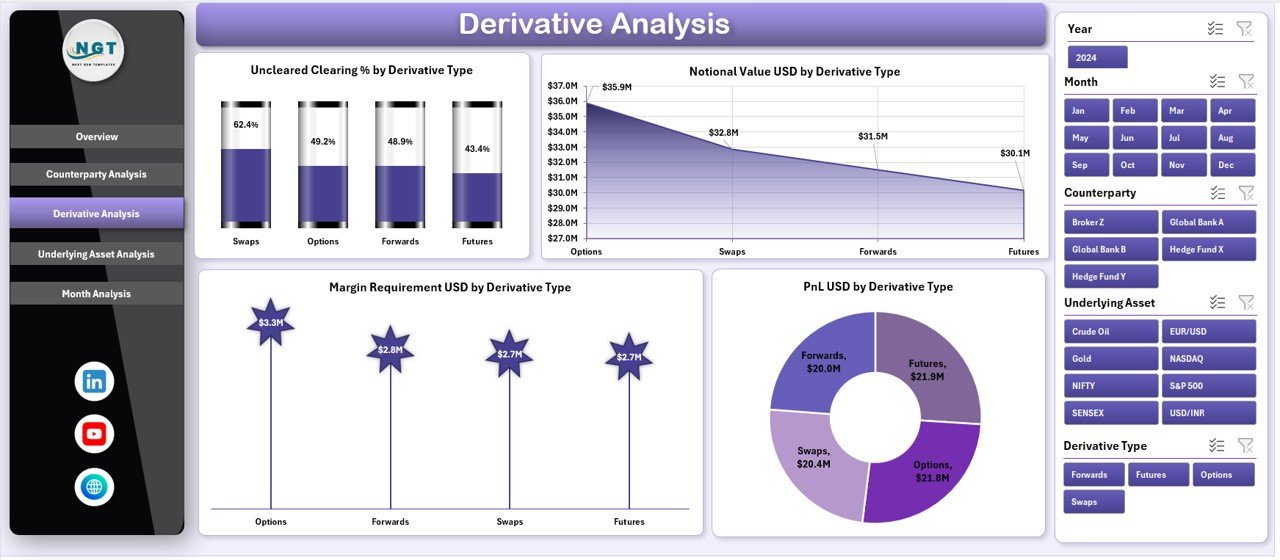
Different derivative instruments behave differently under market conditions. Therefore, the Derivative Analysis Page breaks down performance by derivative type.
Key Features of Derivative Analysis
-
Right-side slicer for derivative type selection
-
Four analytical charts
Charts on the Derivative Analysis Page
-
Uncleared vs Cleared % by Derivative Type
This chart shows clearing status, which directly impacts regulatory capital and risk. -
Notional Value USD by Derivative Type
This visual tracks exposure across swaps, options, futures, and forwards. -
Margin Requirement USD by Derivative Type
This chart helps assess liquidity needs by instrument. -
PnL USD by Derivative Type
This visual compares profitability across derivative categories.
As a result, traders and risk teams can optimize instrument selection and portfolio mix.
Underlying Asset Analysis Page: Tracking Asset-Level Exposure
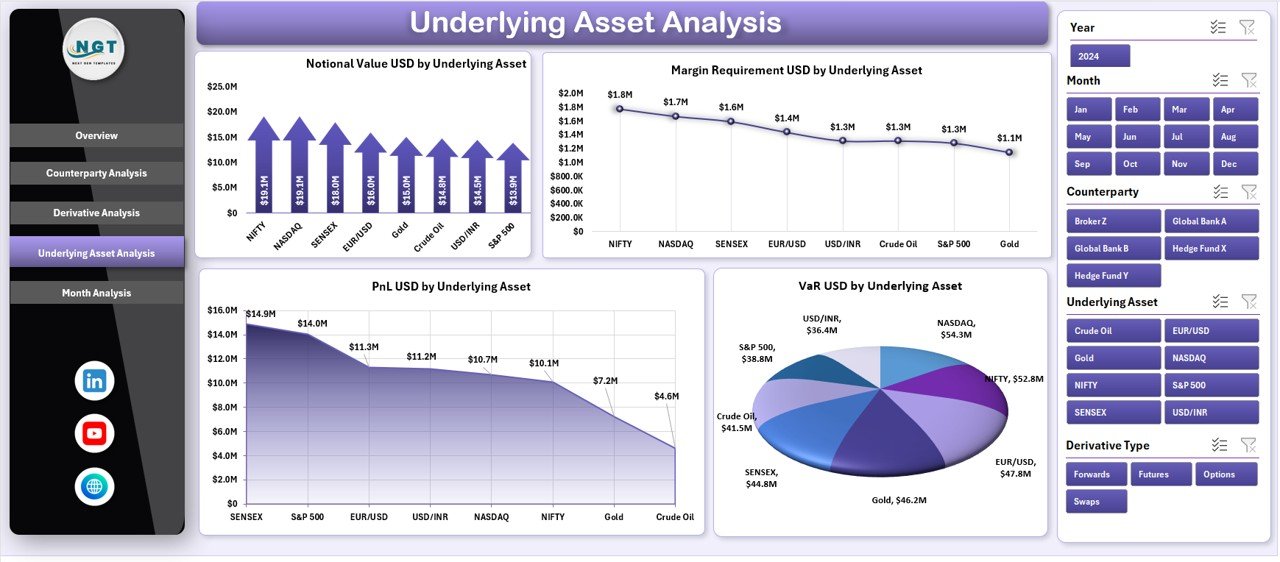
Underlying assets such as interest rates, commodities, equities, or currencies drive derivatives performance. Therefore, this page focuses on asset-level insights.
Key Features of Underlying Asset Analysis
-
Right-side slicer for asset selection
-
Four comprehensive charts
Charts on the Underlying Asset Analysis Page
-
Notional Value USD by Underlying Asset
This chart shows exposure concentration by asset class. -
Margin Requirement USD by Underlying Asset
This visual highlights liquidity pressure by asset. -
PnL USD by Underlying Asset
This chart tracks profitability across assets. -
VaR USD by Underlying Asset
This visual measures downside risk at the asset level.
Because of this analysis, portfolio managers can rebalance exposure proactively.
Month Analysis Page: Monitoring Trends Over Time
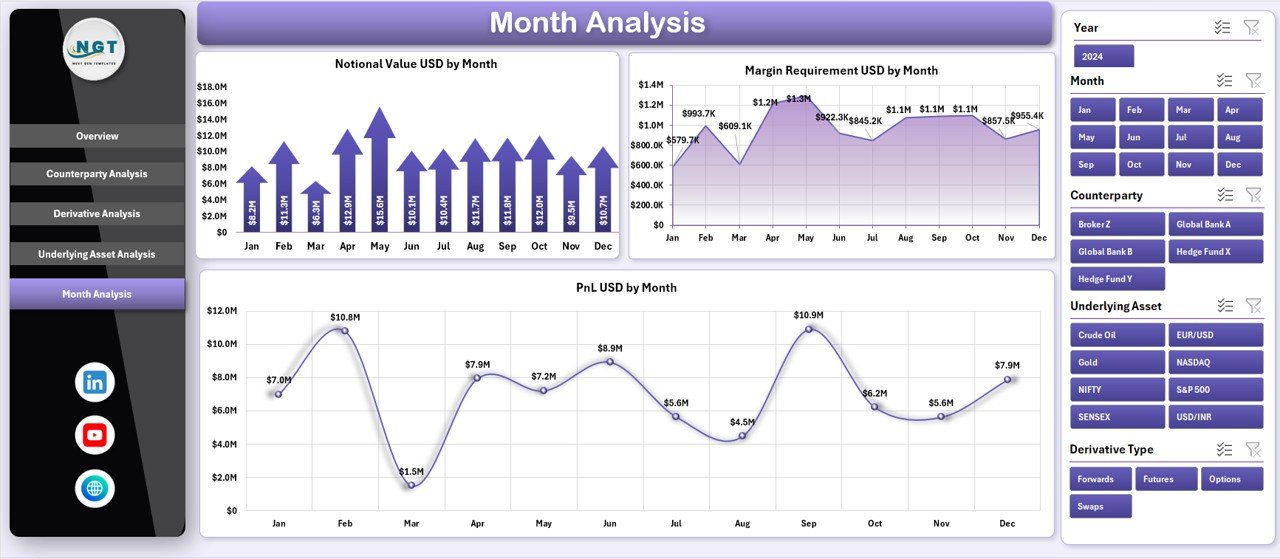
Market conditions change frequently. Therefore, the Month Analysis Page helps users track trends over time.
Key Features of Month Analysis
-
Right-side slicer for month selection
-
Three trend-focused charts
Charts on the Month Analysis Page
-
Notional Value USD by Month
This chart tracks growth or reduction in exposure. -
Margin Requirement USD by Month
This visual shows changing liquidity needs. -
PnL USD by Month
This chart highlights profit and loss trends over time.
As a result, management can identify seasonal patterns and market impacts.
Data Sheet and Support Sheet: Backbone of the Dashboard
Click to Purchases Derivatives Trading Dashboard in Excel
Behind every powerful dashboard lies a well-structured data model.
Data Sheet
The Data Sheet stores transaction-level derivatives data such as:
-
Trade date
-
Counterparty
-
Derivative type
-
Underlying asset
-
Notional value
-
Margin requirement
-
PnL
-
Risk classification
Because the data remains structured, analysis stays accurate and consistent.
Support Sheet
The Support Sheet handles:
-
Calculations and helper columns
-
Risk classification logic
-
Lookup tables and mappings
This separation ensures clarity and easier maintenance.
Advantages of Derivatives Trading Dashboard in Excel
A Derivatives Trading Dashboard in Excel offers several practical advantages.
Key Advantages
-
Centralized Visibility: Monitor all derivatives trades in one file
-
Improved Risk Management: Identify high-risk exposure quickly
-
Better Decision-Making: Use real-time insights instead of assumptions
-
Cost-Effective: Avoid expensive trading systems
-
Flexibility: Customize metrics and layouts easily
-
Audit-Friendly: Maintain transparent calculations
Because of these advantages, Excel dashboards remain popular even in advanced trading environments.
Who Can Use a Derivatives Trading Dashboard in Excel?
This dashboard suits multiple roles across financial organizations.
-
Traders and trading desk heads
-
Risk management teams
-
Treasury and finance departments
-
Portfolio managers
-
Compliance and audit teams
-
Senior leadership and decision-makers
Each role benefits from tailored insights without data duplication.
Best Practices for the Derivatives Trading Dashboard in Excel
To maximize value, organizations should follow proven best practices.
Best Practices
-
Use standardized data formats to avoid errors
-
Update data regularly for accurate insights
-
Validate calculations on the support sheet
-
Limit manual overrides to maintain integrity
-
Use slicers consistently for better interactivity
-
Document assumptions and formulas clearly
-
Review risk thresholds periodically
By following these best practices, teams ensure reliability and scalability.
Common Challenges and How to Overcome Them
Even with a dashboard, challenges may arise.
Common Challenges
-
Inconsistent data input
-
Overloaded visuals
-
Misinterpreted risk metrics
Practical Solutions
-
Implement data validation rules
-
Keep visuals clean and focused
-
Provide KPI definitions and notes
Therefore, governance and training remain essential.
Conclusion: Why a Derivatives Trading Dashboard in Excel Is Essential
A Derivatives Trading Dashboard in Excel empowers organizations to manage complex trading portfolios with clarity and control. Instead of juggling multiple reports, users gain a single source of truth for exposure, risk, and performance.
Because the dashboard combines flexibility, transparency, and analytical depth, it supports better decisions at every level. Moreover, Excel’s accessibility makes this solution practical for both small teams and large enterprises.
Ultimately, if your organization trades derivatives and values data-driven decisions, this dashboard becomes an essential tool.
Frequently Asked Questions (FAQs)
What is a Derivatives Trading Dashboard in Excel used for?
A Derivatives Trading Dashboard in Excel helps track exposure, risk, margin requirements, and profitability across derivatives portfolios.
Can this dashboard handle large datasets?
Yes, with proper structuring and optimization, Excel can handle large derivatives datasets effectively.
Do I need advanced Excel skills to use this dashboard?
No, basic Excel knowledge is sufficient because the dashboard uses intuitive slicers and visuals.
Can I customize the dashboard for my organization?
Yes, you can easily customize KPIs, charts, and layouts based on business needs.
Is this dashboard suitable for regulatory reporting?
Yes, because it maintains transparent calculations and structured data, it supports internal and regulatory reporting.
How often should the data be updated?
You should update data daily or as per trading frequency to ensure accurate insights.
Visit our YouTube channel to learn step-by-step video tutorials