Running a distillery requires precision, discipline, and strong data control. You monitor fermentation levels, control aging cycles, track bottling efficiency, and manage distribution targets. However, if you track all these numbers in scattered sheets, you lose clarity. As a result, decisions slow down. Moreover, performance gaps remain hidden.
So, how can you track production, quality, sales, cost, and operational efficiency in one structured system?
The answer is simple.
You need a Distilleries KPI Dashboard in Excel.
Click to Purchases Distilleries KPI Dashboard in Excel
In this detailed guide, you will learn:
-
What a Distilleries KPI Dashboard in Excel is
-
Why distilleries need KPI tracking
-
Complete explanation of all 7 worksheets
-
Advantages of the Distilleries KPI Dashboard in Excel
-
Best Practices for the Distilleries KPI Dashboard in Excel
-
Frequently Asked Questions with Answers
Let us explore everything step by step.
What Is a Distilleries KPI Dashboard in Excel?
A Distilleries KPI Dashboard in Excel is a ready-to-use performance monitoring template designed specifically for distillery operations. It allows you to track key metrics such as:
-
Production volume
-
Fermentation efficiency
-
Yield percentage
-
Bottling rate
-
Sales performance
-
Cost per liter
-
Inventory turnover
Instead of reviewing raw numbers, you see structured KPIs with:
-
MTD (Month-To-Date) Actual vs Target
-
YTD (Year-To-Date) Actual vs Target
-
Previous Year comparisons
-
Up and down arrow indicators
-
Trend charts for performance monitoring
Therefore, you gain full control over your operations in one single Excel file.
Why Do Distilleries Need a KPI Dashboard?
Distilleries operate in a competitive and regulated environment. If you fail to monitor production or quality metrics, you risk losses. On the other hand, when you track KPIs consistently, you improve efficiency.
Here is why you need it:
1. Because Production Must Stay Consistent
Fermentation timing, distillation efficiency, and aging cycles require accuracy. If output drops, profit drops.
2. Because Yield Directly Impacts Profit
Small variations in yield percentage can reduce revenue significantly. Therefore, you must monitor it monthly and yearly.
3. Because Cost Control Drives Margin
Energy usage, raw material cost, and packaging expenses affect your bottom line. So, you must compare actual vs target regularly.
4. Because You Must Compare with Previous Year
Seasonal demand affects alcohol production. However, when you compare with previous year data, you identify patterns easily.
5. Because Decision-Making Requires Data
Managers cannot rely on assumptions. Instead, they need real-time numbers and visual indicators.
That is exactly what this dashboard provides.
Overview of the Distilleries KPI Dashboard in Excel
This dashboard contains 7 structured worksheets. Each sheet serves a specific purpose. As a result, you get complete operational visibility.
Let us understand each worksheet clearly.
1️⃣ Home Sheet – Your Navigation Hub
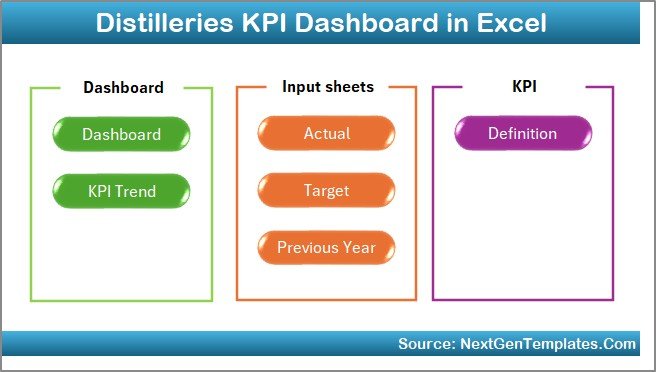
The Home Sheet works as an index page.
Here, you get:
-
6 navigation buttons
-
Quick access to all major sheets
-
Clean and professional interface
Because of this design, users can move easily between sheets. Therefore, you save time and avoid confusion.
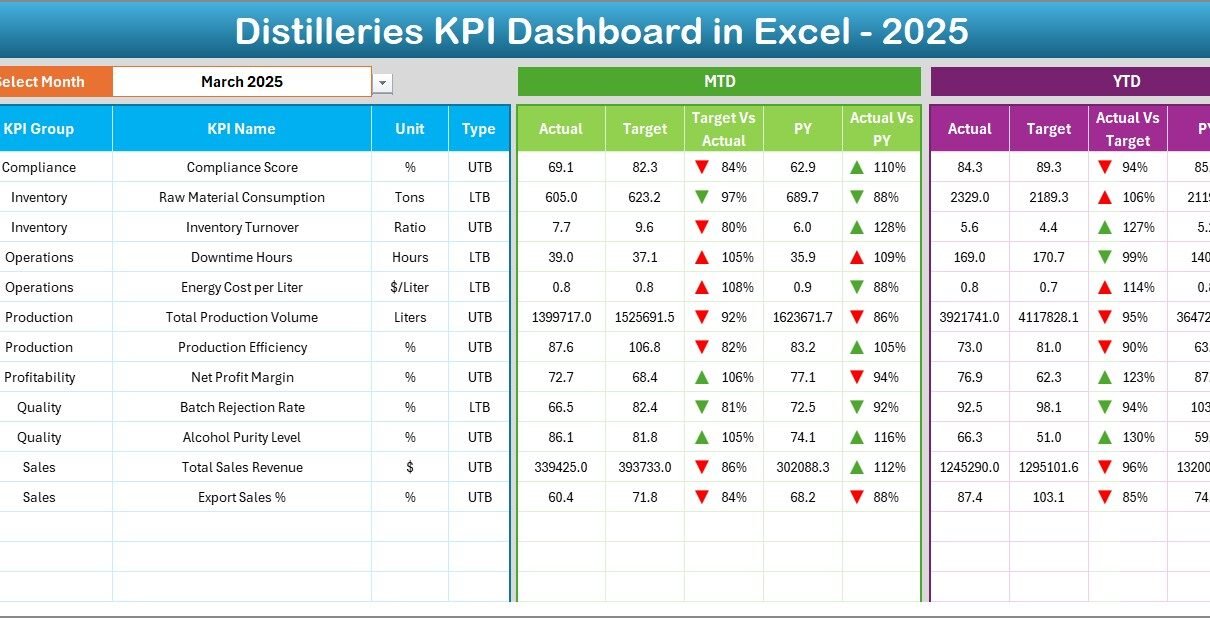
2️⃣ Dashboard Sheet – The Main Performance Center
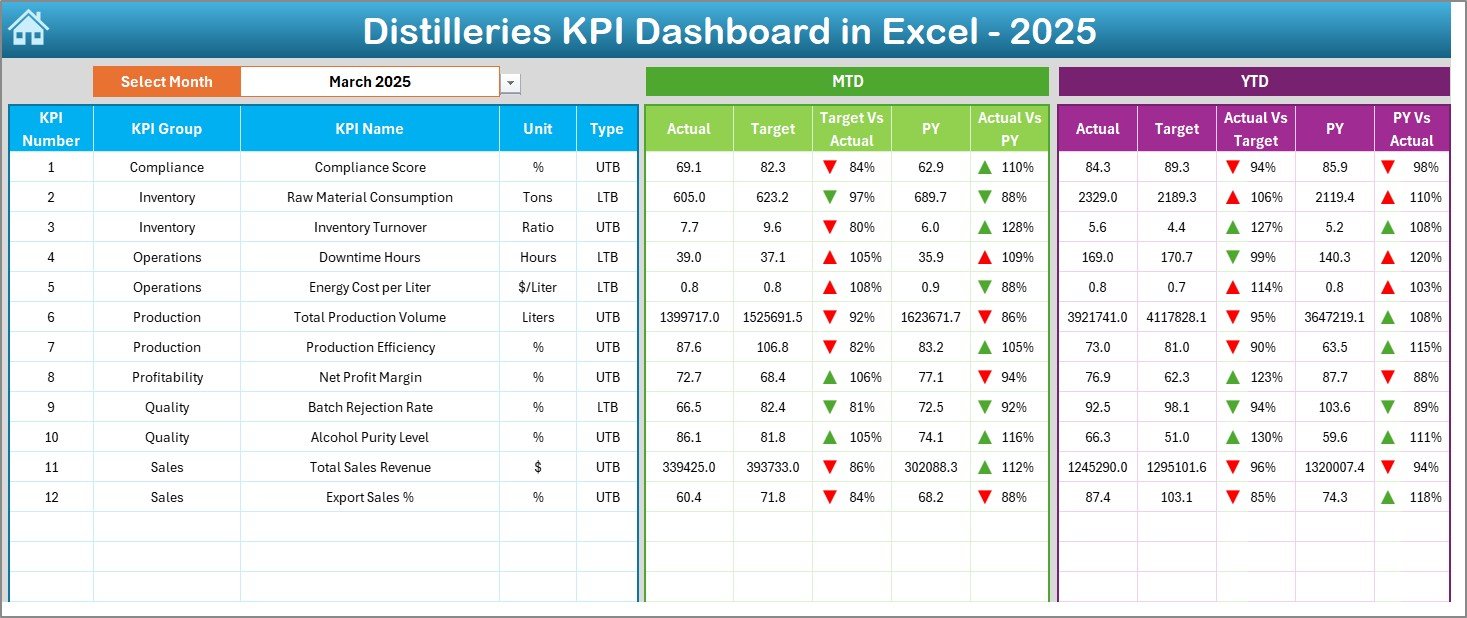
This is the most important sheet.
Here, you see all KPIs in one place.
What Can You Do on This Sheet?
-
Select Month from drop-down (Cell D3)
-
View MTD Actual
-
View MTD Target
-
View MTD Previous Year
-
Compare Target vs Actual
-
Compare PY vs Actual
-
View YTD numbers
-
Track arrow indicators
When you change the month from the drop-down, the entire dashboard updates automatically. As a result, you can review January, February, or any month instantly.
What Makes It Powerful?
-
Conditional formatting with up/down arrows
-
Clear comparison columns
-
Structured KPI list
-
Separate MTD and YTD analysis
Therefore, managers can immediately see which KPIs meet targets and which require attention.
Click to Purchases Distilleries KPI Dashboard in Excel
3️⃣ KPI Trend Sheet – Deep Performance Analysis
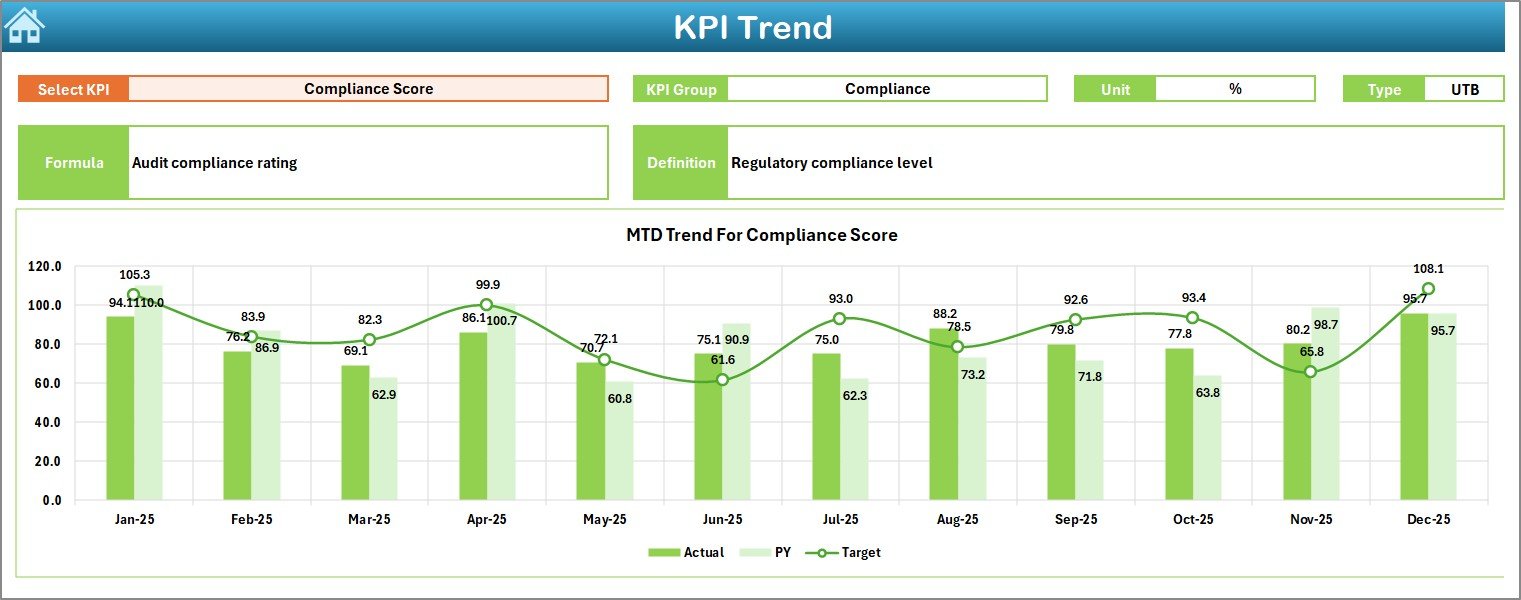
While the Dashboard sheet shows summary numbers, the KPI Trend Sheet shows detailed trends.
Here, you select a KPI from drop-down (Cell C3).
After that, the sheet displays:
-
KPI Group
-
KPI Unit
-
KPI Type (Lower the Better / Upper the Better)
-
Formula
-
Definition
Moreover, it shows:
-
MTD Trend Chart (Actual vs Target vs PY)
-
YTD Trend Chart (Actual vs Target vs PY)
Because of trend visualization, you identify:
-
Growth patterns
-
Decline trends
-
Seasonal changes
-
Performance consistency
Therefore, strategic decisions become easier.
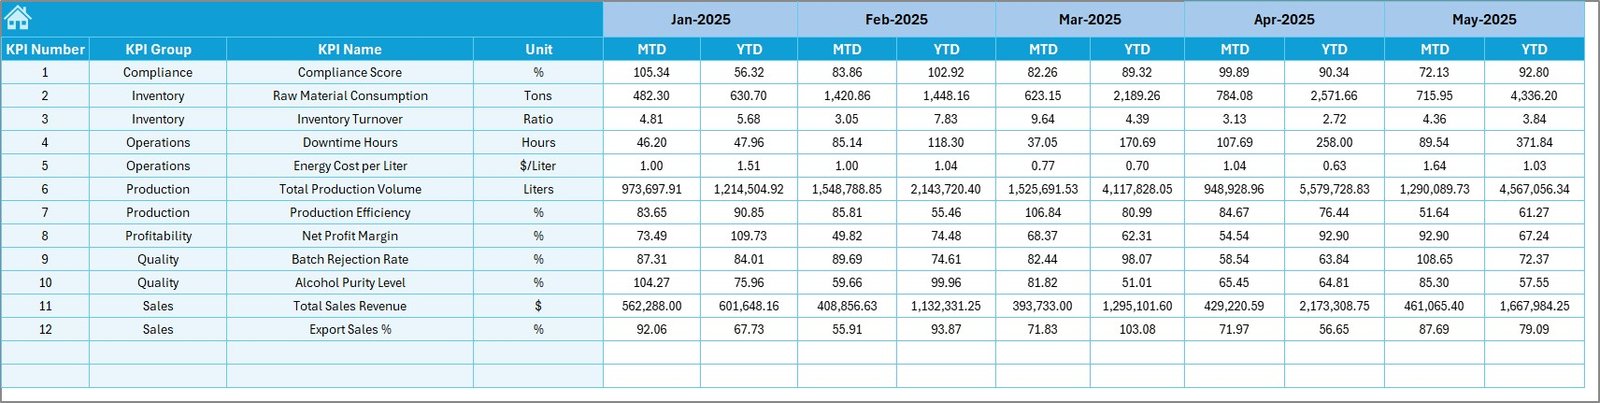
4️⃣ Actual Numbers Input Sheet – Where You Enter Real Data
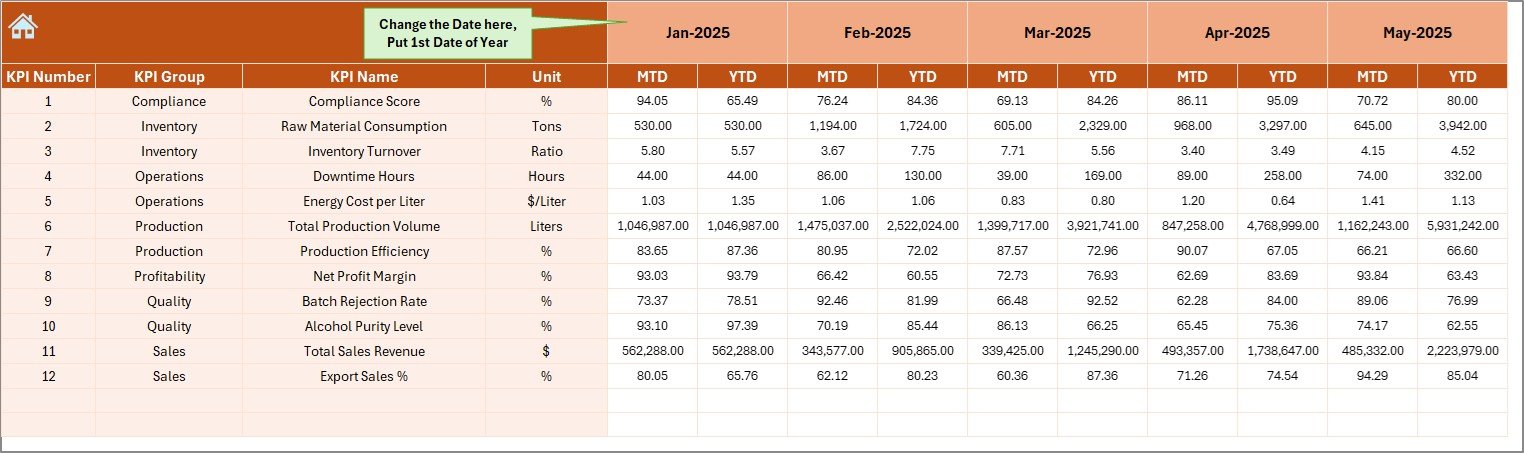
This sheet allows you to enter:
-
MTD Actual numbers
-
YTD Actual numbers
You can change the starting month from Cell E1. Once you set the first month of the year, the system adjusts automatically.
Since this sheet drives the dashboard, you must update it regularly.
5️⃣ Target Sheet – Define Performance Goals
Targets define expectations.
In this sheet, you enter:
-
Monthly Target (MTD)
-
Yearly Target (YTD)
Once you input targets, the dashboard compares actual performance against them.
Therefore, you can track:
-
Target achievement rate
-
Missed KPIs
-
Overachieved KPIs
-
Click to Purchases Distilleries KPI Dashboard in Excel
6️⃣ Previous Year Number Sheet – Historical Benchmark
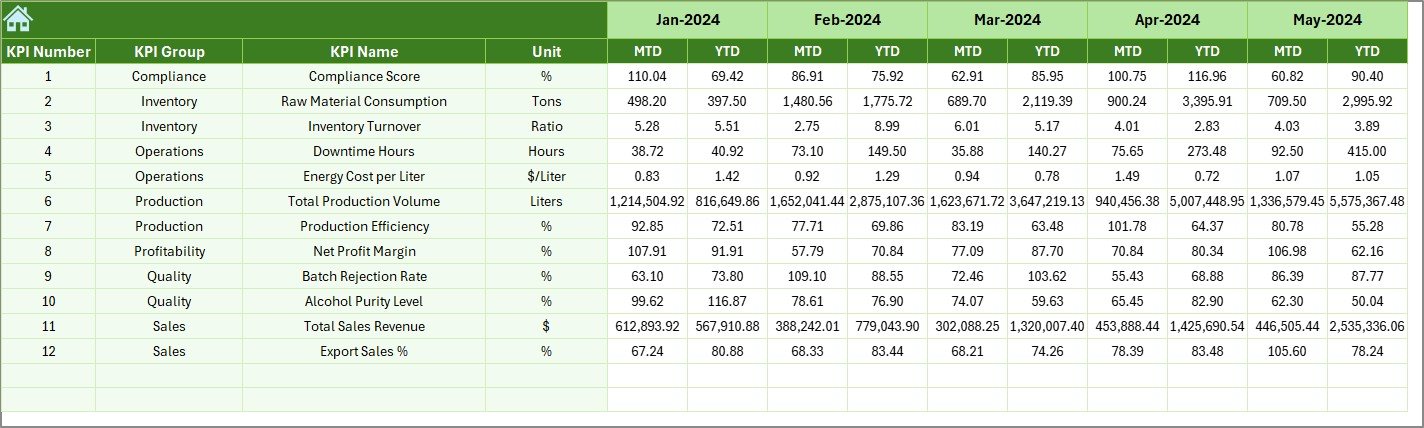
This sheet stores previous year data.
You enter numbers similar to the current year.
Then the dashboard compares:
-
Current year vs Previous year
-
Growth percentage
-
Performance change
Because of this comparison, you identify long-term improvement.
7️⃣ KPI Definition Sheet – Structured KPI Database
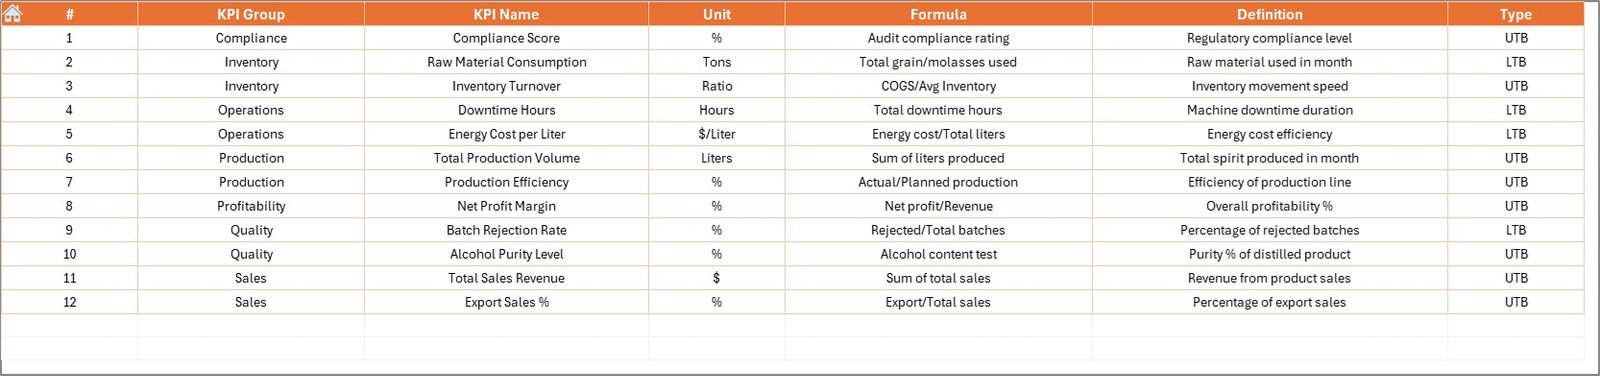
This sheet contains:
-
KPI Name
-
KPI Group
-
Unit
-
Formula
-
Definition
It also defines whether a KPI is:
-
LTB (Lower the Better)
-
UTB (Upper the Better)
This structure ensures clarity. Therefore, every team member understands each KPI correctly.
What KPIs Can You Track in a Distillery?
You can track multiple operational KPIs such as:
Production KPIs
-
Total Production Volume
-
Batch Completion Rate
-
Distillation Efficiency
-
Yield Percentage
Quality KPIs
-
Alcohol Purity Level
-
Quality Rejection Rate
-
Lab Test Compliance
Financial KPIs
-
Cost per Liter
-
Revenue per Batch
-
Gross Margin
Inventory KPIs
-
Raw Material Consumption
-
Finished Goods Inventory
-
Inventory Turnover
Sales KPIs
-
Monthly Sales Volume
-
Distributor Dispatch Rate
-
Sales Growth %
By tracking these KPIs consistently, you improve profitability.
Advantages of Distilleries KPI Dashboard in Excel
Now let us understand the benefits clearly.
1️⃣ Centralized Data Control
Instead of multiple files, you get one structured dashboard. Therefore, you avoid confusion.
2️⃣ Easy Month Selection
You change month from D3. Immediately, all numbers update. So, analysis becomes quick.
3️⃣ MTD and YTD Comparison
You track both short-term and long-term performance. As a result, you balance operational focus and strategic growth.
4️⃣ Visual Indicators
Up and down arrows highlight performance instantly. Therefore, managers save review time.
5️⃣ Previous Year Benchmarking
You compare current performance with last year. Consequently, you measure real growth.
6️⃣ Simple Data Entry
You enter numbers in dedicated sheets. So, errors reduce significantly.
7️⃣ No Complex Software Required
The dashboard works in Excel Desktop. Therefore, you avoid expensive BI tools.
8️⃣ Fully Customizable
You can add more KPIs. You can modify formulas. Hence, it adapts to your distillery size.
How Does This Dashboard Improve Decision-Making?
Click to Purchases Distilleries KPI Dashboard in Excel
When you use this dashboard regularly:
-
You identify underperforming KPIs quickly
-
You adjust production planning
-
You control cost overruns
-
You improve operational efficiency
-
You increase profitability
Moreover, you reduce guesswork. Instead, you rely on real numbers.
Best Practices for the Distilleries KPI Dashboard in Excel
If you want maximum results, follow these best practices.
1️⃣ Update Data Monthly
Enter actual numbers consistently. If you delay updates, analysis becomes weak.
2️⃣ Set Realistic Targets
Do not set unrealistic goals. Instead, analyze historical data first.
3️⃣ Review KPIs Weekly
Although the dashboard shows monthly data, review it weekly for better control.
4️⃣ Train Your Team
Ensure managers understand KPI definitions. Therefore, misinterpretation reduces.
5️⃣ Monitor LTB and UTB Carefully
For LTB KPIs (like rejection rate), lower numbers indicate better performance. So, review them correctly.
6️⃣ Use Trend Sheet for Strategy
Do not rely only on snapshot numbers. Instead, study trends before making decisions.
7️⃣ Keep KPI Definition Sheet Updated
Whenever you add a new KPI, update its formula and definition.
Who Can Use This Dashboard?
This dashboard benefits:
-
Distillery Owners
-
Production Managers
-
Quality Control Teams
-
Finance Managers
-
Sales Heads
-
Operations Analysts
Whether you run a small craft distillery or a large production plant, this tool supports performance monitoring.
How to Implement This Dashboard in Your Distillery?
Follow these steps:
-
Define your KPIs clearly
-
Enter KPI definitions in the KPI Definition Sheet
-
Input previous year data
-
Set monthly and yearly targets
-
Enter actual numbers every month
-
Review Dashboard sheet
-
Analyze trends
-
Take corrective actions
Because the structure remains simple, implementation becomes easy.
Why Excel Still Works for KPI Tracking?
Many companies use advanced BI tools. However, Excel offers:
-
Flexibility
-
Low cost
-
Easy customization
-
Wide usability
-
Quick deployment
Moreover, most teams already understand Excel. Therefore, adoption becomes faster.
Conclusion
Click to Purchases Distilleries KPI Dashboard in Excel
Distillery operations demand precision. However, without structured KPI monitoring, you risk inefficiency and profit loss.
The Distilleries KPI Dashboard in Excel solves this challenge. It provides:
-
Structured KPI tracking
-
MTD and YTD comparison
-
Previous year benchmarking
-
Visual indicators
-
Trend analysis
-
Simple data entry system
As a result, you gain operational clarity. Furthermore, you improve production efficiency. Most importantly, you make better decisions backed by data.
If you want to control production, improve yield, reduce cost, and increase profitability, this dashboard gives you the structure you need.
Frequently Asked Questions with Answers
1. What is a Distilleries KPI Dashboard in Excel?
It is a ready-to-use Excel template that helps distilleries track production, quality, financial, and sales KPIs using MTD, YTD, and previous year comparisons.
2. Can I customize the KPIs in this dashboard?
Yes. You can add, modify, or remove KPIs easily. You can update formulas and definitions in the KPI Definition sheet.
3. Does the dashboard update automatically when I change the month?
Yes. When you select a month from Cell D3, the entire dashboard updates automatically.
4. What does LTB and UTB mean?
LTB means Lower the Better. For example, rejection rate.
UTB means Upper the Better. For example, production volume.
5. Do I need advanced Excel skills to use this dashboard?
No. You only need basic Excel knowledge to enter data and select months.
6. Can small distilleries use this dashboard?
Yes. Small craft distilleries and large production units can both use it.
7. How often should I update the dashboard?
You should update it monthly. However, weekly reviews improve control.
8. Can I use this dashboard for other beverage industries?
Yes. You can customize it for breweries, wineries, and beverage plants.
Visit our YouTube channel to learn step-by-step video tutorials