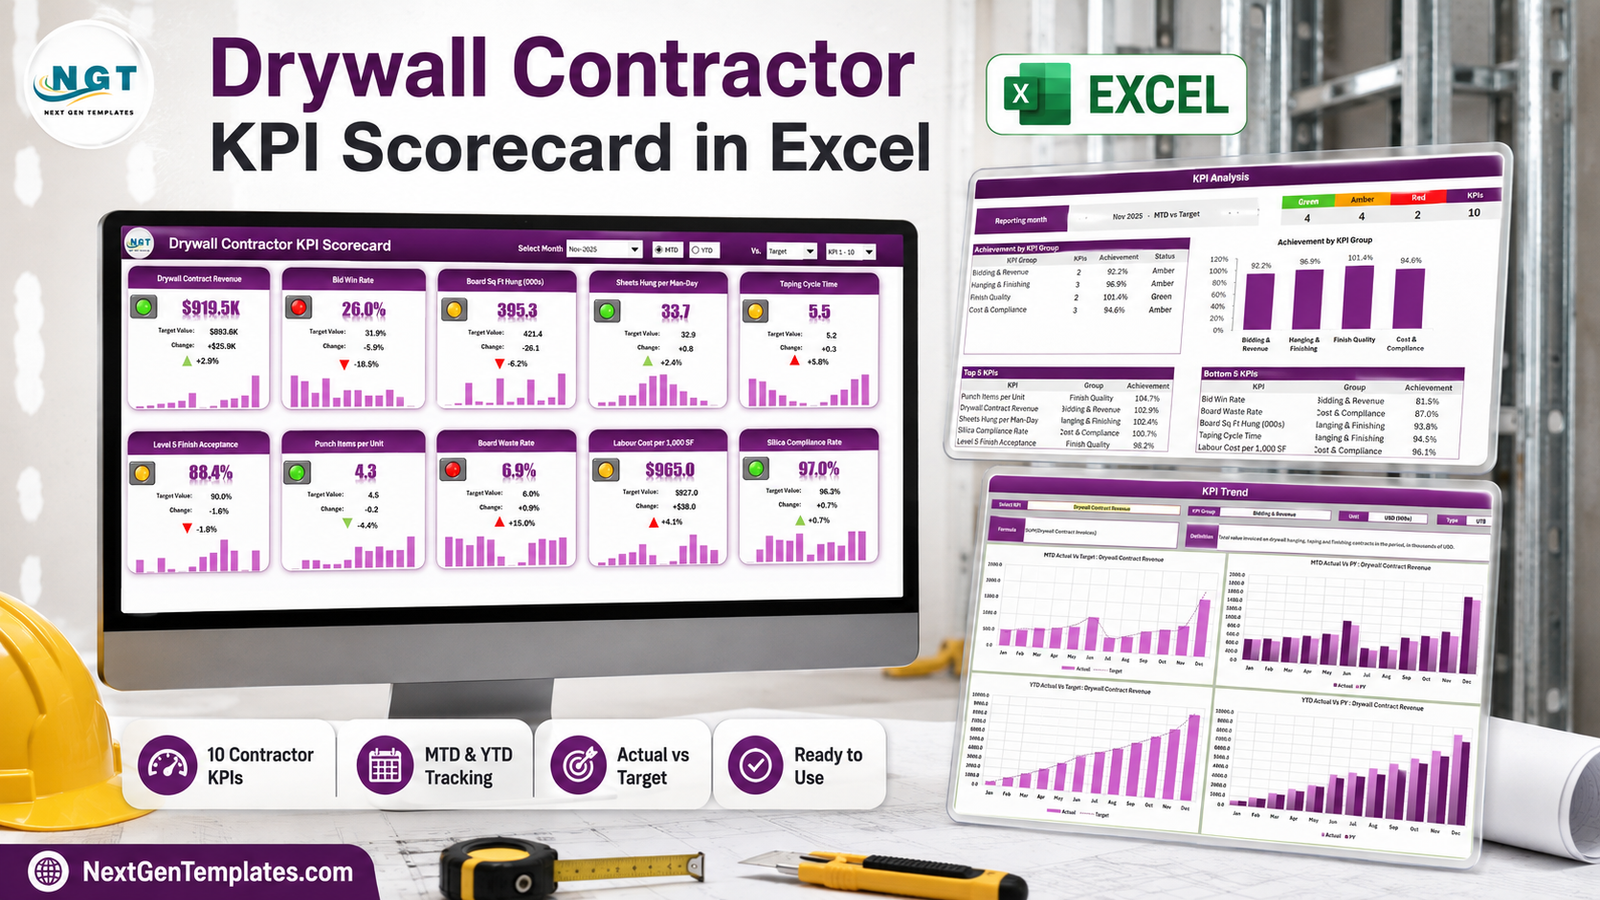
Most drywall subcontractors already own their numbers. Board area hung is on the foreman’s sheet, scrap is on the supplier invoice, taper hours are in payroll, and the bid log lives in someone’s inbox. What almost nobody has is the one page that puts all of them side by side, month after month, in the same shape – so that a bad month looks different from a good one at a glance rather than after an hour of spreadsheet archaeology.
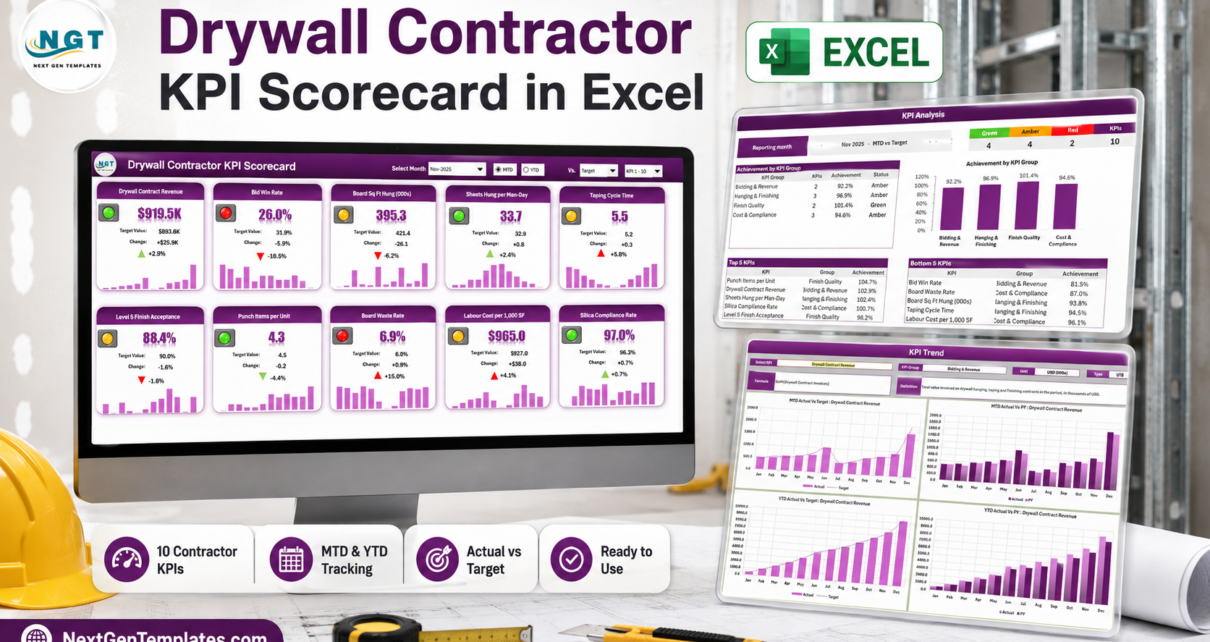
The Drywall Contractor KPI Scorecard in Excel is that page. Ten drywall KPIs in four groups, a month picker, an MTD/YTD switch, and traffic lights that know which direction is good. The sample file ships with a complete 2025 year loaded: pick November 2025 and you get 4 Green, 4 Amber and 2 Red, with Bid Win Rate sitting at the bottom of the Bottom 5 table on 81.5% achievement. It is 100% formulas – no macros, no Power Query, no add-ins – and it opens on any Excel from 2016 onward.
One thing worth naming up front, because two NextGenTemplates families have almost the same title: this is the KPI Scorecard line. It is a monthly reporting page built around a month picker and a KPI Definition sheet you rename. It is not the slicer-driven Excel KPI Dashboard line, which is built for interactive analysis across a dataset. Different tools, different questions.
Key Features of the Drywall Contractor KPI Scorecard
- Ten drywall KPIs, four groups. Bidding & Revenue (2), Hanging & Finishing (3), Finish Quality (2), Cost & Compliance (3).
- Direction-aware traffic lights. Six KPIs are Upper-the-Better, four are Lower-the-Better. Board Waste Rate rising shows red and a red arrow; Punch Items per Unit falling shows green and a green arrow.
- A month picker plus MTD / YTD. A separate Vs. selector compares against Target, against the same period last year, or against the Prior Month.
- A 12-month sparkline on every tile, next to value, target, absolute change and percentage change.
- Editable RAG bands. Green at or above target, Amber within 10%, Red beyond that – all three thresholds are cells on the Color Settings sheet.
- Room for 20 KPIs. Ten arrive filled in; the Scorecard header carries a KPI 1-10 / KPI 11-20 set picker.
- Every KPI renameable. The workbook looks KPIs up by name, and a Check column flags duplicates.
- No macros. Formulas, conditional formatting, camera pictures and native sparklines.
The Ten Drywall KPIs, and Why They Are the Ten
The KPI Definition sheet carries a formula, a plain-English definition, a unit, a direction and a YTD basis for each. Here is the shipped set, with the November 2025 sample figures:
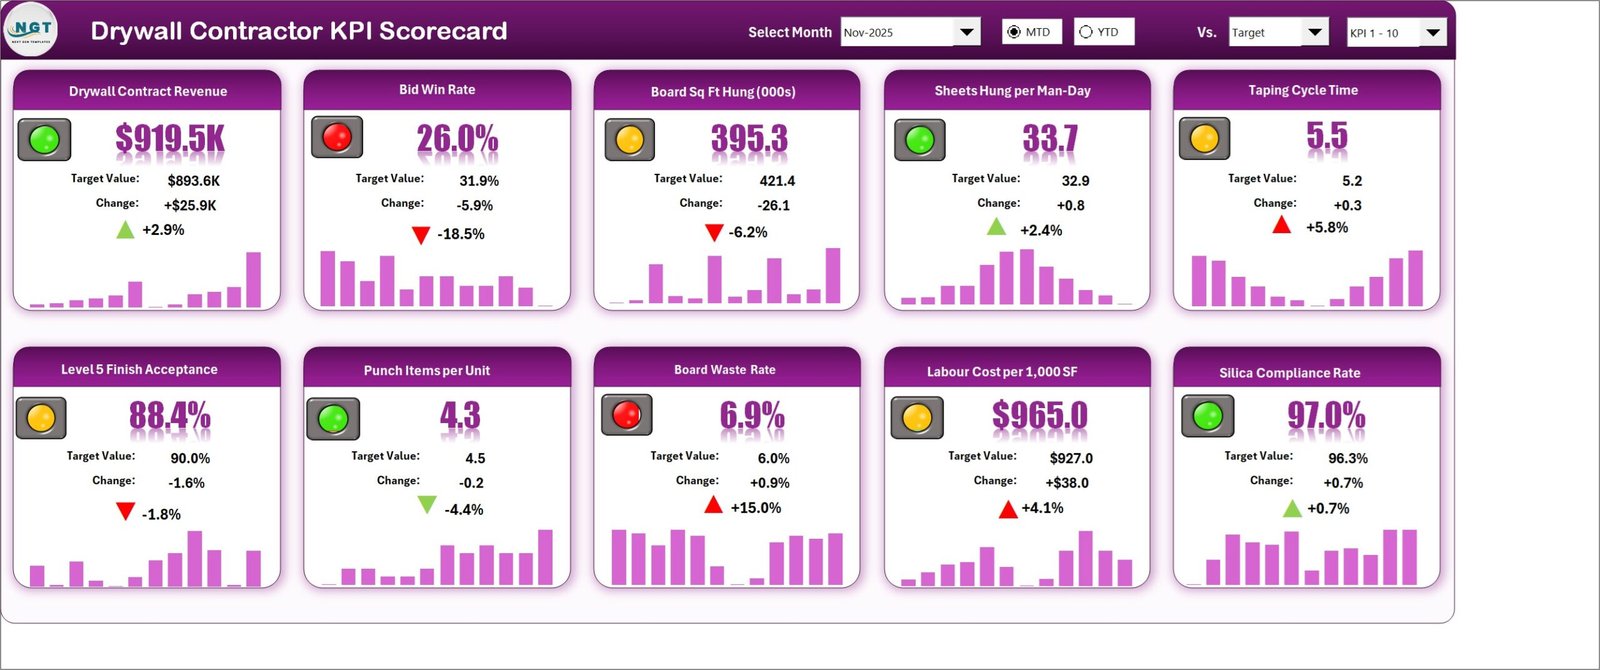
- Drywall Contract Revenue (UTB, USD 000s) – SUM of drywall contract invoices. $919.5K against a $893.6K target, green.
- Bid Win Rate (UTB, %) – bids won divided by bids submitted. 26.0% against 31.9%, red, and the weakest KPI in the file.
- Board Sq Ft Hung (000s) (UTB) – gypsum board area hung and signed off by the foreman. 395.3 against 421.4, amber.
- Sheets Hung per Man-Day (UTB) – 4×12 sheets a hanger sets in a full working day. 33.7 against 32.9, green.
- Taping Cycle Time (LTB, days) – calendar days from board hung to final coat sanded and ready for the painter. 5.5 against 5.2, amber.
- Level 5 Finish Acceptance (UTB, %) – areas accepted by the GC at the first light-test walkthrough. 88.4% against 90.0%, amber.
- Punch Items per Unit (LTB) – nail pops, cracked joints and bad corners raised per unit handed over. 4.3 against 4.5, green.
- Board Waste Rate (LTB, %) – delivered board lost to offcuts, breakage and damaged sheets. 6.9% against 6.0%, red.
- Labour Cost per 1,000 SF (LTB, USD) – loaded hanger and taper cost per thousand square feet hung and finished. $965.0 against $927.0, amber.
- Silica Compliance Rate (UTB, %) – audited sanding tasks performed with compliant dust extraction or wet-sanding controls. 97.0% against 96.3%, green.
That last one deserves a caveat, and the workbook does not pretend otherwise: it is a percentage you calculate and type. The file keeps no exposure records and holds no employee data. If you need to satisfy the OSHA respirable crystalline silica standard for construction, you need a recordkeeping process, not a scorecard tile. What the tile is good for is noticing, in month three, that the number has drifted from 97% to 84%.
The Nine Sheets, Page by Page
Home
Eight navigation tiles, each with a one-line description of what the sheet does. The footer states the workbook’s own contract plainly: 100% formulas, no macros, no Power Query, no add-ins.
Scorecard
The month tile wall. Ten cards, each with a traffic light, the value, the target, the change in units and in percent, a coloured arrow that respects direction, and a 12-month sparkline. The header holds Select Month, the MTD/YTD radio pair, the Vs. dropdown and the KPI set picker.
KPI Analysis
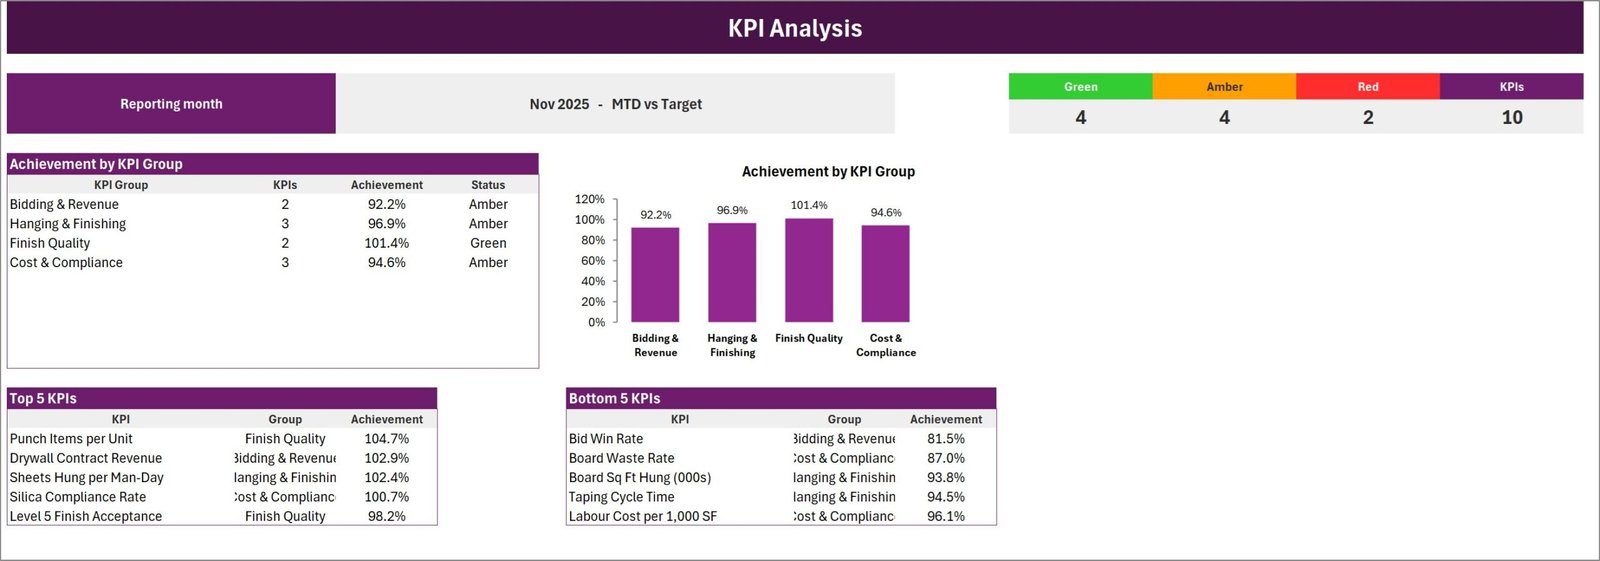
The roll-up. Green / Amber / Red counts against the total (4 / 4 / 2 / 10 in the sample), an Achievement by KPI Group table with a matching column chart, and Top 5 / Bottom 5 tables. In November 2025 Finish Quality is the only green group at 101.4%; Bidding & Revenue is weakest at 92.2%, Cost & Compliance at 94.6% and Hanging & Finishing at 96.9%.
KPI Trend
One KPI at a time. Pick a KPI and the page shows its group, unit, direction, formula and definition, then four charts: MTD Actual vs Target, MTD Actual vs PY, YTD Actual vs Target and YTD Actual vs PY. This is the page for the “is this a bad month or a bad year” conversation.
Input Data
Where you work. One numbered block per KPI, twelve rows each, with MTD Actual / Target / PY and YTD Actual / Target / PY columns. Nothing else in the workbook needs editing.
KPI Definition
The other sheet you edit. Name, group, unit, formula, definition, Type (UTB or LTB), YTD Basis and a Check column that turns red if two KPIs share a name.
Color Settings, Read Me and Get More Templates
Color Settings holds the RAG bands, the report title and the reporting year – the year feeds the month picker so it reads Nov-2025 rather than Nov. Read Me is a genuinely short, honest guide to the wiring. Get More Templates is the catalogue page.
Excel Scorecard vs. Google Sheets vs. Construction SaaS – Feature Comparison
| This scorecard (Excel) | Google Sheets scorecard | Procore / Buildertrend | |
|---|---|---|---|
| Cost | $9.99 one-off | $8.99 one-off | $300+ per month, typical |
| Platform | Excel 2016+ desktop | Browser, any device | Browser and mobile app |
| Setup time | Under 30 minutes | Under 30 minutes | Weeks, with onboarding |
| Real-time collaboration | No – one workbook | Yes | Yes |
| Mobile access | Excel mobile, read-friendly | Yes | Yes |
| Custom KPI names | Yes – all 20 slots | Yes | Vendor’s fields only |
| Share with a link | No – send the file | Yes | Yes |
| Year-1 cost at 5 users | $9.99 | $8.99 | $3,600+ |
| Pulls job costs automatically | No – typed monthly | No | Yes |
| Works offline | Yes | No | No |
Who Should Use This Template
Drywall and interior-finishing subcontractors running roughly 5 to 60 hangers and tapers, who already keep job figures somewhere and want one repeatable page for a Monday review, a GC meeting or a lender. Estimators who want Bid Win Rate visible next to revenue. Operations managers who are currently emailing six screenshots and would rather send two.
It is a poor fit if you expect the numbers to arrive on their own, if you need several people editing the same file at the same time, or if you want an estimating and job-costing system. It is also a poor fit if you will not maintain it – a scorecard that stops in March is worse than no scorecard.
Real-World Use Cases
Arguing about scrap with a GC. Board Waste Rate at 6.9% against a 6.0% target, red, with twelve months of sparkline behind it, is a different conversation from “we think there’s a lot of waste on this job.”
Finding the real bottleneck. Taping Cycle Time at 5.5 days against 5.2 looks minor until KPI Trend shows it drifting every month since summer while Sheets Hung per Man-Day held steady – the crew is not slower, the finishing queue is longer.
Making the case to fix bidding. A 26.0% win rate that ranks last on achievement at 81.5% is the argument for reworking the bid template, and it is one screenshot.
Advantages of the Drywall Contractor KPI Scorecard
- Nothing to enable. No macro prompt, no add-in, no trust-centre exception – which matters when the file has to go to a GC or a bank.
- Direction is respected everywhere. Light, arrow and achievement percentage all invert for the four LTB KPIs, so a rising cost never shows green.
- Tiny and portable. A few hundred KB. It emails, it opens on a laptop in a site office, it works with no internet.
- It is yours to rename. The drywall KPIs are a starting point, not a cage – swap any of them and the whole workbook follows.
- Honest sample data. A full 2025 year is loaded, so you can test the month picker and the comparisons before typing anything.
Opportunities for Improvement
Three, stated plainly.
YTD is typed, not calculated. You supply the YTD Actual, Target and PY columns yourself. The Read Me explains why – the correct roll-up is a sum for revenue and board area but an average for rates like Bid Win Rate – and the YTD Basis column on KPI Definition is where you record the rule you used. It is the right design decision, but it is more typing than a workbook that guessed for you.
No integrations of any kind. There is no connector to Buildertrend, Procore, Knowify or QuickBooks, no import routine and no API. Monthly data entry is the workflow.
It is a single-user desktop file. Two people cannot edit it at once. If that matters more than offline use and macro-free portability, the Google Sheets edition of this scorecard is the better shape – it is in preparation and not on sale yet.
Best Practices
- Set Color Settings first. Title, reporting year and the Amber/Red thresholds. Ten percent is a sensible default, but a 10% miss on Silica Compliance Rate is not the same thing as a 10% miss on revenue – many contractors tighten the bands for the compliance group.
- Fix the KPI Definition sheet before you type a single figure. Names, units, direction and YTD basis. Renaming later is safe, but re-deciding direction after you have read three months of lights is not.
- Close the month the same way every time. Same source for board area, same source for labour cost. A KPI that changes its own definition mid-year is worse than no KPI.
- Present with two pages, not nine. Scorecard for the month, KPI Analysis for the group story. Open KPI Trend only when somebody challenges a number.
- Use the Prior Month comparison in a growth year. Against Target everything looks amber when targets ratchet; against Prior Month you see whether the crew is actually improving.
- Keep one file per year. The reporting year is a single cell, so January is a save-as, not a rebuild. Microsoft’s guide to sparklines in Excel is worth ten minutes if you want to restyle the tile trends.
Explore Relevant Templates
The same scorecard for neighbouring trades, all live: Masonry Contractor KPI Scorecard in Excel, Welding Shop KPI Scorecard in Excel, Flooring Installation KPI Scorecard in Excel and Painting Contractor KPI Scorecard in Excel. Each ships its own KPI set – they are not the same ten metrics with the trade name swapped.
If you want interactive slicers instead of a month picker, look at the Painting Contractor KPI Dashboard in Excel as a sample of that line.
Frequently Asked Questions
Does it connect to Buildertrend, Procore, Knowify or QuickBooks?
No – to all four. There is no connector, no import and no API. You type each month’s figures on Input Data.
Do I need to enable macros?
No. It is 100% formulas, conditional formatting, camera pictures and sparklines, delivered as a .xlsx. Nothing to enable and nothing to trust.
Which Excel versions work?
Excel 2016 and later on Windows, and Microsoft 365. It opens on Excel for Mac and Excel mobile for reading; the header controls are most comfortable on desktop.
Can I use my own KPIs instead of the drywall ten?
Yes. Rename them on KPI Definition and the Scorecard, KPI Analysis and KPI Trend follow automatically, because every page looks a KPI up by name. There is room for 20.
Does it calculate year-to-date automatically?
No. You type YTD alongside MTD. See “Opportunities for Improvement” above for why.
Does it send alerts or reminders when a KPI goes red?
No. There is no email, no notification and no scheduling. It is a workbook you open.
Is this the same as the Excel KPI Dashboard with the same name?
No. The dashboard line is slicer-driven and analytical; this is a monthly scorecard driven by a month picker. Several contractors own one of each.
What exactly is in the download?
A single ZIP containing the .xlsx workbook and the Excel KPI Scorecard user manual as a PDF. Nothing else.
About the Author
Built by PK – Microsoft Certified Professional with 15+ years of Excel, Google Sheets, and Power BI experience. Founder of NextGenTemplates, reaching 300K+ subscribers across YouTube channels. Every template is hand-built and tested before release.
Conclusion
A drywall business is measured in board area, cycle time, scrap and win rate, and those four things almost never sit on the same page. This scorecard puts them there, keeps the shape identical from January to December, and does it in a macro-free workbook you can email to anyone. It will not fetch your numbers, and it says so in its own Read Me – but if you are willing to spend twenty minutes a month typing them, you get a page that makes a bad month obvious in five seconds.
Get the Drywall Contractor KPI Scorecard in Excel – $9.99, instant download, user manual included.
For step-by-step Excel tutorials, subscribe at youtube.com/@PKAnExcelExpert.