Election management demands accuracy, transparency, and real-time monitoring. However, many election offices still rely on scattered sheets and manual reports. As a result, leaders struggle to track voter turnout, polling readiness, complaint resolution, and operational performance in one place.So, how can election commissions monitor key performance indicators clearly and efficiently?You need an Election Commissions KPI Dashboard in Excel.This ready-to-use Excel template helps election authorities track monthly and yearly performance using structured KPI data. Moreover, it provides interactive views, trend analysis, and variance tracking. Instead of reviewing multiple files, you can select a month and instantly analyze all KPIs in one centralized dashboard.
In this detailed guide, you will learn:
- What an Election Commissions KPI Dashboard in Excel is
- Why election authorities need it
- Complete explanation of all 7 worksheets
- Key KPIs you can track
- Advantages of Election Commissions KPI Dashboard in Excel
- Best Practices for the Election Commissions KPI Dashboard
- Frequently Asked Questions with Answers
Click to buy Election Commissions KPI Dashboard in Excel
What Is an Election Commissions KPI Dashboard in Excel?
An Election Commissions KPI Dashboard in Excel is a structured performance tracking system built inside Microsoft Excel. It allows election authorities to measure, monitor, and analyze electoral operations using predefined KPIs.
Instead of depending on manual calculations, this dashboard automatically compares:
- MTD (Month-To-Date) Actual vs Target
- MTD Actual vs Previous Year
- YTD (Year-To-Date) Actual vs Target
- YTD Actual vs Previous Year
Additionally, it highlights performance using conditional formatting arrows. Therefore, decision-makers can quickly identify whether performance improves or declines.
In short, this dashboard transforms raw electoral data into meaningful performance insights.
Why Do Election Commissions Need a KPI Dashboard?
Election operations involve thousands of activities. For example:
- Voter registration drives
- Polling station preparation
- Staff training sessions
- Ballot distribution
- Complaint resolution
- Result declaration timelines
However, without a structured tracking system, monitoring becomes difficult. Therefore, leadership often reacts late to operational gaps.
A KPI dashboard solves this problem. It provides:
- Centralized reporting
- Real-time monthly tracking
- Performance comparison with targets
- Historical year comparison
- Clear trend analysis
Consequently, election authorities make faster and smarter decisions.
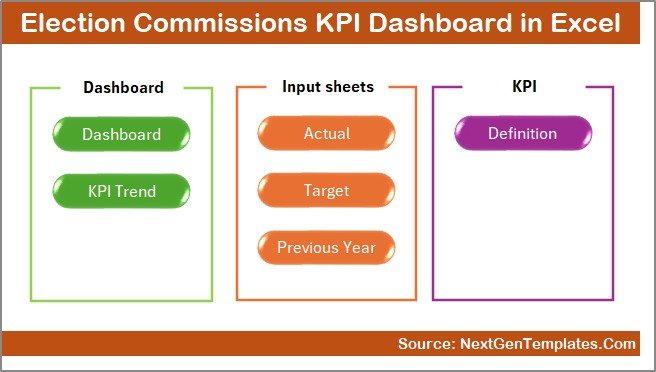
What Are the 7 Worksheets in the Election Commissions KPI Dashboard in Excel?
This template includes 7 well-structured worksheets. Each sheet plays a specific role in the monitoring process.
Let us understand each one in detail.
Summary Page – Your Navigation Control Center
The Summary Page acts as an index sheet. Here, you get 6 navigation buttons that allow you to jump directly to other sheets.
Because of this structured navigation:
- Users save time
- Reports look professional
- Movement across sheets becomes smooth
Moreover, this page improves user experience, especially during presentations.
Click to buy Election Commissions KPI Dashboard in Excel
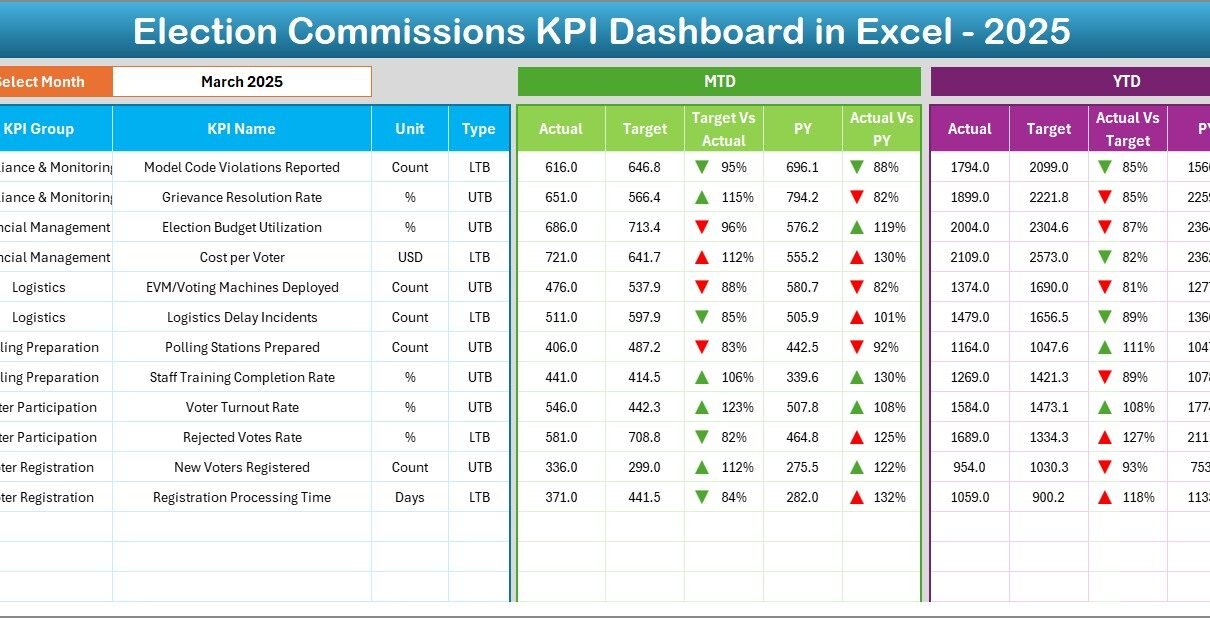
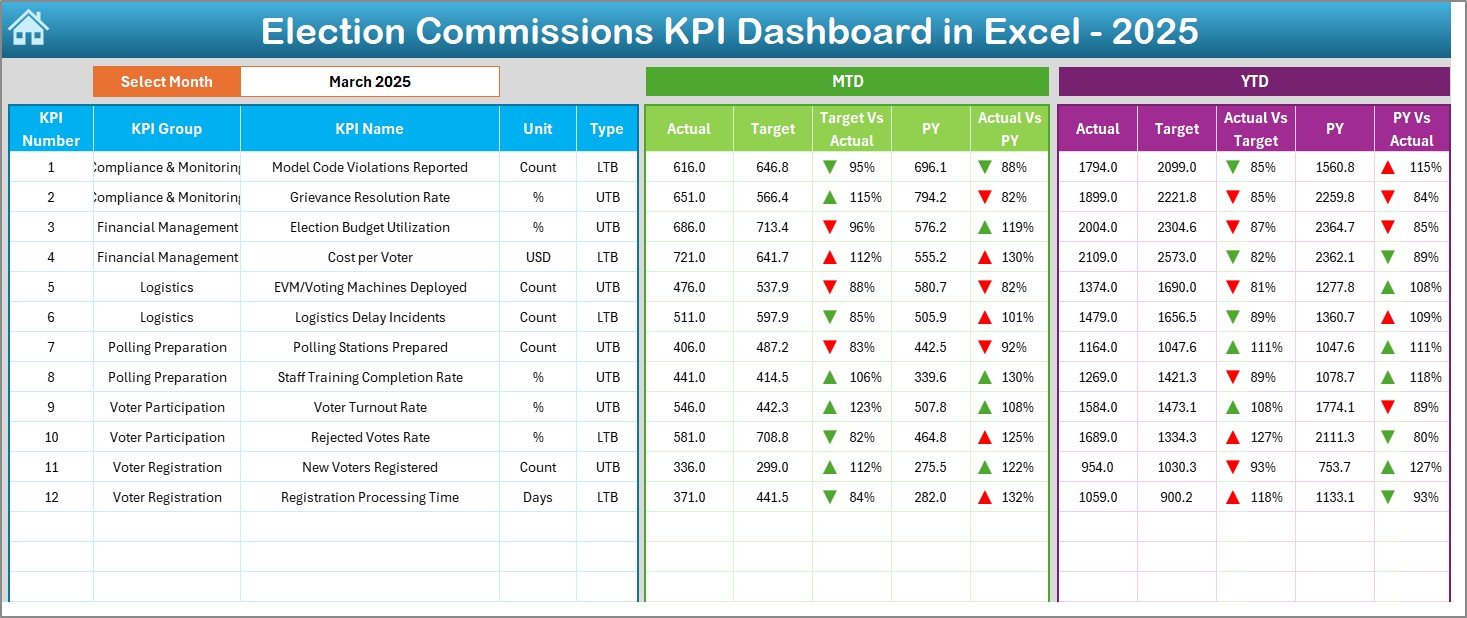
Dashboard Sheet – The Main KPI Monitoring Page
This is the heart of the entire system.
Here, you can select the Month from cell D3 using a drop-down menu. Once you select the month, the entire dashboard updates automatically.
What Does the Dashboard Display?
It shows:
- MTD Actual
- MTD Target
- MTD Previous Year
- Target vs Actual comparison
- Previous Year vs Actual comparison
- YTD Actual
- YTD Target
- YTD Previous Year
- YTD Target vs Actual
- YTD Previous Year vs Actual
Additionally, it uses conditional formatting arrows:
- Up arrow for improvement
- Down arrow for decline
Therefore, you can quickly understand performance without reading complex numbers.
Click to buy Election Commissions KPI Dashboard in Excel
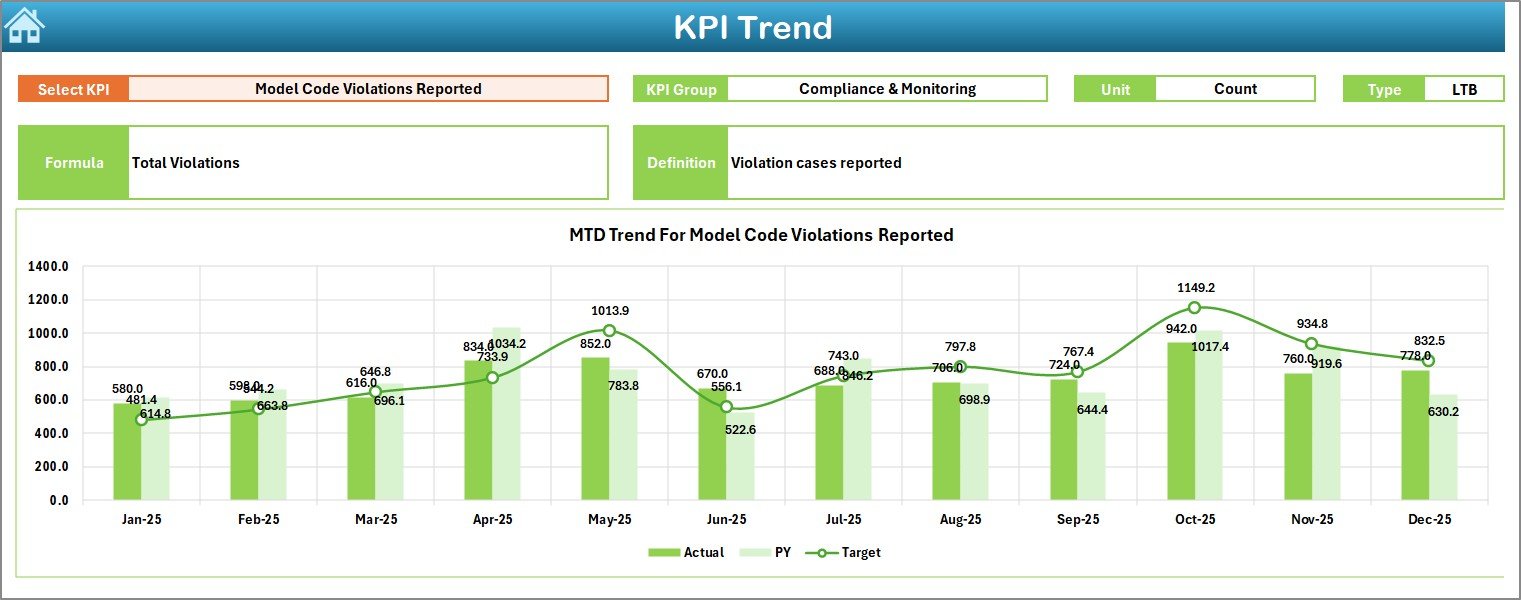
Trend Sheet – Analyze KPI Performance Over Time
The Trend sheet provides detailed analysis for a selected KPI.
On cell C3, you can choose a KPI from a drop-down list.
Once selected, the sheet displays:
- KPI Group
- KPI Unit
- KPI Type (Lower the Better or Upper the Better)
- KPI Formula
- KPI Definition
Moreover, it shows:
- MTD trend chart (Actual, Target, Previous Year)
- YTD trend chart (Actual, Target, Previous Year)
As a result, you can analyze performance patterns across months.
Click to buy Election Commissions KPI Dashboard in Excel
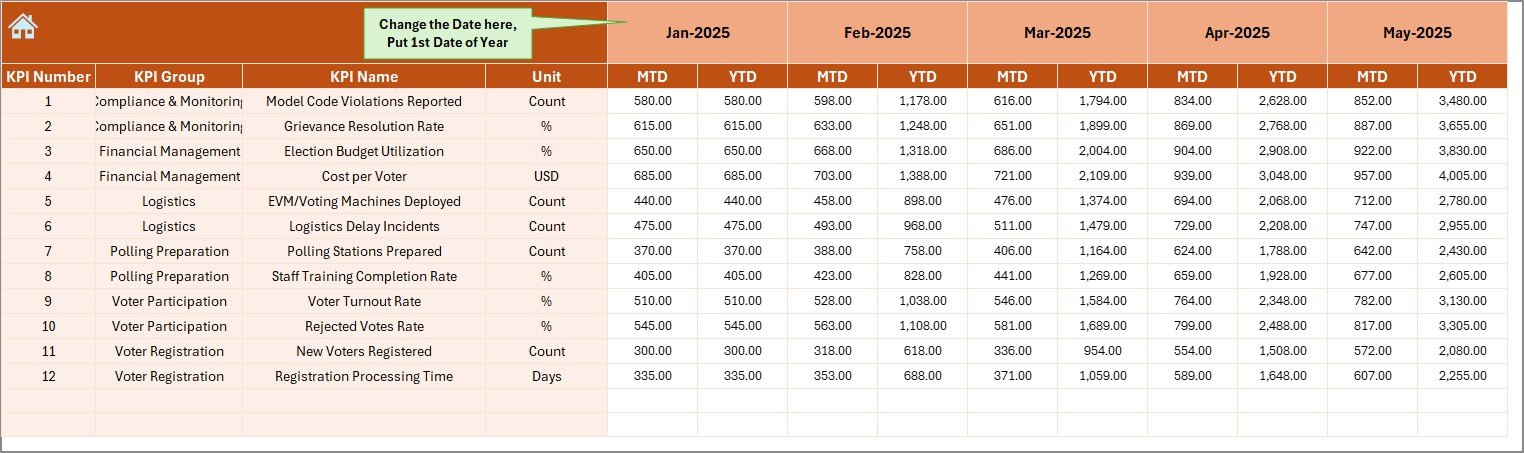
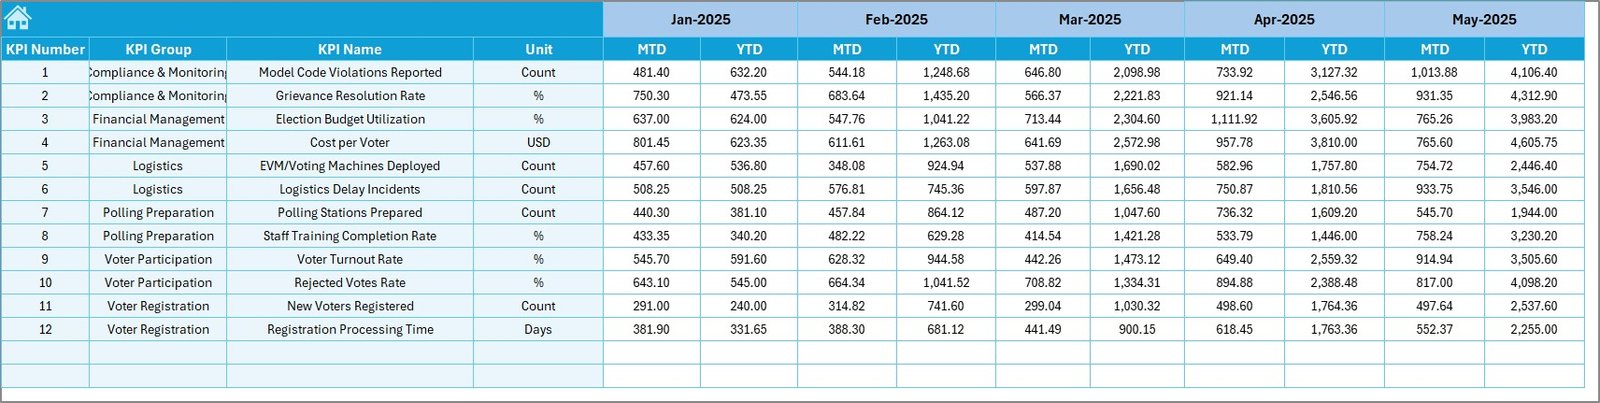
Actual Numbers Input Sheet – Enter Current Data
This sheet allows you to input actual KPI values.
On cell E1, you enter the first month of the year. After that, you can input:
- MTD Actual values
- YTD Actual values
Since the dashboard connects directly to this sheet, any update here reflects automatically across the system.
Click to buy Election Commissions KPI Dashboard in Excel
Target Sheet – Define Monthly and Yearly Goals
Here, you enter target values for each KPI.
You must input:
- Monthly Target (MTD)
- Yearly Target (YTD)
Because target comparison drives performance tracking, this sheet becomes critical.
Click to buy Election Commissions KPI Dashboard in Excel
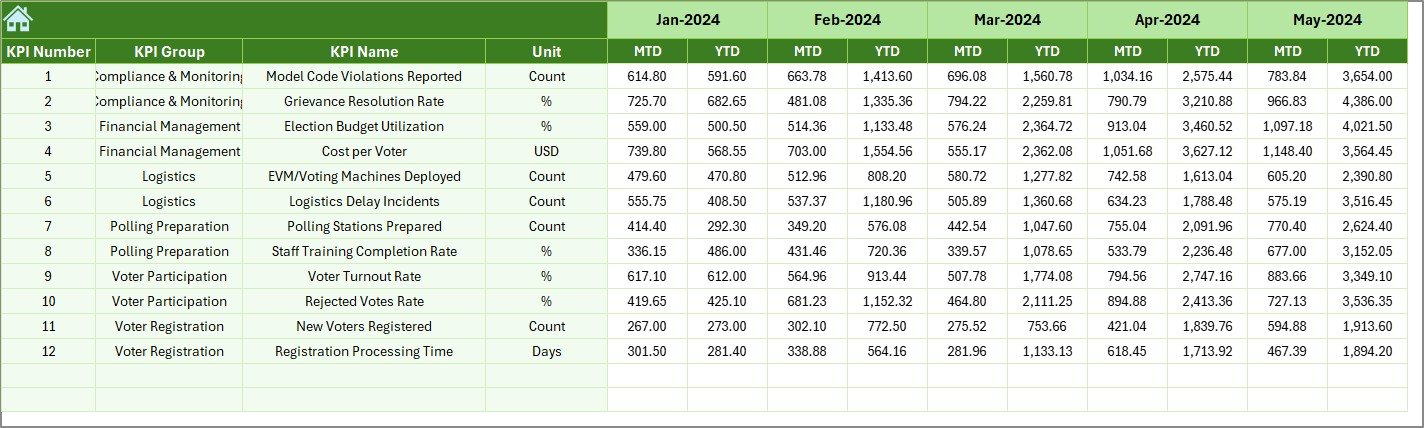
Previous Year Number Sheet – Historical Comparison
This sheet stores last year’s performance numbers.
You enter:
- MTD Previous Year values
- YTD Previous Year values
Then, the dashboard compares current performance with historical data.
As a result, election authorities identify improvement or decline.
Click to buy Election Commissions KPI Dashboard in Excel
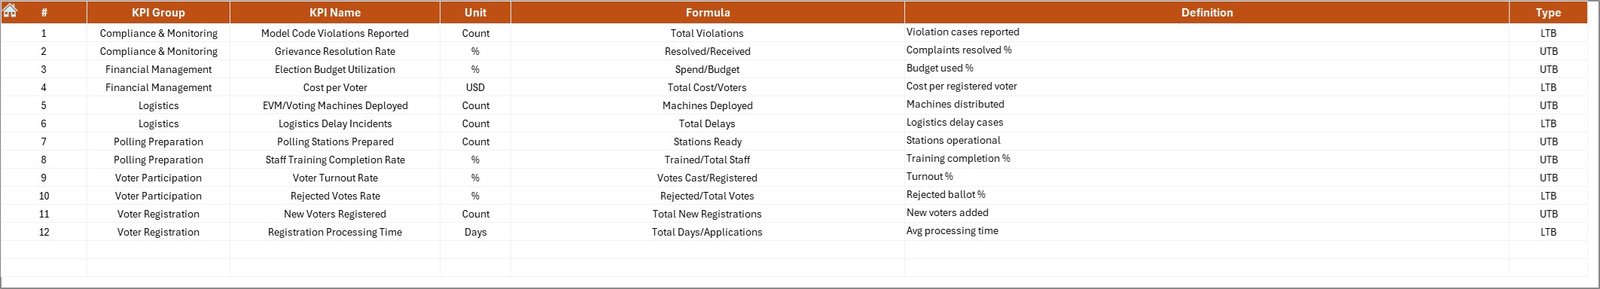
KPI Definition Sheet – Structured KPI Documentation
This sheet acts as the foundation of the system.
Here, you define:
- KPI Name
- KPI Group
- Unit
- Formula
- KPI Definition
Because of this structured documentation, users understand every KPI clearly.
Click to buy Election Commissions KPI Dashboard in Excel
What KPIs Can Election Commissions Track?
You can customize the dashboard for various electoral KPIs. For example:
Operational KPIs
- Polling stations prepared on time
- Staff training completion rate
- Ballot distribution accuracy rate
- Logistics readiness percentage
Voter Engagement KPIs
- Voter registration growth rate
- Voter turnout percentage
- Youth voter participation rate
- Awareness campaign coverage
Complaint & Transparency KPIs
- Complaint resolution rate
- Average complaint resolution time
- Transparency compliance score
- Audit completion rate
Financial KPIs
- Budget utilization percentage
- Cost per polling station
- Cost variance
Because the dashboard allows flexible KPI definition, you can adapt it to any electoral framework.
Advantages of Election Commissions KPI Dashboard in Excel
Why Should Election Authorities Use This Dashboard?
This dashboard offers multiple benefits.
Centralized Monitoring
You track all KPIs in one place. Therefore, you avoid scattered files.
Monthly Performance Tracking
You select a month from D3 and instantly review performance.
MTD and YTD Comparison
You monitor both short-term and long-term progress.
Target vs Actual Tracking
You identify gaps quickly.
Previous Year Comparison
You evaluate improvement trends.
Visual Indicators
Conditional arrows simplify decision-making.
Easy Customization
You can add or modify KPIs easily.
No Advanced Software Required
You only need Microsoft Excel.
Because of these advantages, this dashboard becomes a powerful management tool.
How Does This Dashboard Improve Electoral Transparency?
Transparency builds trust in democratic systems.
This dashboard improves transparency by:
- Tracking performance against targets
- Maintaining historical records
- Documenting KPI definitions
- Providing structured reporting
Consequently, stakeholders gain confidence in electoral operations.
Best Practices for the Election Commissions KPI Dashboard in Excel
To maximize dashboard effectiveness, follow these best practices.
Define Clear KPIs
Avoid vague indicators. Instead, define measurable KPIs with clear formulas.
Update Data Regularly
Update Actual, Target, and Previous Year sheets monthly. Regular updates maintain accuracy.
Use Standard Units
Maintain consistency in units such as percentage, numbers, days, or currency.
Validate Data Entries
Cross-check data before finalizing reports. Errors can distort trends.
Review Trends Monthly
Use the Trend sheet to analyze performance patterns.
Document Every KPI Clearly
Fill the KPI Definition sheet properly. Clear definitions prevent confusion.
Protect Formula Cells
Lock important cells to prevent accidental changes.
When you follow these practices, you ensure reliable reporting.
How to Use the Election Commissions KPI Dashboard in Excel? (Step-by-Step Guide)
- Open the Excel file.
- Visit the KPI Definition sheet and define all KPIs.
- Enter Target values in the Target sheet.
- Input Previous Year numbers.
- Enter Actual numbers monthly.
- Go to the Dashboard sheet.
- Select a month from D3.
- Review MTD and YTD comparisons.
- Use the Trend sheet for detailed KPI analysis.
Because the structure remains simple, users can operate it easily.
Conclusion
Election management requires precision, accountability, and continuous monitoring. However, manual systems slow down decision-making and create reporting gaps.
The Election Commissions KPI Dashboard in Excel provides a structured, interactive, and transparent solution. It helps authorities track MTD and YTD performance, compare results with targets, and analyze trends across months.
Moreover, it centralizes all KPIs into one professional reporting system. Therefore, leadership can make data-driven decisions with confidence.
If you want to improve electoral monitoring, increase transparency, and simplify performance tracking, this Excel KPI Dashboard becomes the perfect solution.
Frequently Asked Questions with Answers
- What is the purpose of the Election Commissions KPI Dashboard in Excel?
It helps election authorities track operational, financial, and engagement KPIs in one centralized Excel system.
- Can I customize KPIs in this dashboard?
Yes. You can define and modify KPIs in the KPI Definition sheet.
- Does this dashboard support monthly tracking?
Yes. You can select any month from the drop-down in cell D3.
- What does MTD and YTD mean?
MTD means Month-To-Date. YTD means Year-To-Date.
- Can I compare performance with last year?
Yes. The Previous Year sheet allows historical comparison.
- Do I need advanced Excel skills?
No. Basic Excel knowledge helps you operate this dashboard.
- Can small election offices use this dashboard?
Yes. Both small and large election bodies can use it effectively.
Click to buy Election Commissions KPI Dashboard in Excel
Visit our YouTube channel to learn step-by-step video tutorials
Watch the step-by-step video tutorial: