The electronics and semiconductor industry grows fast. Every day, companies handle thousands of data points related to costs, production, energy usage, and revenue. Because the industry moves at high speed, teams cannot rely on manual reports or slow spreadsheets. They need real-time information with clean visuals that help them make decisions instantly.
This is exactly why an Electronics & Semiconductors Dashboard in Power BI becomes a powerful solution. It brings clarity, accuracy, and speed to your reporting. It turns large and complex industry data into meaningful charts, clean insights, and easy comparisons. Whether you work in production, planning, finance, procurement, or R&D, this dashboard helps you understand performance in seconds.
In this detailed article, you will explore what this dashboard is, how it works, its structure, benefits, best practices, examples, and frequently asked questions. The language is simple, the explanations are clear, and the content is written for professionals who want fast and smart insights.
Let’s begin.
Click to Purchases Electronics & Semiconductors Dashboard in Power BI
What Is an Electronics & Semiconductors Dashboard in Power BI?
An Electronics & Semiconductors Dashboard in Power BI is an interactive reporting tool built to analyze key operational and financial metrics across different departments, products, and processes within semiconductor manufacturing and electronics production companies. It provides a real-time view of:
-
Energy cost
-
Material cost
-
Production cost
-
Revenue
-
Profit
-
Total manufacturing cost
-
R&D investment
-
Product performance
-
Monthly trends
Since Power BI supports automation, slicers, and dynamic visuals, you get a dashboard that updates instantly and gives you full control over the data. It simplifies complex manufacturing data and helps you identify patterns, risks, and opportunities that impact output and profit.
Why Do Electronics and Semiconductor Companies Need This Dashboard?
Electronics and semiconductor companies deal with constant changes in:
-
Component availability
-
Pricing
-
Production timelines
-
Energy consumption
-
Material sourcing
-
Process efficiency
-
R&D operations
Without a proper dashboard, teams struggle with:
-
Delayed reports
-
Unclear cost breakdowns
-
Incomplete production visibility
-
Manual errors
-
Limited understanding of trends
-
Difficulty identifying high-cost areas
This dashboard solves all these problems. It gives fast insights into performance and shows the exact areas that need attention. As a result, leaders take smarter decisions and respond quickly to market changes.
Key Features of the Electronics & Semiconductors Dashboard in Power BI
This dashboard includes 5 powerful pages, each offering a unique view of the organization. Below are the detailed explanations.
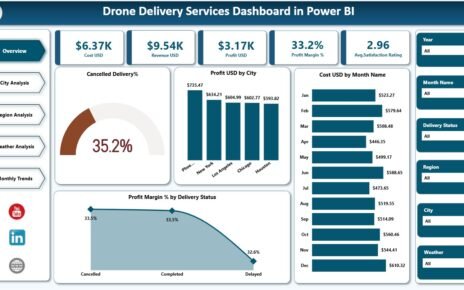
1. Overview Page – What Does the Overview Page Show?

The Overview Page acts as the main screen for top-level insights. You can select filters through slicers for quick comparisons. This page includes:
✔ Five KPI Cards
These cards help you understand major indicators at a glance. They commonly include:
-
Total Energy Cost
-
Completed Product %
-
Total Material Cost
-
Total Revenue
-
Total Cost
✔ Four Interactive Charts
These charts break down critical information:
-
Energy Cost (USD) by Region
Helps you compare energy spending across plants or geographic locations. -
Completed Product %
Shows the completion rate of manufacturing and highlights any delays. -
Material Cost (USD) by Department
Helps identify departments with high material usage. -
Revenue (USD) and Total Cost (USD) by Process Type
Shows how each process contributes to revenue and cost so you can find profitable or high-cost areas.
This page provides a quick snapshot of overall performance, cost behavior, and output.
Click to Purchases Electronics & Semiconductors Dashboard in Power BI
2. Department Analysis – How Do Different Departments Perform?
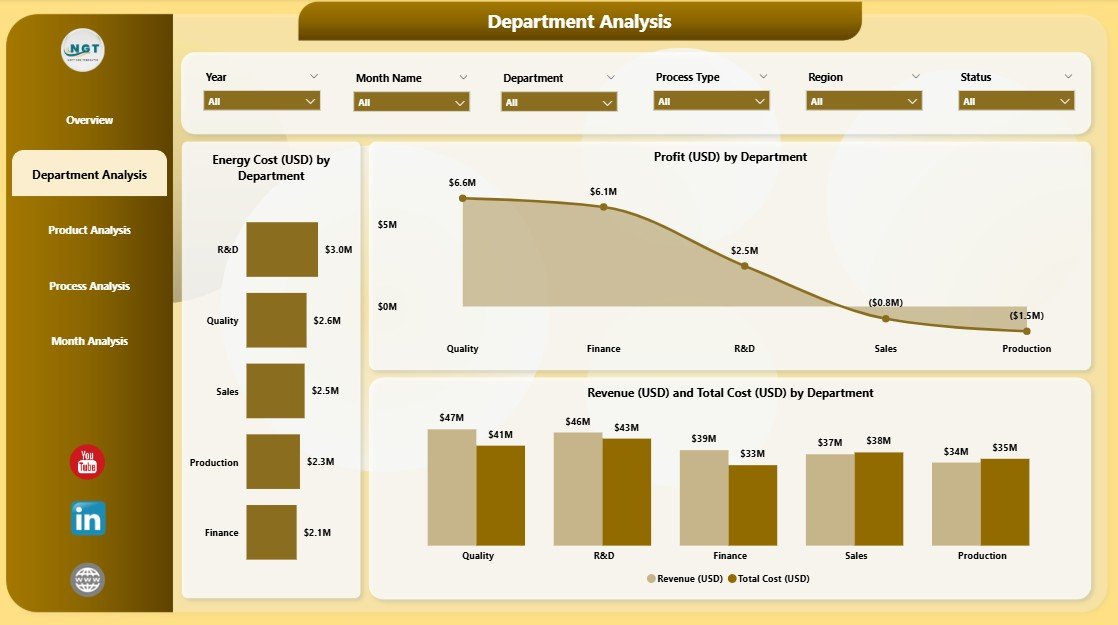
The Department Analysis page focuses on the performance of each internal unit. You can select specific departments through slicers to see clean details.
This page includes three key charts:
-
Energy Cost (USD) by Department
Shows which departments consume more electricity, which is crucial because semiconductor plants require high power usage. -
Profit (USD) by Department
Helps you compare profitability across departments. -
Revenue (USD) and Total Cost (USD) by Department
Shows cost-to-revenue balance and identifies cost-heavy departments.
This page helps leaders plan budgets, reduce cost leakages, and improve operational efficiency.
3. Product Analysis – What Is the Performance of Each Product Type?
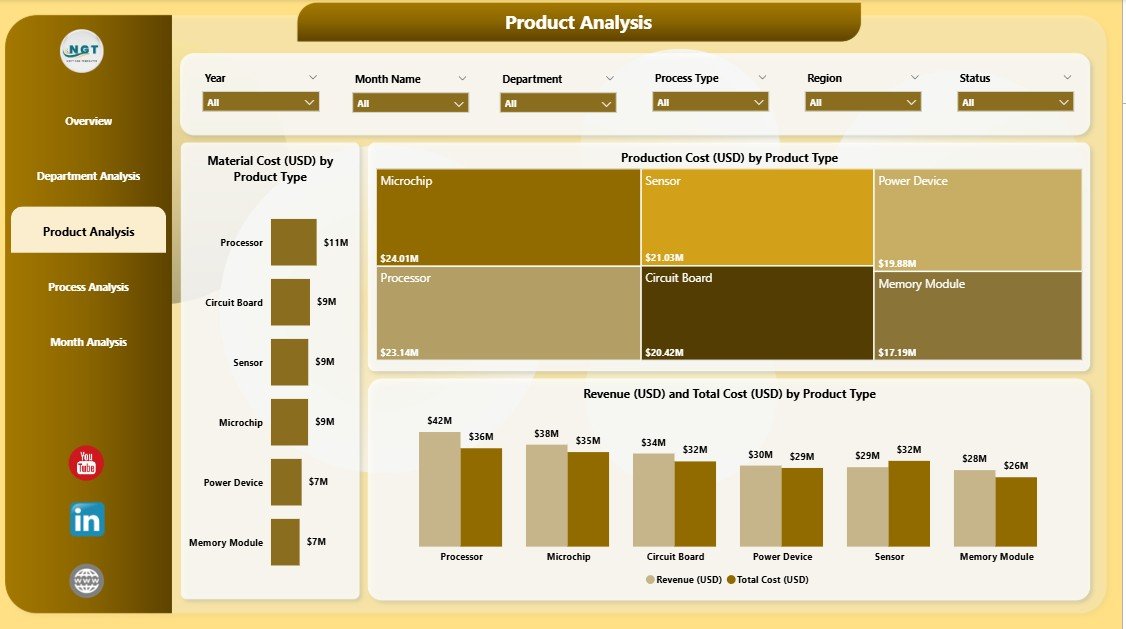
Product types vary in cost, revenue, and production difficulty. This page gives a clear breakdown.
The Product Analysis Page includes three major charts:
-
Material Cost (USD) by Product Type
Displays how much raw material each product requires. -
Production Cost (USD) by Product Type
Helps you find products that cost more to produce. -
Revenue (USD) and Total Cost (USD) by Product Type
Helps you compare which products offer better margins.
This page guides product strategy, pricing decisions, profitability checks, and cost optimization.
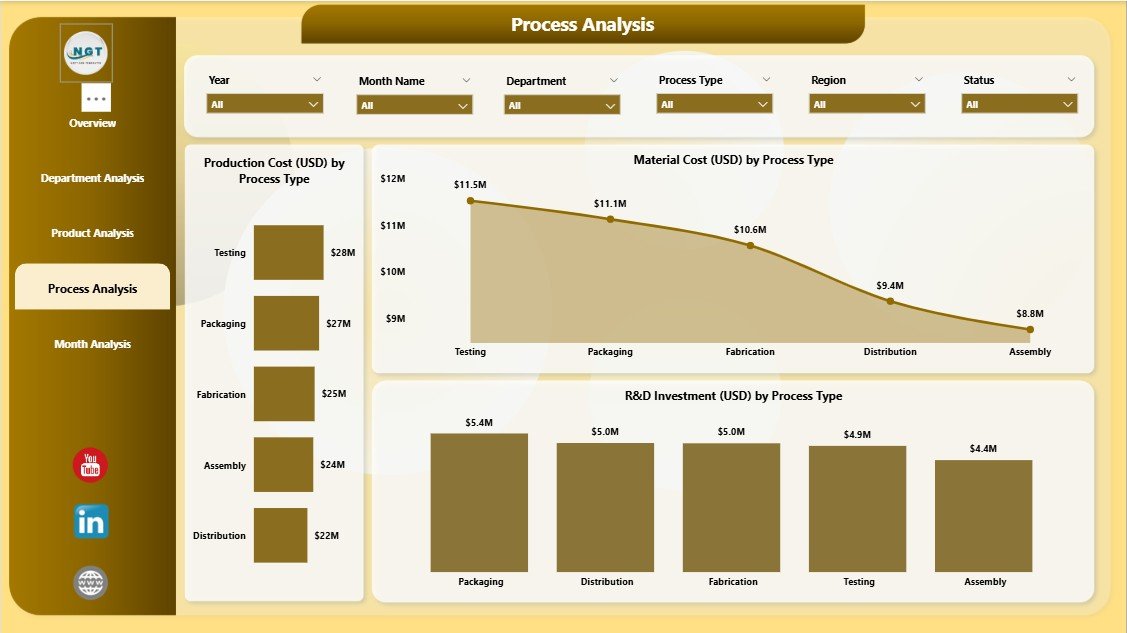
4. Process Analysis – Which Processes Drive Costs and Investments?
Semiconductor production involves multiple complex processes such as:
-
Etching
-
Lithography
-
Assembly
-
Packaging
-
Testing
-
R&D operations
The Process Analysis page helps you understand the performance of each.
This page includes three charts:
-
Material Cost (USD) by Process Type
Shows material usage in every manufacturing process. -
Production Cost (USD) by Process Type
Helps you identify expensive processes. -
R&D Investment (USD) by Process Type
Shows how much you invest in innovation and future development.
This helps teams make smart decisions about resource allocation and process improvement.
5. Monthly Trends – How Do Key Metrics Change Over Time?
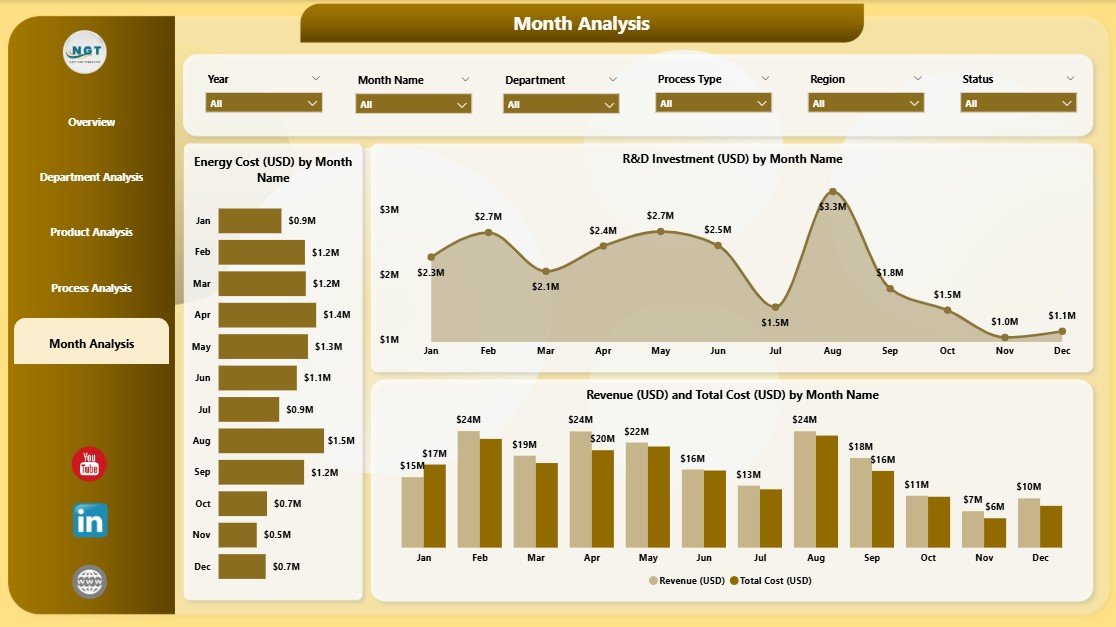
This is the final page of the dashboard and one of the most powerful.
It includes these three trend charts:
-
Energy Cost (USD) by Month
Helps you track energy consumption patterns. -
R&D Investment (USD) by Month
Shows research and innovation spending over time. -
Revenue (USD) and Total Cost (USD) by Month
Helps you compare income and expenses monthly.
Monthly trends help teams plan budgets, track progress, and identify seasonal patterns.
Advantages of an Electronics & Semiconductors Dashboard in Power BI
Below are the major benefits of using this dashboard:
1. Real-Time Insights
The dashboard updates in real time because Power BI connects directly with data sources. This gives teams fast and accurate information.
2. Clear Cost Breakdown
The dashboard divides costs into:
-
Material cost
-
Production cost
-
Energy cost
-
Total cost
This helps identify high-cost areas easily.
3. Strong Production Visibility
Teams can track:
-
Completed product percentage
-
Product performance
-
Process efficiency
-
Department output
This improves planning and scheduling.
4. Better Decision-Making
Since you can compare trends, departments, and product categories, decisions become more strategic.
5. Easy Customization
Power BI allows you to add more KPIs, connect new datasets, or modify visuals based on your needs.
6. Reduces Manual Work
Automation reduces effort, removes human errors, and saves time.
7. Improves Collaboration
Teams across production, finance, and procurement can access the same dashboard and take aligned actions.
Best Practices for Using the Electronics & Semiconductors Dashboard in Power BI
Follow these practices to get the best results:
1. Keep Your Data Clean
Always check:
-
Duplicate entries
-
Incorrect dates
-
Missing cost values
Clean data increases accuracy.
2. Update Your Inputs Regularly
Ensure daily, weekly, or monthly data refresh depending on your operations.
3. Use Slicers for Quick Comparisons
Slicers help you compare:
-
Regions
-
Departments
-
Product types
-
Processes
-
Months
Use them to get deeper insights faster.
4. Add More KPIs Based on Need
You can include KPIs such as:
-
Cycle time
-
Scrap rate
-
Machine downtime
-
Carbon footprint
This improves reporting capability.
5. Monitor High-Cost Areas Closely
Areas like:
-
R&D
-
Energy consumption
-
Raw materials
require frequent monitoring.
6. Review Monthly Trends for Budget Planning
Monthly charts help you plan budgets and control costs.
7. Train Teams on Dashboard Usage
Give basic training so everyone understands how to read and analyze the charts.
Conclusion
An Electronics & Semiconductors Dashboard in Power BI gives companies a clear and complete view of their manufacturing operations, product performance, costs, revenue, and trends. Each page of the dashboard—Overview, Department Analysis, Product Analysis, Process Analysis, and Monthly Trends—offers a valuable perspective. When teams use this dashboard, they take faster decisions, reduce costs, improve efficiency, and increase profitability.
This dashboard is a must-have tool for modern electronics and semiconductor companies that want to stay competitive, maintain quality, and handle complex data with confidence.
Frequently Asked Questions
1. What is an Electronics & Semiconductors Dashboard in Power BI?
It is an interactive reporting tool that shows key metrics such as material cost, energy cost, production cost, revenue, profit, R&D spending, and trends.
2. Who can use this dashboard?
Professionals from production, finance, planning, R&D, procurement, and management use it for decision-making.
3. What are the main pages included in this dashboard?
Click to Purchases Electronics & Semiconductors Dashboard in Power BI
The dashboard includes:
-
Overview
-
Department Analysis
-
Product Analysis
-
Process Analysis
-
Monthly Trends
4. How does this dashboard help in cost analysis?
It breaks down cost into energy cost, material cost, production cost, and total cost and shows them by region, department, product, and process.
5. Can this dashboard be customized?
Yes, Power BI supports full customization. You can add new KPIs, visuals, pages, and data sources.
6. Does this dashboard support real-time data?
Yes, it supports real-time or scheduled refreshes based on your data source.
7. What skills do I need to use this dashboard?
Basic Power BI navigation skills are enough. No advanced technical skills required.
Visit our YouTube channel to learn step-by-step video tutorials