Emergency Medical Services (EMS) play a critical role in saving lives every single day. Ambulance providers, emergency response teams, trauma centers, and healthcare logistics units must respond quickly, manage costs efficiently, and maintain high service quality. However, many EMS organizations still rely on scattered spreadsheets and manual reporting systems.
As a result, managers struggle to monitor incidents, response efficiency, operating costs, and revenue performance in one centralized view.
So, how can emergency medical organizations track operational performance clearly and make faster decisions?
The answer is simple.
Click to Purchases Emergency Medical Services Dashboard in Excel
You need an Emergency Medical Services Dashboard in Excel.
This ready-to-use Excel dashboard helps EMS organizations monitor key performance indicators (KPIs), analyze incident trends, evaluate operational efficiency, and track financial performance in one structured system. Moreover, it converts raw operational data into visual insights that support smarter decision-making.
In this comprehensive guide, you will learn:
-
What an Emergency Medical Services Dashboard in Excel is
-
Why EMS organizations require performance tracking
-
Detailed explanation of all dashboard pages
-
Important KPIs for EMS operations
-
Advantages of using this dashboard
-
Best practices for implementation
-
Frequently asked questions
Let us explore everything step by step.
What Is an Emergency Medical Services Dashboard in Excel?
An Emergency Medical Services Dashboard in Excel is an interactive analytical tool designed to monitor emergency response operations, incident performance, operational costs, and revenue outcomes.
Instead of reviewing multiple reports, decision-makers can view all performance indicators on a single dashboard.
Because the system runs in Microsoft Excel, organizations can easily update data, customize reports, and share insights across teams.
Therefore, EMS managers gain:
-
Real-time performance visibility
-
Structured incident analysis
-
Financial monitoring
-
Operational efficiency tracking
-
Data-driven decision support
Consequently, emergency response teams improve service quality while maintaining financial sustainability.
Why Do Emergency Medical Services Need Performance Tracking?
Emergency services operate in high-pressure environments. Every delay or inefficiency directly impacts patient outcomes and operational costs.
Without structured monitoring:
-
Incident trends remain unclear
-
Cost overruns increase unnoticed
-
Resource allocation becomes inefficient
-
Revenue tracking becomes inconsistent
-
Performance comparisons become difficult
However, when organizations implement a dashboard, they transform raw data into actionable insights.
Key Benefits of EMS Performance Tracking
-
Monitor incident distribution across zones and cities
-
Evaluate profitability and operating efficiency
-
Identify high-cost incident types
-
Track revenue generation patterns
-
Improve emergency response planning
As a result, leadership teams make faster and more confident decisions.
Key Features of Emergency Medical Services Dashboard in Excel
This dashboard includes a Page Navigator located on the left side, allowing users to move smoothly between analytical pages.
The Excel application contains five interactive dashboard pages, each designed for a specific analytical purpose.
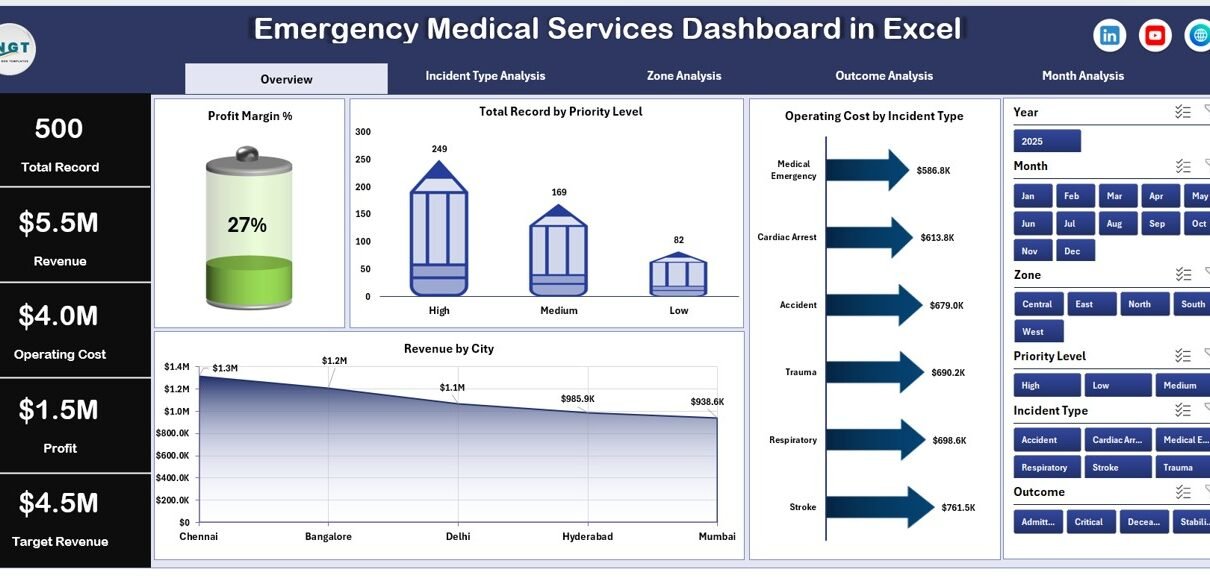
1. Overview Page – Central Command View
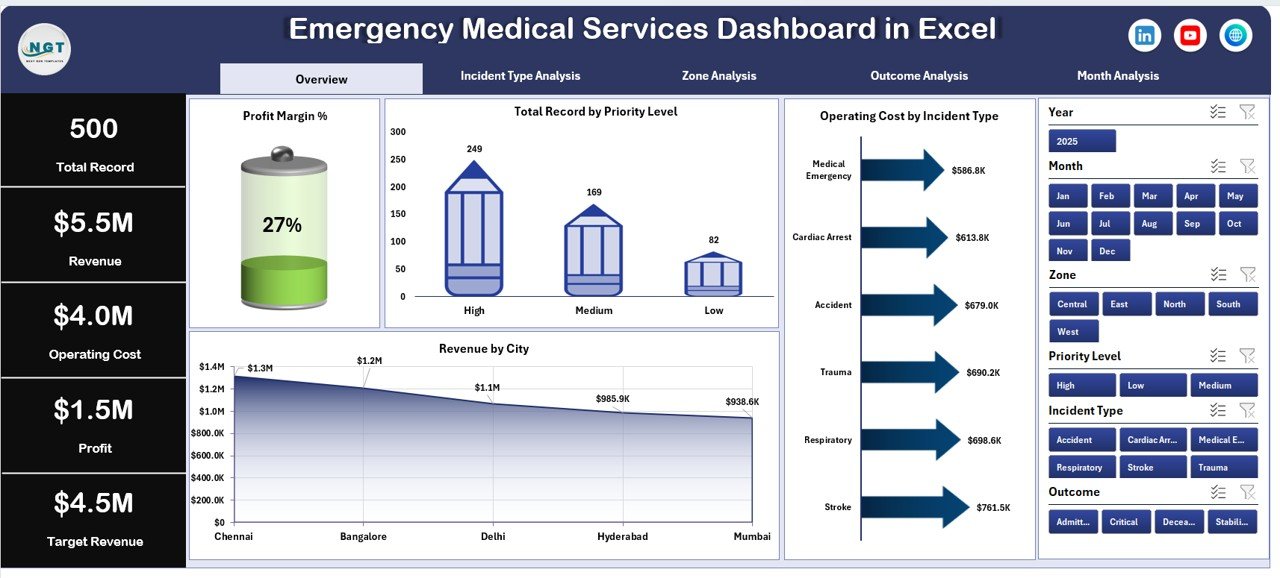
The Overview Page works as the main control center of the dashboard.
Here, users can instantly understand overall EMS performance.
What You See on the Overview Page
✅ Right-side slicer for filtering data
✅ Four KPI summary cards
✅ Four analytical charts
Charts Included
-
Profit Margin %
-
Total Records by Priority Level
-
Operating Cost by Incident Type
-
Revenue by City
Why This Page Matters
First, it provides a high-level snapshot of operational health.
Next, it highlights performance gaps immediately.
Finally, it enables executives to review overall performance without navigating multiple reports.
Therefore, decision-makers quickly identify areas requiring attention.
Click to Purchases Emergency Medical Services Dashboard in Excel
2. Incident Type Analysis – Understanding Emergency Categories
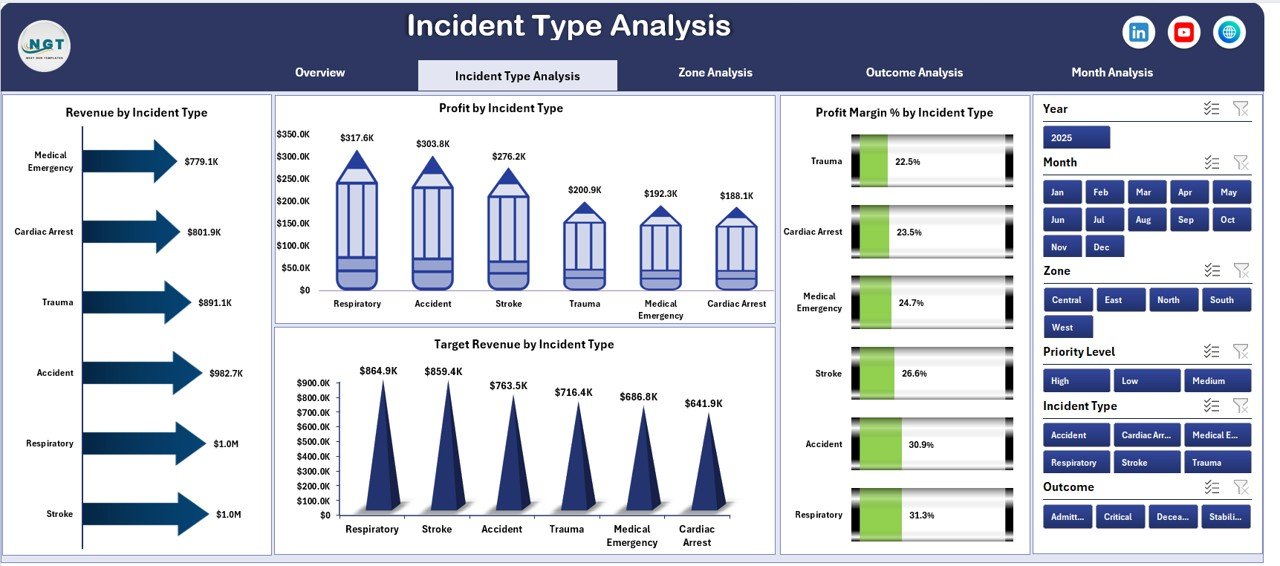
Different incident types generate different costs and revenue patterns. Therefore, EMS organizations must analyze each category separately.
The Incident Type Analysis page focuses on operational performance by incident classification.
Dashboard Elements
-
Right-side slicer for dynamic filtering
-
Four analytical charts
Charts Available
-
Profit Margin % by Incident Type
-
Revenue by Incident Type
-
Profit by Incident Type
-
Target Revenue by Incident Type
Insights You Can Gain
-
Which incident types generate maximum revenue
-
Which emergencies incur higher operating costs
-
Profitability comparison across services
-
Target achievement analysis
Consequently, management can optimize resource allocation.
3. Zone Analysis – Geographic Performance Monitoring
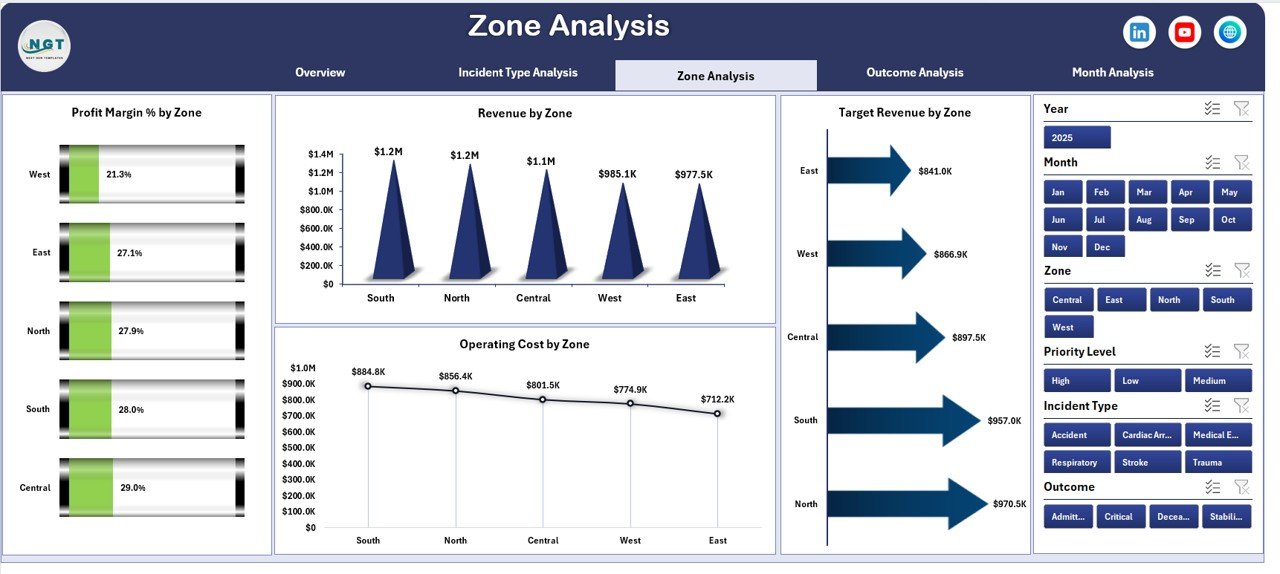
EMS performance varies significantly across geographic zones. Population density, traffic conditions, and emergency frequency influence results.
The Zone Analysis page evaluates regional performance.
Charts Included
-
Profit Margin % by Zone
-
Revenue by Zone
-
Operating Cost by Zone
-
Target Revenue by Zone
Why Zone Analysis Is Important
-
Identify high-demand zones
-
Optimize ambulance deployment
-
Control regional operating expenses
-
Improve service coverage
As a result, organizations enhance operational efficiency while maintaining response readiness.
4. Outcome Analysis – Measuring Service Effectiveness
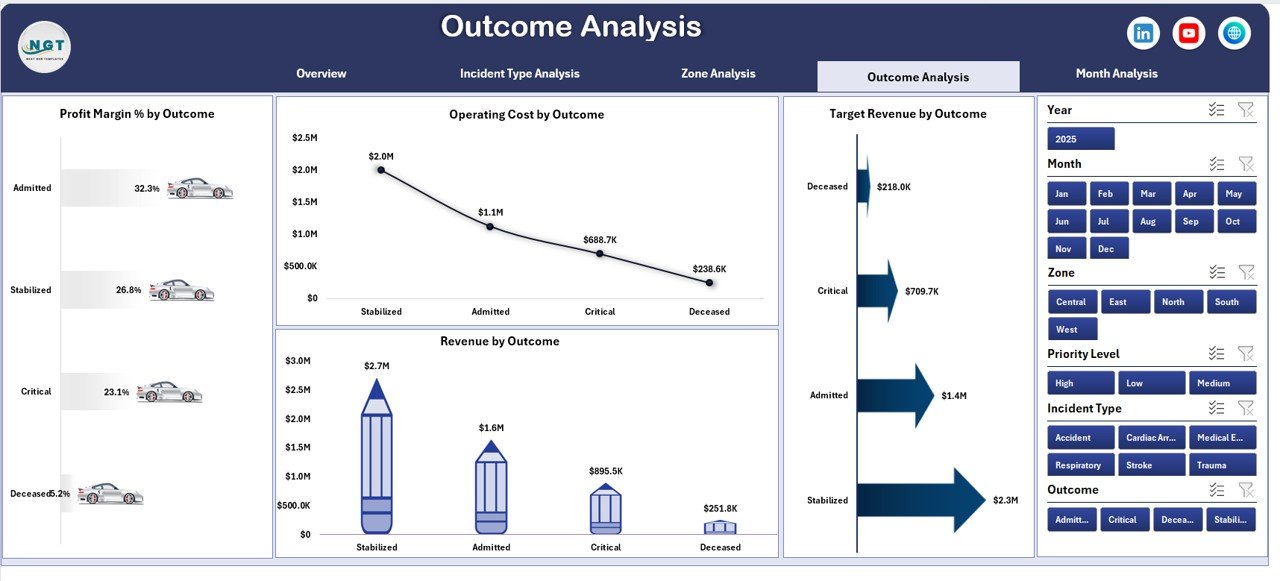
Outcome analysis helps EMS leaders evaluate service results and operational quality.
This page connects financial performance with service outcomes.
Charts Available
-
Profit Margin % by Outcome
-
Revenue by Outcome
-
Operating Cost by Outcome
-
Target Revenue by Outcome
Key Questions Answered
-
Which outcomes produce better profitability?
-
How do treatment results affect costs?
-
Are targets achieved across outcomes?
Therefore, managers understand both clinical and financial impact simultaneously.
5. Month Analysis – Trend and Performance Tracking
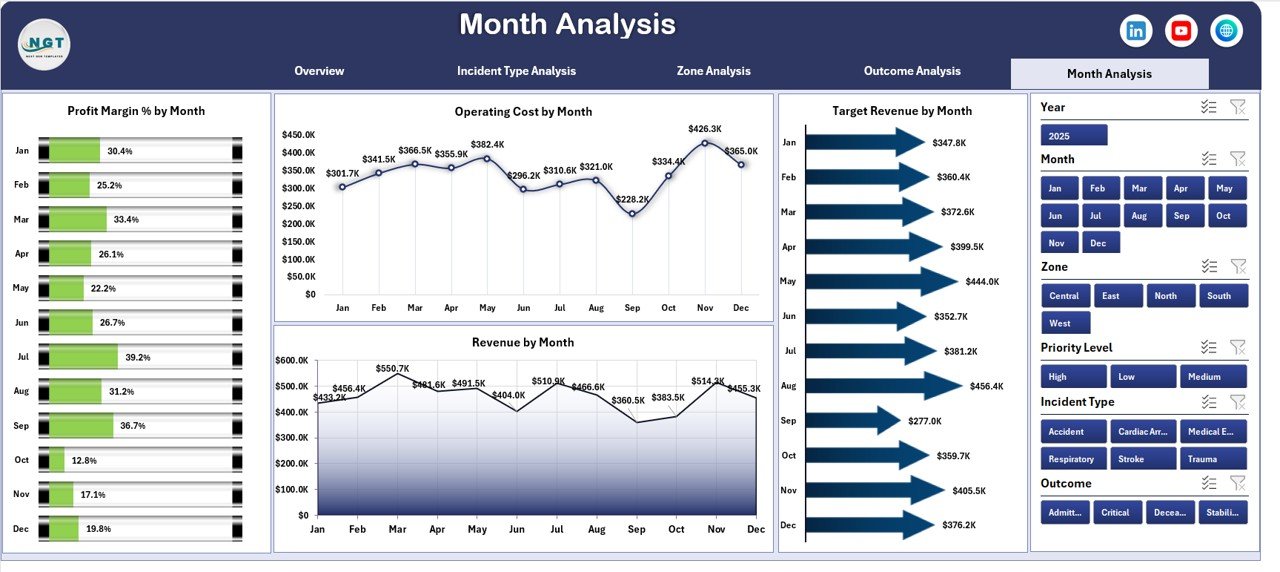
Monthly analysis allows organizations to monitor performance over time.
The Month Analysis page focuses on trends and seasonal patterns.
Charts Included
-
Profit Margin % by Month
-
Operating Cost by Month
-
Target Revenue by Month
-
Revenue by Month
Why Monthly Analysis Matters
-
Identify seasonal emergency trends
-
Forecast future demand
-
Track performance consistency
-
Support budget planning
Consequently, leadership teams prepare proactive strategies instead of reactive responses.
Support Sheet – The Calculation Engine
The Support Sheet performs backend calculations required for dashboard visuals.
It helps in:
-
Data aggregation
-
KPI calculations
-
Chart preparation
-
Structured data modeling
Although users rarely interact with it directly, this sheet ensures accurate analytics.
Data Sheet – The Data Entry Foundation
Click to Purchases Emergency Medical Services Dashboard in Excel
The Data Sheet acts as the primary data source.
Users enter operational information such as:
-
Incident details
-
Zone information
-
Revenue data
-
Operating costs
-
Outcome categories
-
Monthly performance values
Once data updates occur, the dashboard refreshes automatically.
Therefore, reporting becomes fast and efficient.
Important KPIs Tracked in Emergency Medical Services Dashboard
A strong EMS dashboard tracks both operational and financial indicators.
Operational KPIs
-
Total Incidents Handled
-
Priority Level Distribution
-
Incident Type Volume
-
Zone Performance
-
Outcome Success Rate
Financial KPIs
-
Revenue Generated
-
Operating Cost
-
Profit Margin %
-
Target Revenue Achievement
-
Monthly Revenue Growth
Together, these KPIs provide a complete performance picture.
How Does This Dashboard Improve EMS Decision-Making?
A dashboard does more than display charts. It enables strategic action.
Decision Improvements
-
Faster incident analysis
-
Better resource allocation
-
Improved financial control
-
Accurate performance evaluation
-
Data-based planning
Moreover, leadership teams reduce dependency on manual reports.
Advantages of Emergency Medical Services Dashboard in Excel
1. Centralized Performance Monitoring
All EMS data appears in one structured interface. Therefore, users avoid switching between files.
2. Easy Data Entry
Excel allows simple updates without technical expertise.
3. Real-Time Insights
Once data updates occur, visuals refresh instantly.
4. Better Financial Visibility
Managers track revenue, costs, and profitability simultaneously.
5. Improved Operational Planning
Incident and zone analysis supports smarter deployment decisions.
6. Interactive Filtering
Slicers allow instant analysis across categories.
7. Cost-Effective Solution
Organizations avoid expensive software investments.
Who Can Benefit from This Dashboard?
This dashboard supports multiple EMS stakeholders:
-
Ambulance Service Providers
-
Emergency Response Organizations
-
Hospital Emergency Departments
-
Medical Transport Companies
-
Healthcare Operations Managers
-
Public Safety Agencies
Therefore, any emergency healthcare organization can use this solution.
Best Practices for the Emergency Medical Services Dashboard in Excel
To achieve maximum value, organizations should follow proven implementation practices.
✅ Maintain Accurate Data Entry
Always update incident and financial records regularly.
✅ Standardize KPI Definitions
Ensure teams understand KPI calculations clearly.
✅ Review Dashboard Weekly
Frequent reviews improve responsiveness.
✅ Use Filters for Deep Analysis
Analyze zones, incidents, and outcomes individually.
✅ Monitor Profit Margin Trends
Profitability tracking ensures sustainability.
✅ Train Team Members
Provide basic Excel dashboard training.
✅ Backup Data Regularly
Protect operational information consistently.
How to Implement the Dashboard Successfully?
Click to Purchases Emergency Medical Services Dashboard in Excel
Follow these steps:
-
Prepare EMS operational data.
-
Enter records into the Data Sheet.
-
Validate categories and zones.
-
Refresh dashboard visuals.
-
Analyze insights regularly.
-
Adjust operational strategies.
Because implementation remains simple, organizations start using insights quickly.
Future Scope of EMS Analytics Using Excel Dashboards
As EMS systems evolve, dashboards will become even more powerful.
Future enhancements may include:
-
Automated data integration
-
Response time analytics
-
Predictive incident forecasting
-
Resource optimization models
-
AI-based performance insights
Therefore, dashboards form the foundation for advanced healthcare analytics.
Conclusion
Emergency Medical Services operate in environments where efficiency and accuracy matter most. However, manual reporting slows decision-making and hides performance insights.
The Emergency Medical Services Dashboard in Excel solves this challenge by combining operational analytics, financial tracking, and performance monitoring into one interactive platform.
Because it provides structured insights, organizations improve response planning, control costs, and enhance service quality.
Ultimately, this dashboard empowers EMS leaders to make smarter, faster, and more confident decisions — which directly supports better emergency care delivery.
Frequently Asked Questions (FAQs)
1. What is an Emergency Medical Services Dashboard in Excel?
It is an interactive Excel tool that tracks EMS incidents, costs, revenue, and performance KPIs in one centralized dashboard.
2. Who should use this dashboard?
Ambulance services, hospitals, emergency response teams, and healthcare operations managers can use it.
3. Do I need advanced Excel skills?
No. Basic Excel knowledge allows users to operate and update the dashboard easily.
4. Can I customize the dashboard?
Yes. Users can modify KPIs, charts, and categories according to organizational needs.
5. How often should data be updated?
Organizations should update data daily or weekly for accurate insights.
6. Does the dashboard support monthly analysis?
Yes. The Month Analysis page tracks performance trends across months.
7. Can this dashboard improve operational efficiency?
Yes. It helps identify cost drivers, performance gaps, and improvement opportunities.
Visit our YouTube channel to learn step-by-step video tutorials