Every organization, regardless of its size, faces the challenge of managing employee leave effectively. Without proper tracking, leave requests can quickly become confusing, budgets may go off-track, and workforce planning suffers. An Employee Leave Dashboard in Excel offers a simple yet powerful solution. It provides HR managers, team leaders, and executives with a clear, data-driven view of leave trends, costs, and approvals.
In this article, we will explore how the Employee Leave Dashboard in Excel works, its key features, advantages, and best practices. We will also share practical insights that will help you improve your leave management system.
Click to Purchases Employee Leave Dashboard in Excel
What is an Employee Leave Dashboard in Excel?
An Employee Leave Dashboard in Excel is a ready-to-use tool that tracks employee leave data, approval status, costs, and trends. Unlike manual tracking in scattered spreadsheets or emails, this dashboard consolidates everything in one central location.
It uses charts, slicers, and tables to present insights. Managers can analyze leave requests by department, leave type, reasons, costs, and time trends. Since it is built in Excel, it remains easy to use, customizable, and accessible without requiring complex software.
Key Features of the Employee Leave Dashboard
The dashboard has five analytical pages plus supporting sheets that make leave tracking smooth and effective. Let’s explore them in detail:
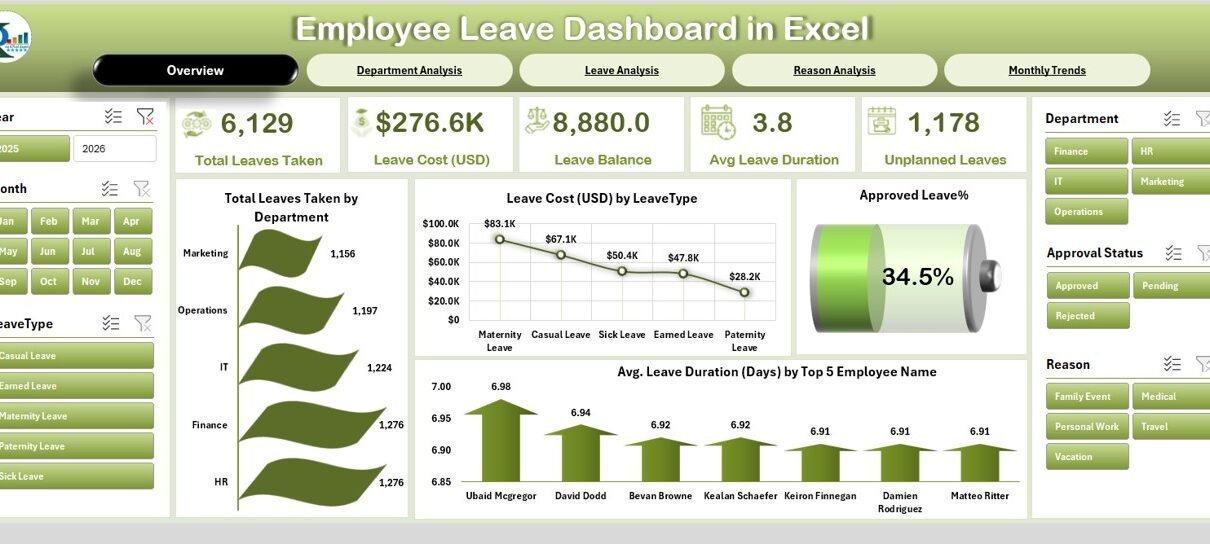
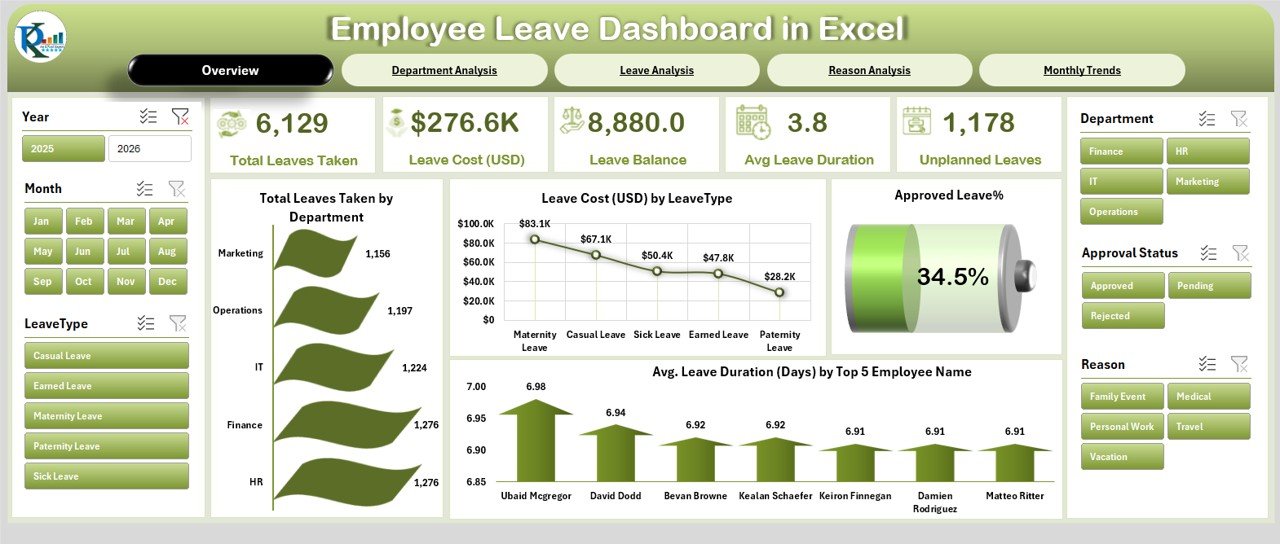
Overview Page
-
Acts as the main control page of the dashboard.
Includes five key cards displaying important KPIs such as:
- Total Leaves Taken
- Total Leave Cost (USD)
- Approved Leave %
- Average Leave Duration (Days) by employee
- Top 5 Employees with longest leave durations
Four charts provide high-level insights:
- Total Leaves Taken by Department
- Leave Cost (USD) by Leave Type
- Approved Leave %
- Average Leave Duration by Top Employees
This page helps HR managers quickly understand leave patterns across the company.
Department Analysis Page
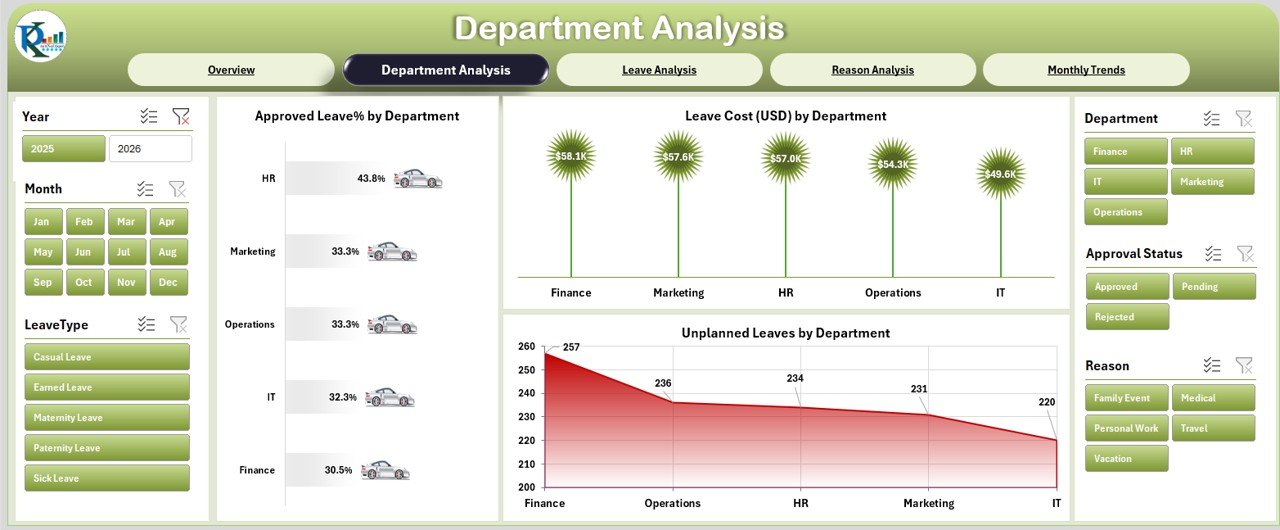
-
Focuses on department-level leave insights.
Displays three key charts:
- Approved Leave % by Department
- Leave Cost (USD) by Department
- Unplanned Leaves by Department
This allows managers to compare how different departments handle leave approvals and control costs.
Leave Analysis Page
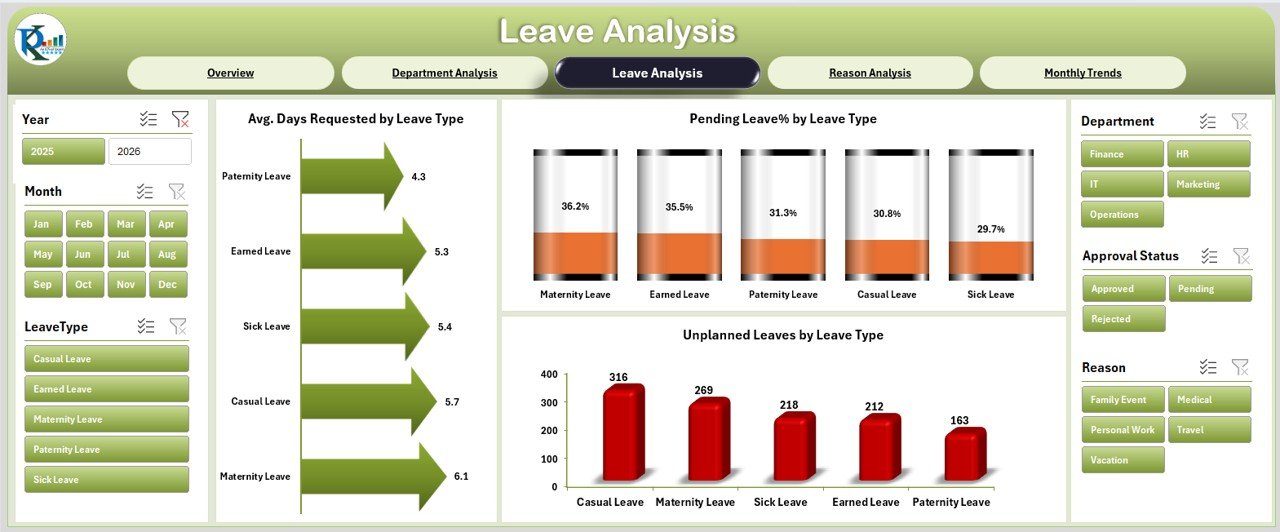
-
Provides a detailed breakdown of leave requests.
Three charts highlight:
- Average Days Requested by Leave Type
- Pending Leave % by Leave Type
- Unplanned Leaves by Leave Type
This ensures HR understands which types of leaves (sick leave, vacation, emergency) dominate requests.
Click to Purchases Employee Leave Dashboard in Excel
Reason Analysis Page
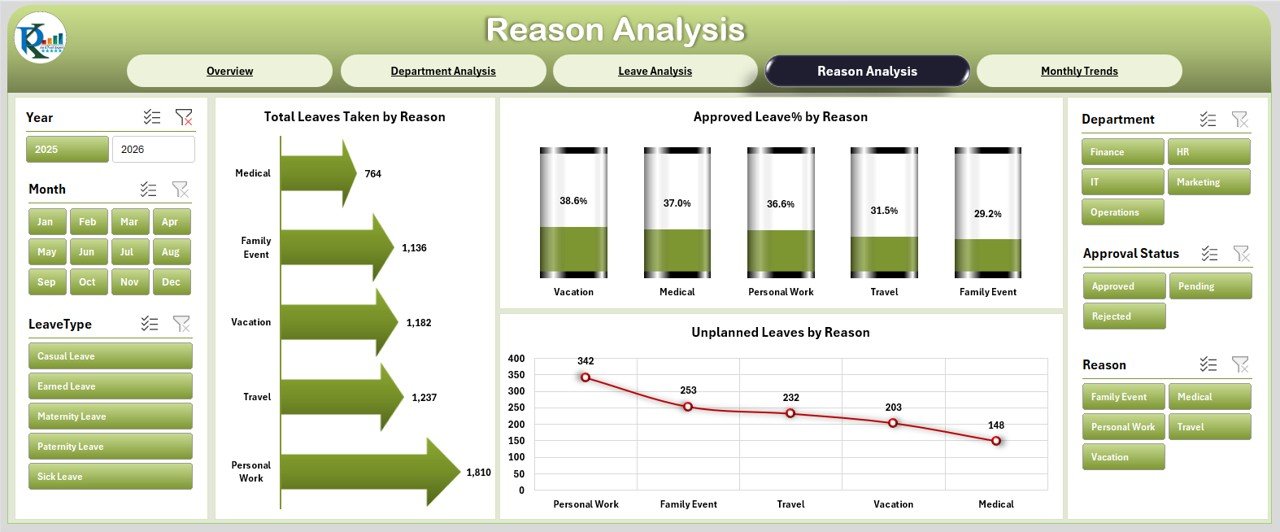
-
Examines the reasons behind leave requests.
Displays three charts:
- Total Leaves Taken by Reason
- Approval % by Reason
- Unplanned Leaves by Reason
This helps identify the most common causes of absenteeism and whether certain reasons have higher rejection rates.
Monthly Trends Page
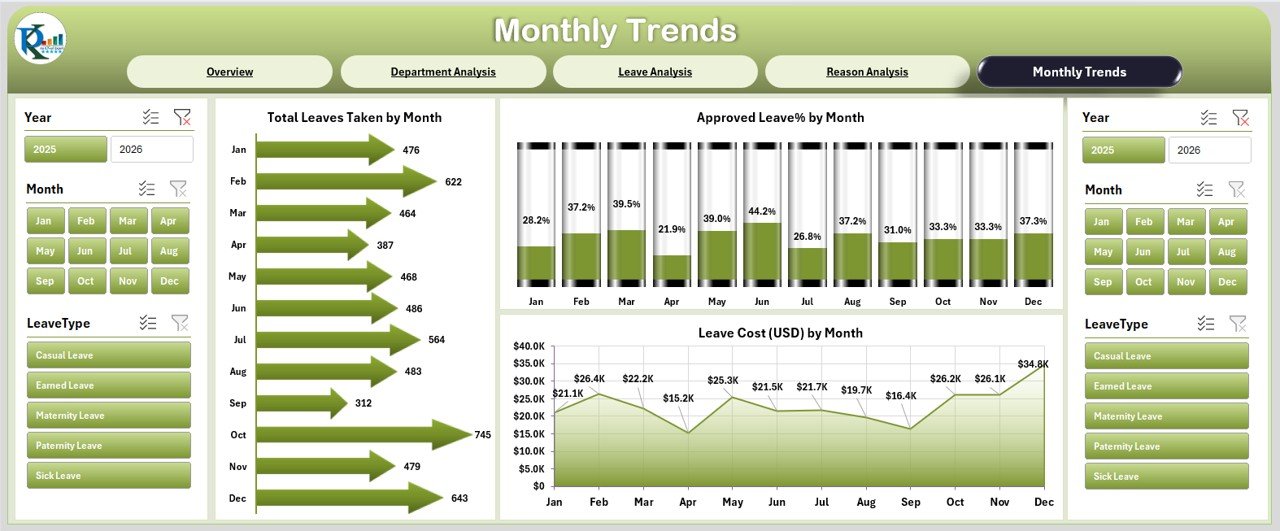
-
Tracks leave patterns over time.
Charts include:
- Total Leaves Taken by Month
- Approval % by Month
- Unplanned Leaves by Month
Monthly trend analysis ensures managers can prepare for seasonal absences and plan workforce distribution better.
Data Sheet
-
The central data entry sheet.
-
Records employee ID, name, department, leave type, reason, duration, approval status, and cost.
-
Acts as the backbone of the dashboard.
Support Sheet
-
Stores lists and references such as employee names, departments, leave types, and approvers.
-
Enables drop-down menus and filters in the data sheet for clean input.
Why Use Excel for Leave Dashboard Instead of Software?
While there are many HR software solutions, Excel offers some unique advantages:
-
Cost-effective – No extra licenses needed.
-
Customizable – Easily adjusted for company policies.
-
Accessible – Works on almost all computers.
-
Familiar – Employees already know Excel.
-
Flexible – Can integrate with existing reports.
For small and medium-sized businesses, an Excel-based dashboard provides a perfect balance of functionality and affordability.
Advantages of Employee Leave Dashboard in Excel
Using this dashboard brings several benefits to organizations:
✅ Better Workforce Planning – Know who is available and when.
✅ Reduced Manual Errors – Automated charts reduce mistakes from manual tracking.
✅ Cost Tracking – Keep track of leave-related expenses in real time.
✅ Transparency – Everyone understands how leave policies are applied.
✅ Data-Driven Decisions – Managers can approve or decline requests using factual insights.
✅ Employee Satisfaction – Employees appreciate fair and transparent leave tracking.
✅ Improved Compliance – Helps organizations follow labor laws and internal leave policies.
Opportunities for Improvement in Leave Management
Even with a strong dashboard, organizations can improve in the following areas:
📌 Automating Approvals – Adding simple VBA macros can automate email notifications.
📌 Integration with Payroll – Linking leave data with payroll ensures accurate salary calculations.
📌 Mobile Access – Publishing Excel dashboards on SharePoint or Power BI improves accessibility.
📌 Predictive Analytics – Using past trends to forecast future leave demand.
📌 Employee Self-Service – Allowing employees to submit leave requests directly into the system.
Best Practices for Using an Employee Leave Dashboard
To maximize value, follow these best practices:
🔹 Keep Data Updated – Ensure HR updates the data sheet regularly.
🔹 Use Clear Naming Conventions – Standardize department and leave type names.
🔹 Leverage Filters and Slicers – Use them for quick drill-down analysis.
🔹 Monitor Trends Monthly – Compare monthly leave patterns to spot unusual spikes.
🔹 Link with HR Policies – Ensure the dashboard reflects actual company leave rules.
🔹 Train HR Staff – Provide training sessions so staff can use the dashboard effectively.
🔹 Back Up Data – Regular backups prevent accidental data loss.
How to Create an Employee Leave Dashboard in Excel (Step by Step)
If you want to build your own dashboard, here’s a simplified guide:
Prepare Your Data Sheet
- Include columns like Employee ID, Department, Leave Type, Duration, Reason, Cost, and Approval Status.
Create Pivot Tables
- Build pivot tables for leave by department, reason, type, and month.
Insert Charts
Use bar charts, pie charts, and line charts to visualize insights.
Add Slicers
- Insert slicers for department, month, or leave type for interactive filtering.
Design the Dashboard Layout
- Use cards for KPIs and arrange charts in sections.
Create Support Sheet
- Add employee names, departments, and leave types for dropdowns.
Polish and Automate
- Use conditional formatting, formulas, and macros for automation.
Real-Life Use Cases of Employee Leave Dashboard
-
Small Business – Tracks vacation requests of fewer than 50 employees.
-
Mid-Sized Organization – Analyzes department-level leave costs to manage budgets.
-
Large Enterprise – Integrates with payroll and HR systems for advanced workforce planning.
-
Project-Based Teams – Ensures critical employees are available during project deadlines.
Conclusion
Managing employee leave is not just about approving requests—it is about maintaining productivity, fairness, and compliance. The Employee Leave Dashboard in Excel provides a practical, affordable, and customizable solution for organizations of all sizes. By using it effectively, HR departments can make better decisions, reduce conflicts, and ensure smooth business operations.
Frequently Asked Questions (FAQs)
1. What is the purpose of an Employee Leave Dashboard in Excel?
It helps organizations track leave requests, approvals, costs, and patterns in a visual and structured way.
2. Who can use this dashboard?
HR managers, team leaders, and company executives can all use it to manage workforce planning and leave approval.
3. Can the dashboard calculate leave costs automatically?
Yes. If leave costs are entered in the data sheet, the dashboard can summarize total leave expenses by employee, type, or department.
4. Is Excel better than HR software for leave tracking?
For small and medium businesses, Excel is cost-effective and flexible. Larger organizations may integrate Excel dashboards with HR software for more advanced features.
5. Can I customize the dashboard?
Yes. Since it is Excel-based, you can easily add new charts, change KPIs, or expand the data fields as per your organization’s policies.
6. Does the dashboard support unplanned leave analysis?
Yes. It highlights unplanned leaves by department, reason, and type to identify patterns and reduce productivity disruptions.
7. How often should the data be updated?
Ideally, the HR team should update the data sheet daily or weekly to ensure accurate insights.
Visit our YouTube channel to learn step-by-step video tutorials