Measuring and improving employee performance has become a top priority for organizations across industries. Companies want to make sure that every team member contributes effectively to projects, meets deadlines, and develops new skills. However, tracking performance using manual reports often leads to errors, delays, and missed opportunities.
This is where an Employee Performance Tracking Dashboard in Power BI makes a real difference. By combining data visualization, interactive reports, and real-time analysis, it allows managers and HR leaders to monitor employee performance more efficiently. In this article, we will explore everything you need to know about this dashboard—its structure, benefits, best practices, and real-world applications.
Click to Purchases Employee Performance Tracking Dashboard in Power BI
What Is an Employee Performance Tracking Dashboard in Power BI?
An Employee Performance Tracking Dashboard in Power BI is a digital tool that consolidates performance-related data from multiple sources (such as Excel files, HR systems, or project management tools) and displays it in an interactive format.
Instead of reading lengthy spreadsheets, managers can quickly see performance scores, project completions, ratings, and training hours through visual charts and cards. This helps in identifying top performers, employees needing support, and overall workforce trends.
Key Features of the Employee Performance Tracking Dashboard
This dashboard comes with five main pages, each designed to provide a specific view of employee performance.
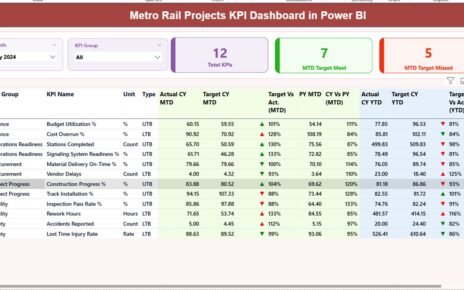
Overview Page
The overview acts as the main dashboard for managers.
-
5 Key Performance Cards – Instant insight into performance indicators.
4 Interactive Charts – These include:
- Promotion Not Eligible %
- Good + Excellent Performance %
- Performance Score by Department
- Projects Completed by Month
This high-level view helps leaders understand the overall performance health of the organization.
Department Analysis Page
This page helps in analyzing how different departments are performing.
Click to Purchases Employee Performance Tracking Dashboard in Power BI
Charts included:
- Total Good + Excellent Performance % by Department
- Projects Completed by Department
- Training Hours by Department
By reviewing this, managers can identify departments that perform well and those that need additional support or training.
Job Role Analysis Page
This page focuses on how employees perform based on their specific job roles.
Charts included:
- Good + Excellent Performance % by Job Role
- Projects Completed by Job Role (appears twice for comparative review)
This helps in understanding whether certain roles consistently perform better and which roles may require more training or resources.
Rating Analysis Page
Here, HR teams and managers can explore employee ratings in detail.
Charts included:
- Projects Completed by Employee Name
- Total Employees by Rating
- Performance Score by Job Role
This section helps in linking employee ratings with project performance, giving a deeper insight into individual contributions.
Monthly Trends Page
The final page highlights performance patterns over time.
Charts included:
- Performance Score by Month
- Promotion Not Eligible Count by Month
- Average + Below Average Performance by Month
This page is very useful for tracking seasonal trends and comparing monthly results.
Advantages of Employee Performance Tracking Dashboard in Power BI
Using this dashboard provides multiple benefits:
📊 Real-time Monitoring – Managers can track performance as soon as data updates.
📈 Clear Insights – Charts and cards make complex data easy to understand.
👥 Employee Comparisons – Performance can be compared across departments and roles.
⏳ Time Savings – Automated dashboards eliminate the need for manual reporting.
🎯 Improved Decision-Making – Helps leaders identify training needs, promotions, or performance issues.
🔄 Trend Analysis – Monthly data allows organizations to see progress or decline over time.
Opportunities for Improvement
Although this dashboard is powerful, organizations can make improvements:
🔧 Integration with HR Systems – Direct integration with HR tools can automate updates.
🌐 Cloud Accessibility – Publishing the dashboard online ensures access from anywhere.
📱 Mobile Optimization – Optimizing for mobile devices helps managers track performance on the go.
🧑🏫 Employee Self-Service – Giving employees limited access lets them review their own performance.
📌 Custom Metrics – Adding KPIs like “Customer Feedback Score” or “Innovation Index” makes the dashboard more relevant to different industries.
Best Practices for Using the Dashboard
Click to Purchases Employee Performance Tracking Dashboard in Power BI
To get the most out of the Employee Performance Tracking Dashboard in Power BI, follow these best practices:
✅ Update Data Regularly – Keep data refreshed for accurate insights.
✅ Set Clear KPIs – Define performance metrics that align with business goals.
✅ Use Drill-Down Features – Allow managers to move from summary to detail quickly.
✅ Ensure Data Accuracy – Clean and validate data before importing.
✅ Encourage Transparency – Share relevant insights with employees to build trust.
✅ Train Managers – Provide training so managers know how to use filters and slicers effectively.
Real-World Applications
This dashboard can be applied in many ways:
-
HR Departments – Monitor employee ratings, promotions, and training hours.
-
Project Managers – Track project completion rates by employee or role.
-
Executives – Gain a big-picture view of workforce performance trends.
-
Learning & Development Teams – Identify departments or roles needing training.
-
Employee Engagement Programs – Use performance data to improve recognition and reward systems.
Conclusion
The Employee Performance Tracking Dashboard in Power BI is not just a reporting tool; it is a decision-making assistant for managers and HR leaders. By offering an interactive, visual, and real-time view of employee performance, it simplifies complex evaluations and supports data-driven management.
When organizations use this dashboard consistently, they improve transparency, enhance productivity, and create a fairer evaluation system for employees.
Frequently Asked Questions (FAQ)
1. What is the main purpose of an Employee Performance Tracking Dashboard?
It helps organizations monitor employee performance, identify top performers, and detect areas where employees need support or training.
2. Can this dashboard integrate with HR management systems?
Yes, Power BI supports integration with HR systems, Excel, databases, and other tools for automated data updates.
3. How often should I update the data in this dashboard?
Ideally, you should update data daily or weekly to ensure managers have the most accurate information.
4. Can employees access their own performance data?
Yes, limited self-service access can be given so employees can track their progress without compromising sensitive information.
5. What industries benefit most from this dashboard?
Almost all industries benefit—IT, healthcare, retail, education, finance, and manufacturing. Wherever performance needs tracking, this dashboard proves useful.
6. Is Power BI suitable for small businesses too?
Absolutely. Power BI is scalable and cost-effective, making it a good fit for both small businesses and large enterprises.
Visit our YouTube channel to learn step-by-step video tutorials