Energy trading is one of the most dynamic and data-driven industries in the world. From monitoring real-time energy prices to analyzing supply-demand imbalances, every decision in energy trading relies on accurate insights. To help businesses make faster and smarter decisions, the Energy Trading KPI Dashboard in Power BI provides a unified view of all key metrics that matter — performance, efficiency, and profitability.
This dashboard offers a visual, interactive, and data-driven environment for energy traders, analysts, and managers to track performance indicators with precision. Built entirely in Microsoft Power BI and powered by Excel data, it gives users the flexibility to manage KPIs without requiring complex databases or coding skills.
Click to Purchases Energy Trading KPI Dashboard in Power BI
What Is the Energy Trading KPI Dashboard in Power BI?
The Energy Trading KPI Dashboard in Power BI is a ready-to-use analytics solution designed to measure and visualize the performance of energy trading operations. It consolidates multiple data points — including targets, actuals, and trends — into a single, interactive interface.
Whether you are tracking electricity, gas, oil, or renewable energy trades, this dashboard helps you monitor performance from both monthly and yearly perspectives. The integration between Excel and Power BI ensures that your data remains dynamic, accurate, and easy to update.
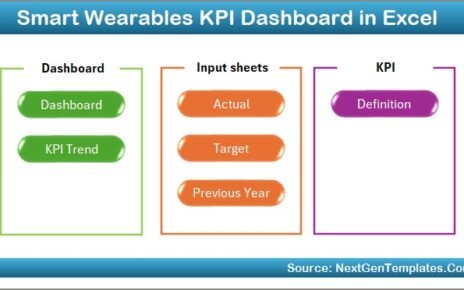
It includes three pages inside the Power BI desktop file, each focusing on a specific aspect of performance:
-
Summary Page – overall performance overview
-
KPI Trend Page – trend and comparison view
-
KPI Definition Page – detailed KPI documentation
Let’s explore each of these in detail.
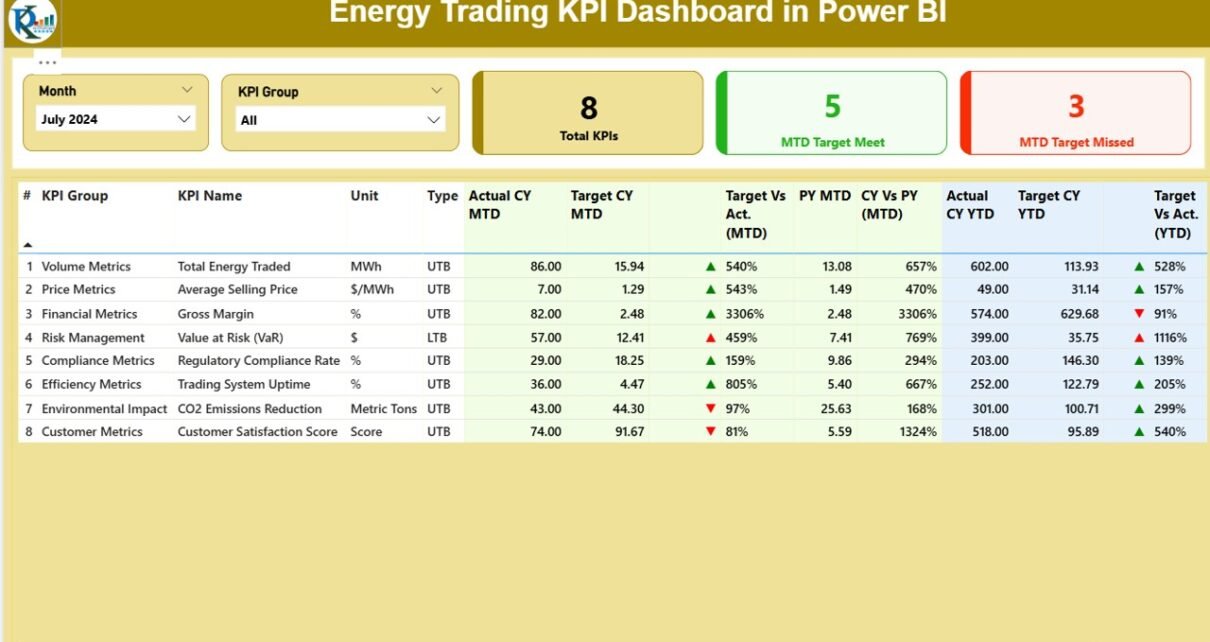
Summary Page – The Performance Overview

The Summary Page is the main hub of the dashboard. It provides a snapshot of the overall energy trading performance, making it perfect for executives and analysts who need quick insights.
Key Features:
-
Month and KPI Group slicers at the top allow users to filter results dynamically.
Three key cards display:
- Total number of KPIs
- Number of KPIs meeting their targets (MTD)
- Number of KPIs missing their targets (MTD)
KPI Trend Page – Track Performance Over Time
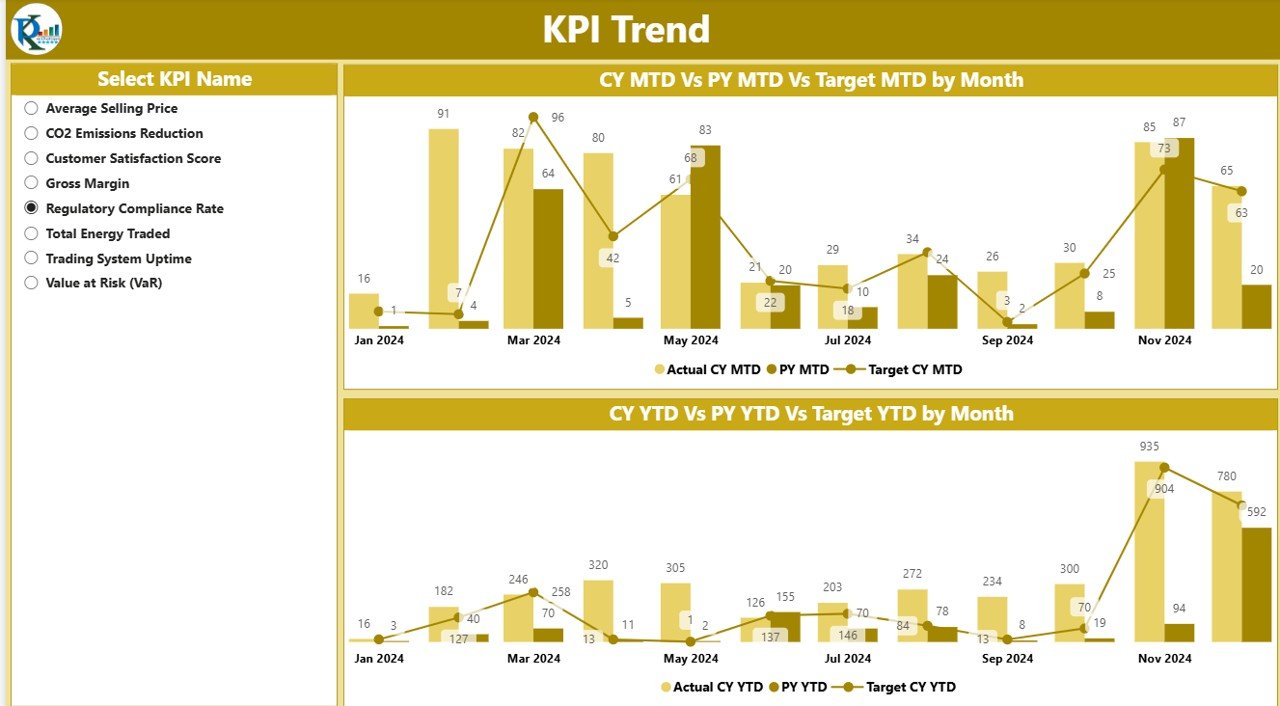
While the Summary Page provides an overview, the KPI Trend Page offers deeper insights into how each KPI performs over time.
Key Highlights:
-
Interactive Slicer: Users can select any KPI from the dropdown slicer to visualize its trend.
Combo Charts: Two combo charts display:
- MTD comparison of Actual, Target, and Previous Year values.
- YTD comparison of the same metrics.
These visualizations make it easy to identify patterns, deviations, and improvements across months. For instance:
-
Rising “Trade Margin per MWh” indicates better profitability.
-
Declining “Price Forecast Accuracy” shows the need for better predictive models.
-
Consistent “Renewable Energy Purchase Ratio” highlights progress in sustainability goals.
By analyzing trends rather than just static numbers, energy companies can make data-driven strategic adjustments in trading strategies, hedging, and procurement planning.
KPI Definition Page – Understand Every Metric Clearly
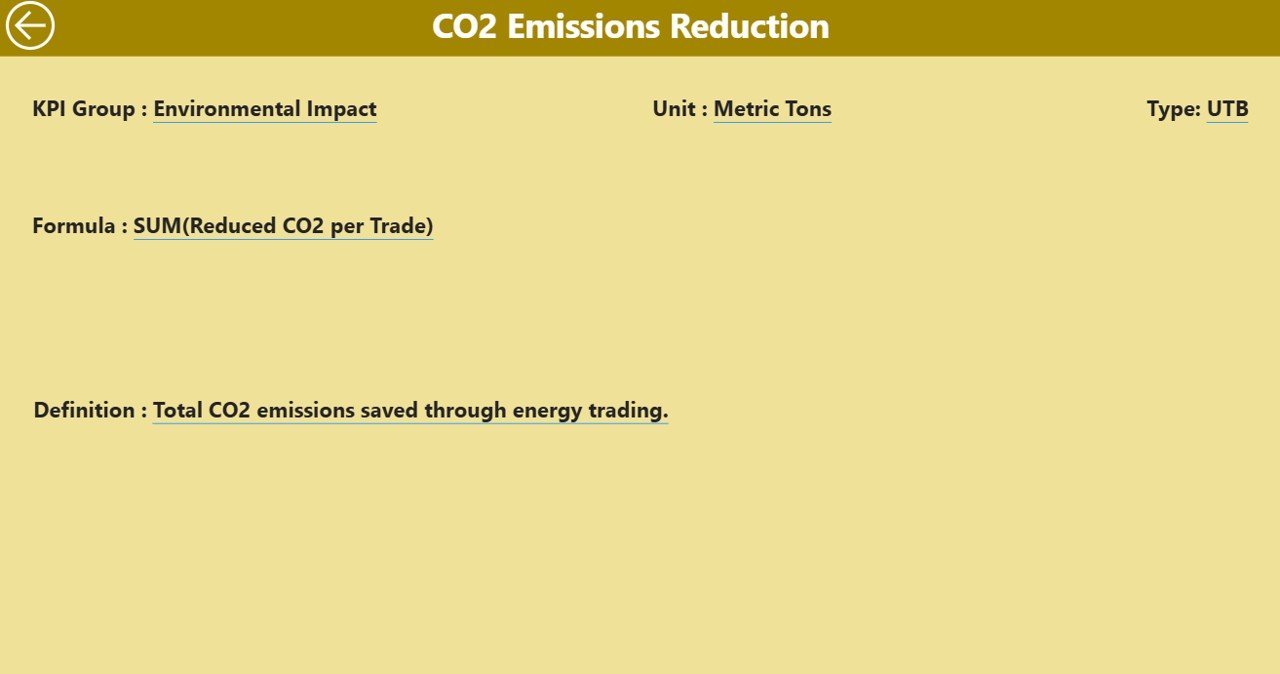
The KPI Definition Page acts as a knowledge base for your dashboard. It helps new users and analysts understand what each KPI means, how it is calculated, and why it matters.
This page is hidden by default and can be accessed through drill-through functionality from the Summary Page. Once inside, you’ll find:
-
KPI Number and Name
-
KPI Group
-
Unit of Measurement
-
Formula used
-
Definition
-
KPI Type (LTB or UTB)
Data Source and Excel Integration
The Power BI dashboard is powered by Excel files with three essential worksheets. This structure ensures that even non-technical users can easily update data and refresh visuals in Power BI.
1. Input_Actual Sheet
-
Contains actual KPI values by month.
-
Columns include: KPI Name, Month (first date of month), MTD Actual, YTD Actual.
2. Input_Target Sheet
-
Stores target KPI values for the same periods.
-
Columns include: KPI Name, Month, MTD Target, YTD Target.
3. KPI Definition Sheet
-
Serves as the metadata table with details like KPI Number, Group, Formula, Definition, and Type.
Together, these sheets form the backbone of the dashboard, ensuring consistent and accurate reporting.
How the Energy Trading KPI Dashboard Works
Click to Purchases Energy Trading KPI Dashboard in Power BI
Here’s how this Power BI dashboard transforms raw data into actionable insights:
-
Data Import: The Excel sheets (Actual, Target, Definition) are loaded into Power BI.
-
Data Modeling: Relationships are established between KPI names and their targets or definitions.
-
Visuals & Cards: Power BI visuals (cards, tables, combo charts) display performance data.
-
Conditional Formatting: Green and red arrows automatically highlight performance status.
-
Slicers: Users can slice data by Month or KPI Group for deeper analysis.
-
Drill-through Navigation: Users can explore individual KPIs through interactive drill-downs.
This seamless integration ensures that your dashboard updates automatically whenever you refresh your Excel source file.
Why Use a KPI Dashboard in Energy Trading?
Energy trading involves volatile markets, complex contracts, and tight profit margins. Manually tracking KPIs across spreadsheets or reports can lead to inefficiencies and delayed decisions.
A Power BI-based KPI dashboard solves these problems by:
-
Automating performance tracking
-
Providing real-time visibility
-
Enabling predictive decision-making
-
Reducing manual reporting time
With dynamic visuals and interactive filters, you can analyze metrics like:
-
Energy purchase/sale volume
-
Trading margins
-
Risk exposure
-
Price accuracy
-
Renewable participation ratios
-
Revenue per MWh
This empowers decision-makers to optimize trading strategies with confidence.
Advantages of the Energy Trading KPI Dashboard in Power BI
Here are the key advantages of using this dashboard:
✅ Centralized Data Visibility
-
View all energy trading KPIs in one place.
-
Eliminate manual report consolidation.
✅ Real-Time Decision Making
-
Instantly see performance gaps and opportunities.
-
Make proactive trading and risk management decisions.
✅ Customizable KPI Framework
-
Add or modify KPIs easily through Excel.
-
Supports diverse energy trading models — gas, oil, electricity, renewables.
✅ Powerful Visual Analytics
-
Interactive charts and color-coded icons make interpretation simple.
-
Drill-through and slicers enhance interactivity.
✅ Performance Benchmarking
-
Compare current performance against both target and previous year data.
-
Track monthly and yearly progress continuously.
✅ Easy Integration
-
Seamless connection with Excel ensures quick data refresh.
-
No complex database setup required.
✅ User-Friendly Interface
-
Intuitive design for both technical and non-technical users.
-
Visual storytelling helps communicate insights effectively.
🧠 Opportunities for Improvement
While this dashboard is comprehensive, there are areas where it can evolve further:
-
Incorporate AI forecasting models for energy price prediction.
-
Integrate with APIs to fetch live market prices or weather data.
-
Add alerts and notifications for threshold breaches.
-
Include role-based dashboards for traders, risk managers, and executives.
-
Enhance mobile compatibility for real-time access on the go.
🏆 Best Practices for the Energy Trading KPI Dashboard
To maximize the value of this Power BI dashboard, follow these best practices:
📌 Data Management
-
Maintain clean, validated data in Excel before refreshing Power BI.
-
Use consistent KPI naming conventions.
-
Automate data collection wherever possible.
📌 KPI Definition and Ownership
-
Clearly define each KPI’s formula and purpose.
-
Assign ownership to specific departments or teams.
-
Review KPIs quarterly to ensure continued relevance.
📌 Visualization Optimization
-
Use consistent color coding (green = good, red = needs attention).
-
Limit the number of visuals per page to improve clarity.
-
Leverage drill-throughs for in-depth KPI exploration.
📌 Performance Monitoring
-
Review MTD and YTD metrics regularly.
-
Set realistic but ambitious targets aligned with business goals.
-
Encourage teams to act on insights, not just observe data.
📌 Dashboard Maintenance
-
Refresh your Power BI data source weekly or monthly.
-
Back up Excel files regularly.
-
Continuously iterate based on user feedback.
Following these practices ensures your dashboard remains accurate, relevant, and impactful.
🧩 Use Cases of the Energy Trading KPI Dashboard
This dashboard can serve multiple functions across different departments:
-
Trading Teams: Monitor performance vs targets daily.
-
Risk Management: Track exposure, volatility, and compliance.
-
Finance Teams: Analyze revenue, cost, and profitability trends.
-
Executives: View high-level summaries for decision-making.
-
Sustainability Officers: Track renewable energy participation.
Whether your organization trades electricity futures, natural gas, or carbon credits, this dashboard adapts to your unique needs.
Conclusion
The Energy Trading KPI Dashboard in Power BI empowers energy companies to transform complex data into actionable insights. By combining Excel’s flexibility with Power BI’s visual power, this dashboard becomes a strategic asset for monitoring, analyzing, and improving trading performance.
❓ Frequently Asked Questions (FAQs)
1. What is the Energy Trading KPI Dashboard in Power BI?
It’s a pre-built Power BI dashboard that tracks key performance indicators in energy trading using Excel-based data sources.
2. Who can use this dashboard?
Energy traders, analysts, finance managers, and executives can all use it to monitor trading performance.
3. What type of data does it require?
It uses actual, target, and definition data for each KPI. These are stored in three Excel sheets — Input_Actual, Input_Target, and KPI Definition.
4. How often should the data be updated?
You can refresh data weekly or monthly, depending on your trading frequency and reporting cycle.
5. Can I customize the KPIs?
Yes. You can add, remove, or modify KPIs directly in the Excel sheet. The dashboard will automatically reflect the changes after refresh.
6. Does it support real-time data?
Currently, it supports manual refresh from Excel. However, you can integrate APIs or databases for real-time updates.
7. What benefits does Power BI bring to energy trading analytics?
Power BI provides interactive visualization, dynamic filtering, and drill-through features that simplify complex energy performance analysis.
Visit our YouTube channel to learn step-by-step video tutorials