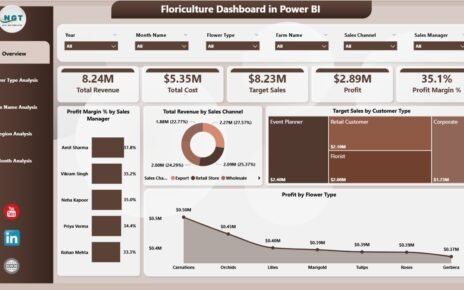
Enterprise Resource Planning (ERP) systems sit at the heart of modern organizations. They connect finance, operations, procurement, inventory, HR, and sales into a single platform. However, simply implementing an ERP system does not guarantee success. You must track performance continuously to ensure the ERP system delivers real business value. That is exactly where an ERP Systems KPI Dashboard in Excel becomes essential.
In this detailed and practical guide, you will learn what an ERP Systems KPI Dashboard in Excel is, why it matters, how it works, and how each worksheet contributes to decision-making. Moreover, this article explains the advantages, best practices, and frequently asked questions related to ERP KPI dashboards.
If you want clear visibility, faster decisions, and data-driven ERP management, this guide will help you achieve exactly that.
Click to Purchases ERP Systems KPI Dashboard in Excel
What Is an ERP Systems KPI Dashboard in Excel?
An ERP Systems KPI Dashboard in Excel is a centralized performance monitoring tool that tracks, measures, and visualizes key performance indicators related to ERP usage, efficiency, accuracy, and business impact.
Instead of reviewing raw ERP reports or exporting multiple system files, this dashboard presents all critical ERP KPIs in one interactive Excel interface. Because Excel supports formulas, dropdowns, charts, conditional formatting, and slicers, the dashboard remains powerful yet easy to use.
Moreover, teams can update data monthly, compare Actual vs Target, and analyze Month-to-Date (MTD) and Year-to-Date (YTD) performance without advanced technical skills.
Why Do ERP Systems Need KPI Tracking?
ERP systems involve significant investment in software licenses, implementation, training, and maintenance. Therefore, organizations must ensure the system delivers measurable results.
An ERP KPI Dashboard helps because it allows you to:
-
Monitor ERP adoption and usage trends
-
Measure process efficiency across departments
-
Identify system bottlenecks early
-
Compare performance against targets and previous years
-
Support leadership with data-backed insights
Without KPI tracking, ERP systems often become underutilized, inefficient, and misaligned with business goals.
Why Should You Use an ERP Systems KPI Dashboard in Excel?
Excel remains one of the most trusted tools in enterprises worldwide. Therefore, using Excel for ERP KPI tracking offers multiple advantages.
You should use an ERP KPI Dashboard in Excel because:
-
Excel remains widely available and familiar
-
No additional BI tool licenses are required
-
Users can customize KPIs easily
-
Data entry stays simple and controlled
-
Dashboards update instantly using formulas
Moreover, Excel allows full transparency, which helps finance teams, IT teams, and operations leaders work together efficiently.
How Does an ERP Systems KPI Dashboard in Excel Work?
The ERP Systems KPI Dashboard in Excel works through a structured worksheet-driven design. Each worksheet has a specific role, which ensures clarity, accuracy, and scalability.
You update actual numbers, targets, and previous year data in dedicated sheets. Then, the dashboard automatically calculates MTD and YTD values, highlights variances, and displays trends visually.
As a result, decision-makers can focus on insights instead of data preparation.
What Are the Key Features of the ERP Systems KPI Dashboard in Excel?
This ready-to-use ERP KPI dashboard includes 7 well-structured worksheets, each designed for a specific purpose.
Let us explore each worksheet in detail.
1. What Is the Purpose of the Home Sheet?
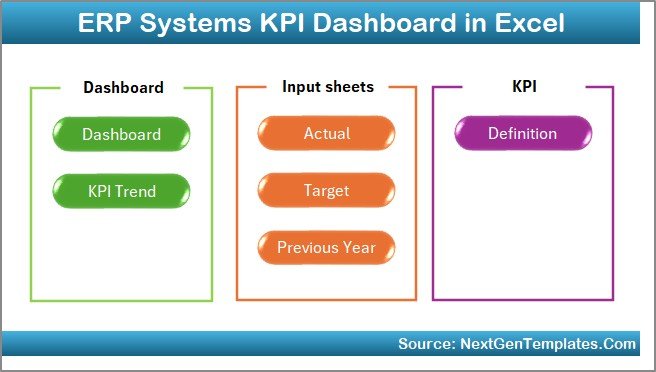
The Home Sheet acts as the navigation hub of the dashboard.
Key Highlights of the Home Sheet
-
Serves as an index page
-
Contains 6 clickable buttons
-
Allows quick navigation to each worksheet
-
Improves user experience and usability
Because of this design, users can move between sheets instantly without scrolling or searching.
2. How Does the Dashboard Sheet Help Track ERP KPIs?

The Dashboard Sheet is the core of the ERP Systems KPI Dashboard in Excel.
Key Functionalities of the Dashboard Sheet
-
Displays all ERP KPIs in one view
-
Month selection dropdown available at cell D3
-
Automatically updates KPIs when the month changes
-
Shows MTD Actual, Target, and Previous Year values
-
Shows YTD Actual, Target, and Previous Year values
-
Click to Purchases ERP Systems KPI Dashboard in Excel
-
Highlights:
-
Target vs Actual
-
Previous Year vs Actual
-
-
Uses conditional formatting arrows (up/down)
Because of these features, users can immediately identify overperformance, underperformance, and trend direction.
3. Why Is the KPI Trend Sheet Important?
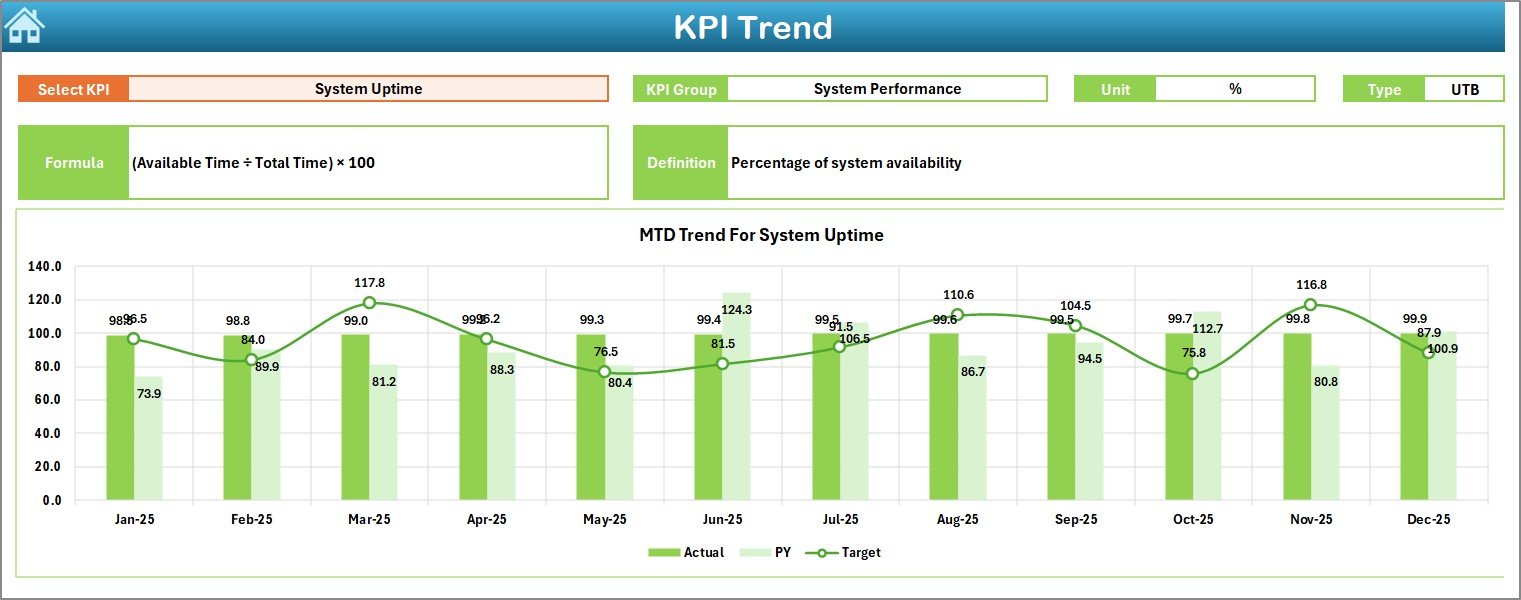
The KPI Trend Sheet focuses on deep KPI analysis rather than summary-level reporting.
What You Can Do in the KPI Trend Sheet
-
Select a KPI name from the dropdown at cell C3
-
View detailed KPI information:
-
KPI Group
-
Unit
-
KPI Type (Lower the Better / Upper the Better)
-
Formula
-
Definition
-
-
Analyze:
-
MTD trend for Actual, Target, and Previous Year
-
YTD trend for Actual, Target, and Previous Year
-
Because trends reveal patterns over time, this sheet supports root-cause analysis and long-term planning.
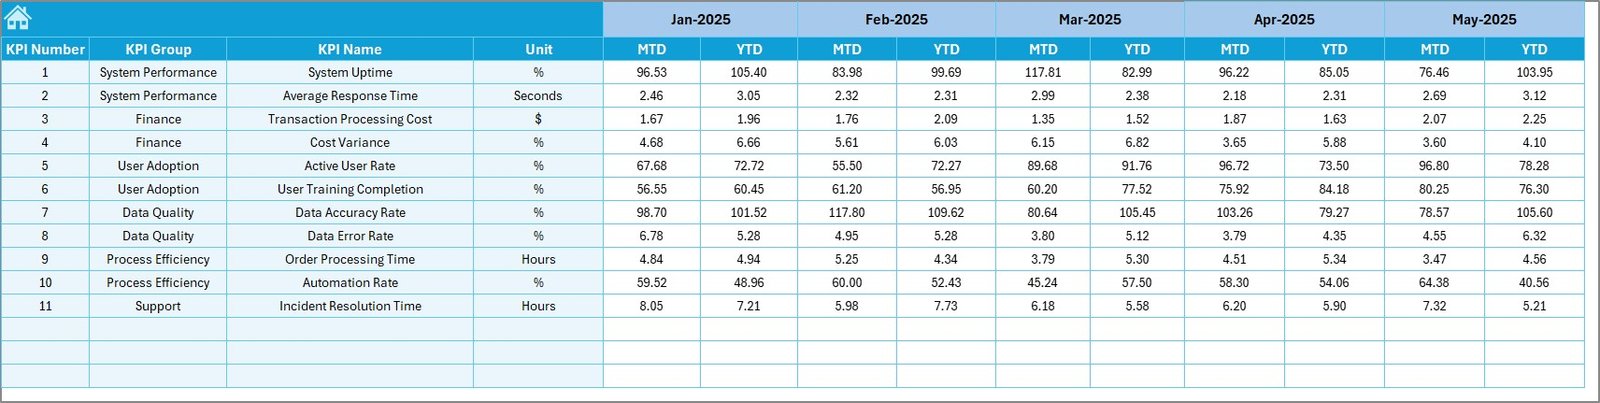
4. How Does the Actual Numbers Input Sheet Work?
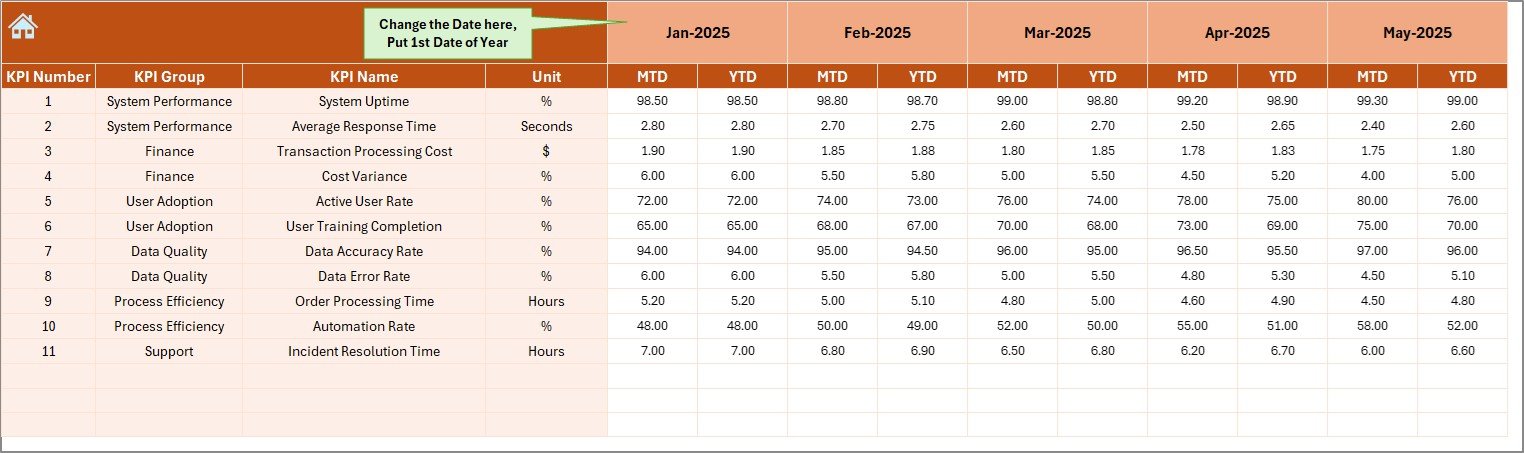
The Actual Numbers Input Sheet acts as the primary data entry point.
Key Features of the Actual Numbers Input Sheet
-
Enter Actual MTD and YTD values
-
Control the reporting month using cell E1
-
Define the first month of the year easily
-
Maintain clean and structured data input
Because the input process stays simple, data accuracy improves significantly.
Click to Purchases ERP Systems KPI Dashboard in Excel
5. Why Is the Target Sheet Tab Essential?
The Target Sheet Tab defines performance expectations.
What You Do in the Target Sheet
-
Enter Target values for each KPI
-
Define targets for:
-
MTD
-
YTD
-
-
Align ERP performance with business goals
When targets exist, performance comparisons become meaningful and actionable.
6. How Does the Previous Year Number Sheet Add Value?
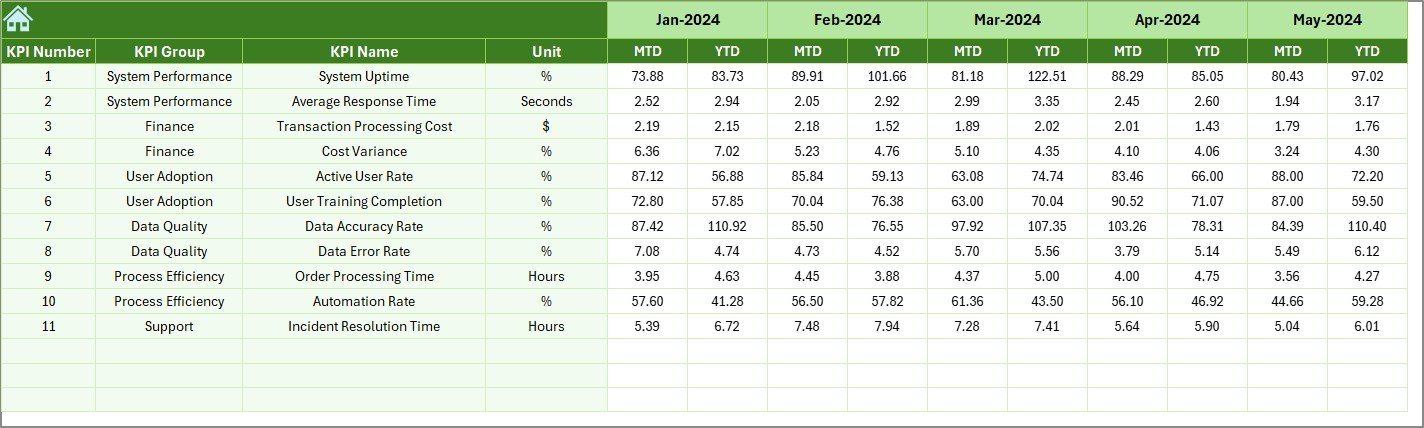
The Previous Year Number Sheet supports historical comparison.
Benefits of the Previous Year Sheet
-
Enter last year’s KPI values
-
Compare:
-
Current performance vs previous year
-
-
Identify improvement or decline clearly
Because year-over-year analysis highlights progress, leadership can evaluate ERP maturity effectively.
7. What Is the Role of the KPI Definition Sheet?
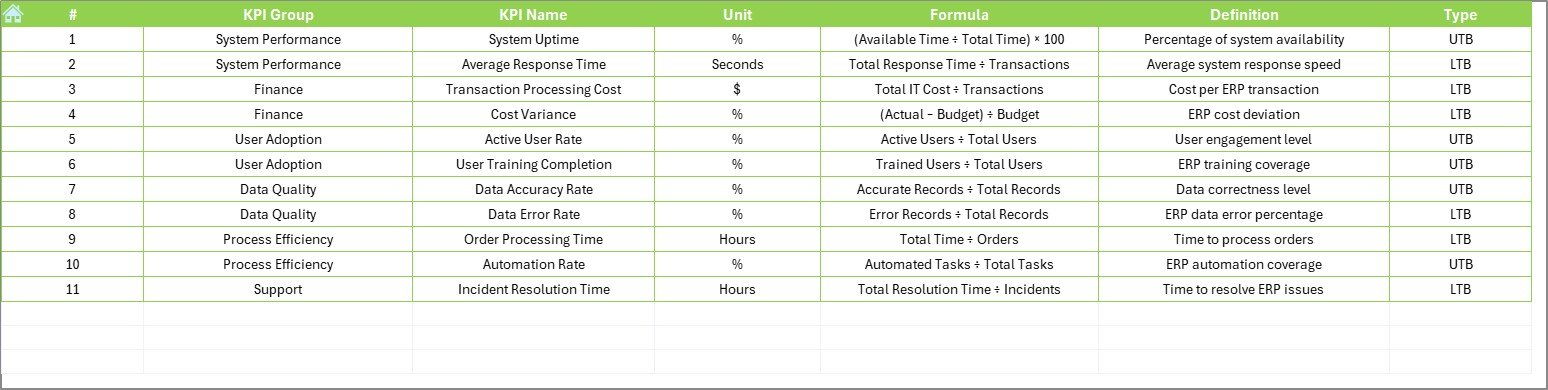
The KPI Definition Sheet ensures clarity and consistency.
What the KPI Definition Sheet Contains
-
KPI Name
-
KPI Group
-
Unit of Measurement
-
Formula
-
KPI Definition
Because all KPIs follow standardized definitions, confusion reduces across departments.
Which KPIs Can You Track in an ERP Systems KPI Dashboard?
An ERP KPI Dashboard can track multiple performance dimensions.
Common ERP KPI Categories
-
System Usage KPIs
-
Process Efficiency KPIs
-
Data Accuracy KPIs
-
Financial Integration KPIs
-
User Adoption KPIs
Example ERP KPIs
-
ERP User Adoption Rate
-
Transaction Processing Time
-
Data Error Rate
-
System Downtime
-
On-Time Reporting Rate
-
Cost Savings from ERP Automation
You can customize KPIs based on industry, department, or ERP module.
Advantages of ERP Systems KPI Dashboard in Excel
Click to Purchases ERP Systems KPI Dashboard in Excel
Using an ERP Systems KPI Dashboard in Excel delivers measurable business benefits.
Key Advantages
-
✅ Centralized ERP performance tracking
-
✅ Faster and data-driven decision-making
-
✅ Easy month-wise and year-wise analysis
-
✅ No dependency on complex BI tools
-
✅ High flexibility and customization
-
✅ Improved ERP accountability
-
✅ Better alignment between IT and business teams
Because of these advantages, organizations gain maximum ROI from ERP systems.
How Does an ERP KPI Dashboard Improve Decision-Making?
Decision-making improves because:
-
KPIs remain visible at all times
-
Variances highlight issues immediately
-
Trends support proactive actions
-
Targets align teams toward goals
As a result, managers shift from reactive problem-solving to strategic performance management.
Best Practices for the ERP Systems KPI Dashboard in Excel
To get the best results, you must follow proven best practices.
Best Practices You Should Follow
-
✔ Define KPIs clearly before implementation
-
✔ Limit KPIs to what truly matters
-
✔ Maintain clean and validated data inputs
-
✔ Review dashboard monthly without delay
-
✔ Use targets that reflect realistic goals
-
✔ Update KPI definitions when processes change
-
✔ Train users on interpretation, not just data entry
When you follow these practices, the dashboard remains relevant and trusted.
Who Should Use an ERP Systems KPI Dashboard in Excel?
This dashboard benefits multiple stakeholders.
Ideal Users
-
ERP Managers
-
IT Leadership Teams
-
Operations Managers
-
Finance Controllers
-
Process Improvement Teams
-
Business Analysts
Because Excel remains universal, adoption stays high across roles.
How Often Should You Update an ERP KPI Dashboard?
You should update the dashboard monthly in most cases. However, some organizations also perform quarterly reviews for strategic KPIs.
Regular updates ensure:
-
Accurate performance tracking
-
Timely corrective actions
-
Continuous ERP optimization
How Does This Dashboard Support ERP Optimization?
Click to Purchases ERP Systems KPI Dashboard in Excel
The dashboard supports ERP optimization by:
-
Highlighting inefficient processes
-
Identifying low adoption areas
-
Tracking improvement initiatives
-
Measuring ROI over time
Because insights stay visible, improvement efforts stay focused.
Conclusion: Why an ERP Systems KPI Dashboard in Excel Is a Must-Have Tool
An ERP Systems KPI Dashboard in Excel transforms complex ERP data into clear, actionable insights. Instead of struggling with scattered reports and delayed decisions, organizations gain a single source of truth for ERP performance.
With structured worksheets, automated calculations, visual indicators, and trend analysis, this dashboard empowers teams to measure what matters, act faster, and continuously improve ERP effectiveness.
If your organization wants better ERP outcomes without complex tools, this Excel-based KPI dashboard delivers exactly that.
Frequently Asked Questions (FAQs)
What is an ERP Systems KPI Dashboard in Excel used for?
It tracks, measures, and visualizes ERP performance KPIs to support better decision-making.
Can I customize KPIs in the dashboard?
Yes, you can fully customize KPIs, formulas, targets, and definitions.
Do I need advanced Excel skills to use this dashboard?
No, basic Excel knowledge is sufficient to use and update the dashboard.
How does the dashboard calculate MTD and YTD values?
It uses built-in Excel formulas that update automatically based on selected month.
Can this dashboard work with any ERP system?
Yes, it works with any ERP system because it tracks KPIs independently of ERP software.
How often should I review ERP KPIs?
You should review ERP KPIs monthly to ensure continuous improvement.
Visit our YouTube channel to learn step-by-step video tutorials