Running a hospital, dental clinic, or healthcare practice means managing countless data points — from patient records and billing to
In today's fast-evolving agricultural sector, leveraging data-driven decision-making is crucial to enhance productivity, efficiency, and sustainability. The Smart Agriculture KPI
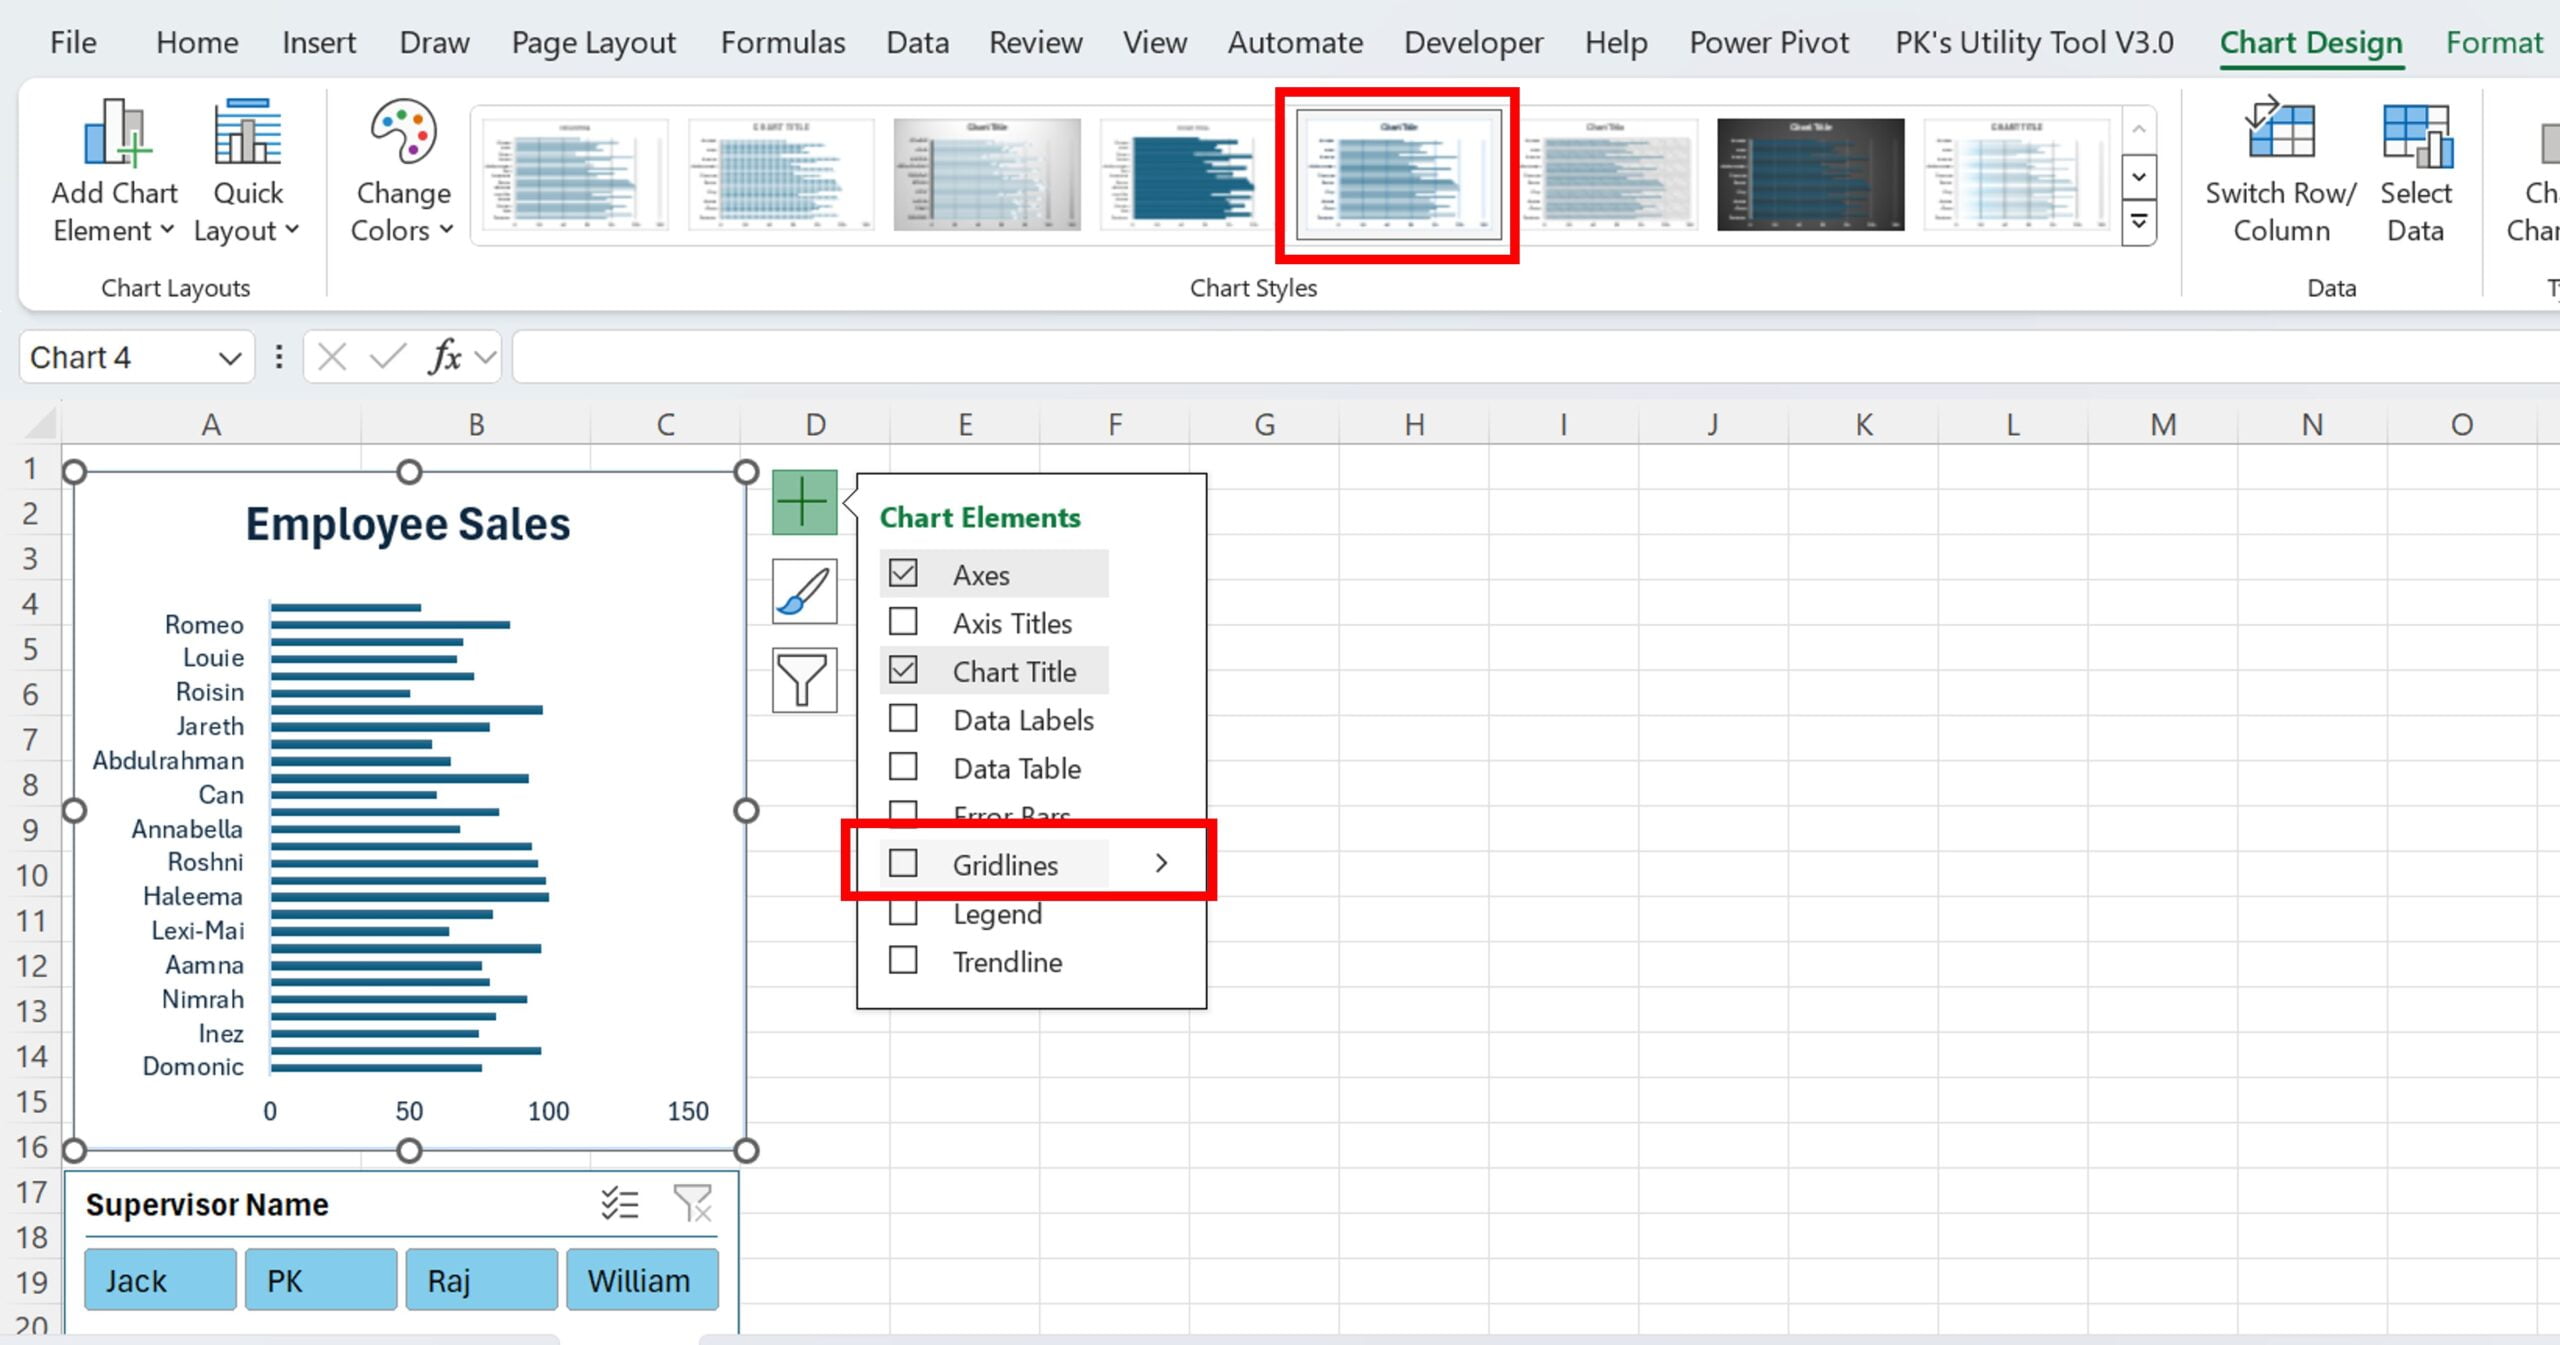
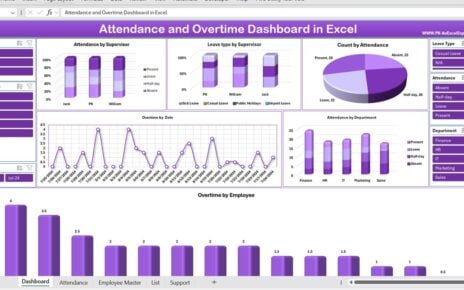
Managing employee attendance and overtime is crucial for any organization, regardless of its size. Accurate tracking of these metrics ensures