Executive Search & Staffing KPI Dashboard in Excel In the fast-paced world of talent acquisition, executive search and staffing agencies constantly juggle multiple goals—sourcing top talent, meeting client deadlines, reducing hiring costs, and improving candidate experience. To achieve these goals efficiently, data-driven decision-making has become essential. That’s where the Executive Search & Staffing KPI Dashboard in Excel steps in — a comprehensive tool designed to track, measure, and visualize performance indicators across all stages of the recruitment process.
This interactive and easy-to-use Excel dashboard helps HR leaders, recruiters, and staffing managers monitor the health of their operations, analyze team performance, and optimize recruitment outcomes with precision.
What Is an Executive Search & Staffing KPI Dashboard in Excel?
An Executive Search & Staffing KPI Dashboard is a performance monitoring tool built in Microsoft Excel that consolidates all critical recruitment and staffing metrics into a single, interactive platform. It transforms raw data into actionable insights, enabling teams to make faster and smarter business decisions.
Instead of manually tracking recruitment performance across multiple spreadsheets, this dashboard automates data visualization, presenting KPIs such as Time to Hire, Fill Rate, Cost per Hire, Candidate Pipeline, and Client Satisfaction in an easy-to-understand layout.
With built-in automation, drop-down selections, and conditional formatting, it provides an instant overview of your month-to-date (MTD) and year-to-date (YTD) performance across various dimensions like department, recruiter, client, or job type.
Click to Purchases Executive Search & Staffing KPI Dashboard in Excel
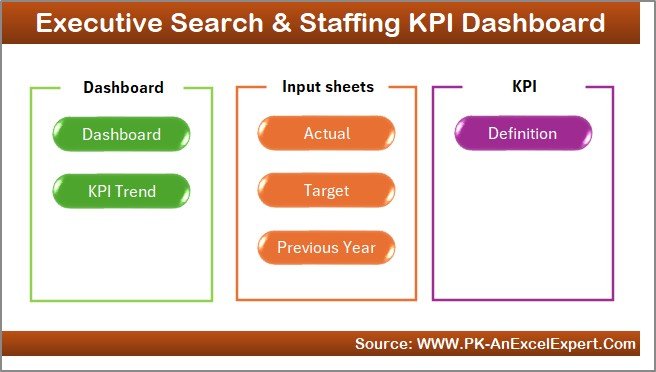
Structure of the Executive Search & Staffing KPI Dashboard
The dashboard template includes seven well-structured worksheets, each designed for a specific analytical purpose. Let’s explore each sheet in detail.
1. Home Sheet
The Home Sheet acts as the central navigation panel for the entire dashboard. It contains six interactive buttons that allow users to jump directly to other worksheet tabs such as Dashboard, KPI Trend, Actual Numbers Input, Target, Previous Year Data, and KPI Definition.
Click to Purchases Executive Search & Staffing KPI Dashboard in Excel
This design makes the dashboard intuitive and beginner-friendly—no need for complex menu navigation.
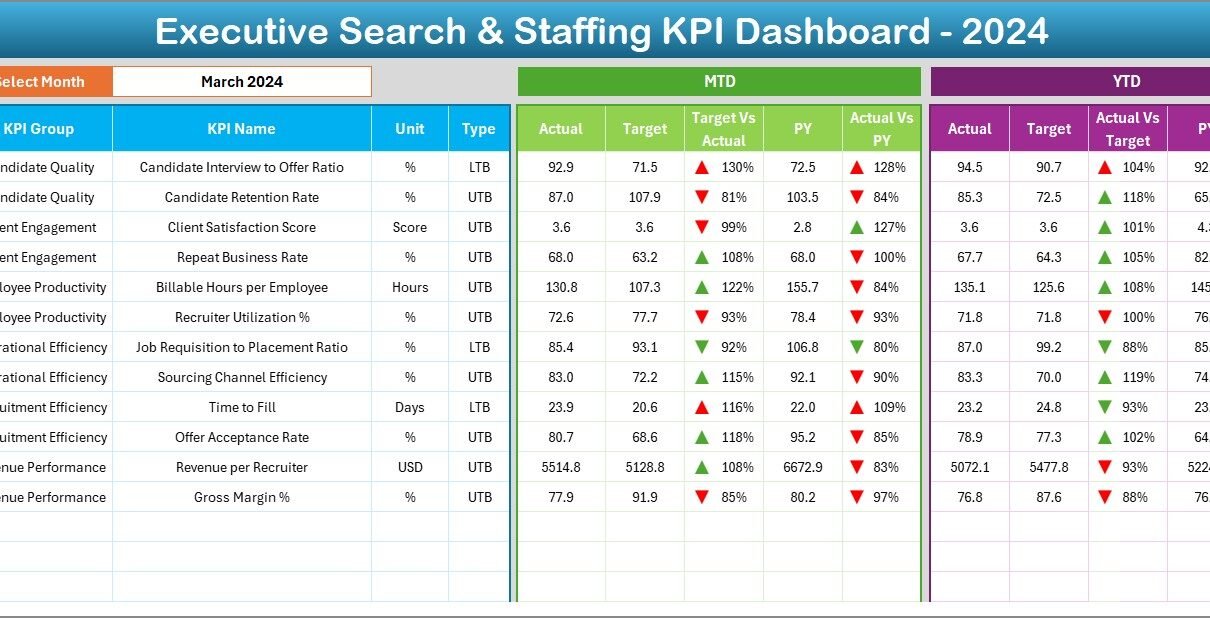
2. Dashboard Sheet
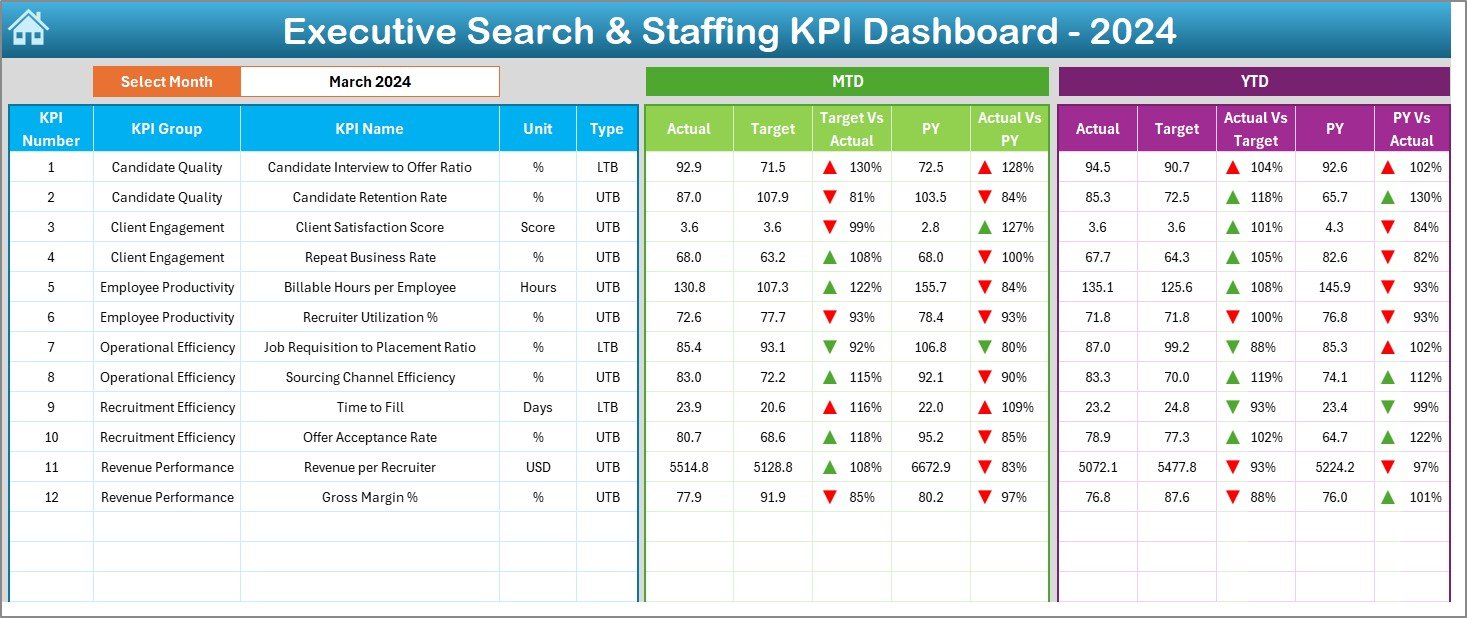
The Dashboard Sheet is the visual heart of this Excel file. It displays all key recruitment metrics through interactive charts and summary cards.
-
Dynamic Month Selection: Choose any month from the drop-down menu in range D3 to refresh all charts and KPI cards instantly.
-
MTD and YTD Comparisons: View both Month-to-Date (MTD) and Year-to-Date (YTD) figures for Actual, Target, and Previous Year data.
-
Conditional Formatting Arrows: Instantly visualize performance trends—green for improvement, red for decline.
-
KPI Highlights: Focus on vital staffing indicators like Time to Fill, Interview-to-Hire Ratio, Offer Acceptance Rate, and Client Retention Rate.
This sheet provides a complete overview of your staffing performance without any need for manual calculations.
3. KPI Trend Sheet
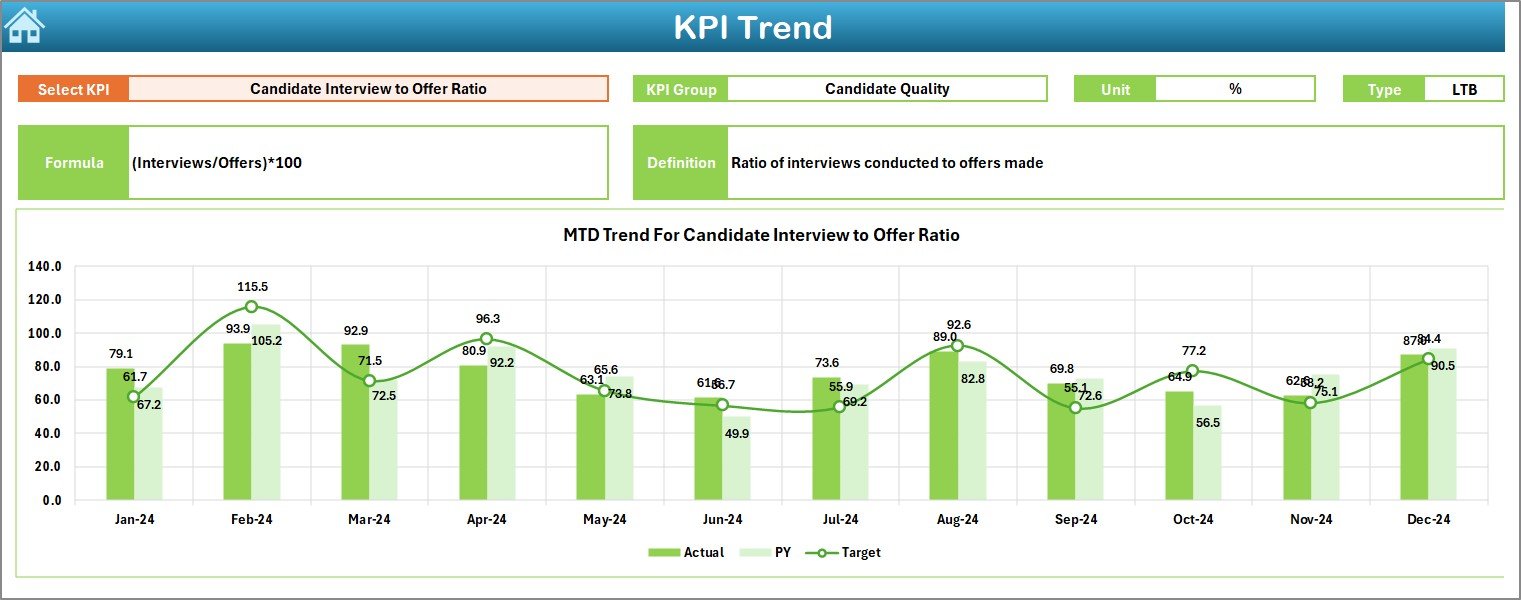
The KPI Trend Sheet allows you to deep-dive into individual metrics.
-
KPI Selection: Use the drop-down in cell C3 to select the KPI you want to analyze.
-
Information Panel: Displays the KPI Group, Unit, Type (UTB or LTB), Formula, and Definition.
-
Trend Chart: Visualizes Actual, Target, and Previous Year performance across all months, helping identify patterns or anomalies over time.
This sheet helps HR leaders pinpoint areas that need improvement and measure the long-term impact of staffing strategies.
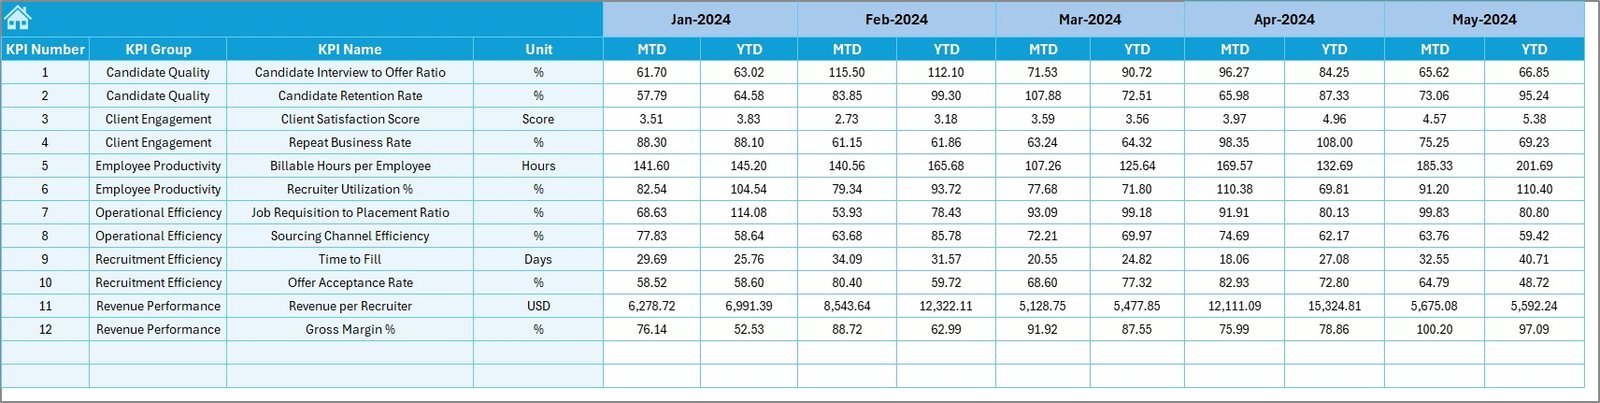
4. Actual Numbers Input Sheet
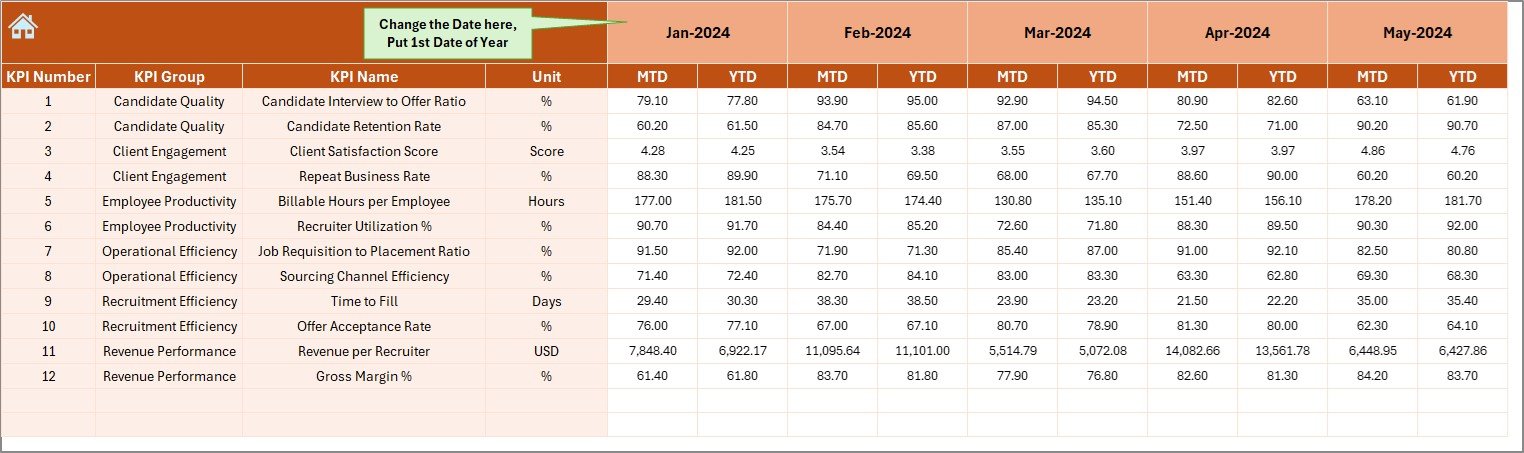
This sheet is where recruiters or analysts enter real performance data for each month.
-
Input both MTD and YTD actuals for every KPI.
-
Change the first month of the financial year easily from cell E1, and all date references update automatically.
This feature ensures flexibility for organizations following different fiscal calendars.
5. Target Sheet
Here, you define the performance goals for each KPI.
-
Enter monthly Target values for MTD and YTD for all metrics.
-
Align team expectations by comparing these targets against actual outcomes in the Dashboard and KPI Trend sheets.
Targets can be customized per team, department, or region, making this dashboard scalable across multiple branches.
6. Previous Year Data Sheet
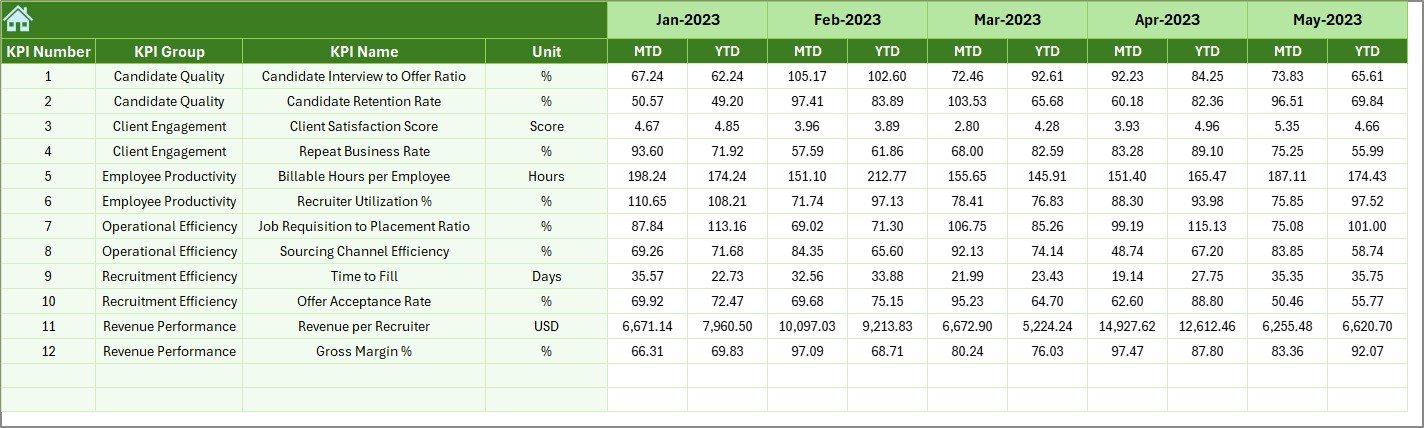
This sheet stores historical data from the previous year.
It acts as a benchmark to measure progress and evaluate performance improvements. By comparing last year’s results to current figures, recruiters can identify which processes have evolved and where improvement is still required.
7. KPI Definition Sheet
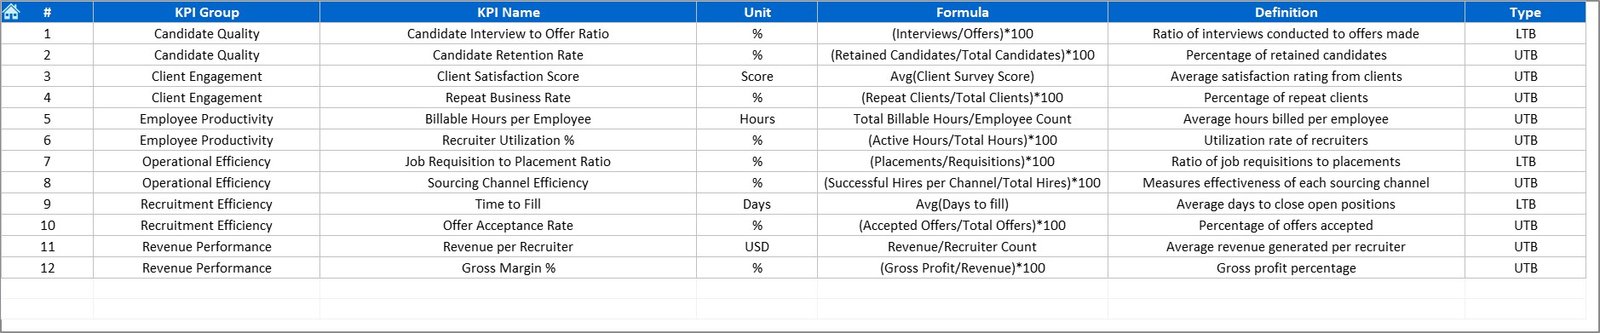
The KPI Definition Sheet provides clarity and consistency.
It contains columns for KPI Name, Group, Unit, Formula, and Definition.
This ensures that everyone on the team interprets each KPI the same way—eliminating confusion and promoting a data-driven culture within the HR function.
Click to Purchases Executive Search & Staffing KPI Dashboard in Excel
Key Metrics to Track in an Executive Search & Staffing Dashboard
A robust staffing dashboard should track both efficiency and effectiveness metrics. Here are some key KPIs typically included:
-
Time to Hire: Average time between job posting and candidate acceptance.
-
Cost per Hire: Total recruitment costs divided by number of hires.
-
Offer Acceptance Rate: Percentage of candidates who accept job offers.
-
Interview-to-Hire Ratio: Number of interviews conducted per successful hire.
-
Fill Rate: Ratio of positions filled versus open positions.
-
Client Satisfaction Score: Measured through feedback surveys or Net Promoter Scores.
-
Candidate Quality Score: Based on post-hire evaluations.
-
Retention Rate: Percentage of employees who remain after six or twelve months.
-
Revenue per Recruiter: Efficiency metric for individual recruiter performance.
-
Sourcing Channel Effectiveness: Measures hires by referral, job board, or agency source.
Each KPI provides valuable insights into recruitment performance and helps align staffing operations with organizational goals.
Why Use Excel for Executive Search & Staffing KPIs?
While there are many specialized HR analytics tools, Excel remains a powerful choice for staffing analytics due to its flexibility, affordability, and familiarity.
Benefits of Using Excel:
-
No Subscription Costs: Unlike cloud software, Excel offers a one-time purchase model.
-
Customizable Structure: Easily add or modify KPIs based on business needs.
-
Automation-Ready: Incorporate formulas, conditional formatting, and pivot charts.
-
Data Security: Keep sensitive recruitment data offline if required.
-
Integration: Import or export data from Applicant Tracking Systems (ATS) or HR databases with minimal effort.
Advantages of Executive Search & Staffing KPI Dashboard in Excel
Using this KPI dashboard can transform the way staffing companies operate. Below are the major advantages:
✅ Data-Driven Decision Making: Helps HR managers make informed choices based on facts, not assumptions.
✅ Performance Transparency: Enables visibility into recruiter and department-level productivity.
✅ Goal Alignment: Ensures every team member knows what success looks like.
✅ Faster Reporting: Automatically updates KPIs without manual recalculations.
✅ Trend Identification: Detects early warning signs in hiring pipelines.
✅ Benchmarking: Compares current results against previous years or industry standards.
✅ Client Confidence: Present clear, professional performance reports to clients.
✅ Customizable: Adjust KPIs, colors, and charts as per your agency’s preferences.
Opportunities for Improvement
Even the best dashboards can evolve. Consider enhancing your dashboard by:
🔹 Adding Recruiter-Level Analysis: Compare performance across individual recruiters or teams.
🔹 Incorporating Diversity Metrics: Track gender balance, minority representation, and inclusion KPIs.
🔹 Adding Predictive Insights: Use Excel’s trendline forecasting to anticipate hiring bottlenecks.
🔹 Integrating Power Query: Automate data imports from multiple recruitment sources.
🔹 Visual Enhancements: Include sparklines, progress bars, or traffic-light indicators for quick visuals.
Continuous improvement ensures that your dashboard remains aligned with organizational growth and changing hiring landscapes.
Best Practices for Using the Executive Search & Staffing KPI Dashboard
To maximize the value of your Excel KPI dashboard, follow these best practices:
-
Define Clear KPI Ownership: Assign responsible individuals for updating and reviewing specific KPIs.
-
Maintain Data Accuracy: Regularly audit input sheets to ensure no manual errors.
-
Use Consistent Units: Maintain uniform metrics (e.g., days, %).
-
Schedule Monthly Reviews: Analyze dashboard results in team meetings.
-
Leverage Visual Indicators: Use color codes for better performance clarity.
-
Document KPI Definitions: Keep the KPI Definition sheet updated for reference.
-
Automate Data Refreshes: Use Excel formulas and pivot tables to auto-update visuals.
-
Backup Regularly: Protect your recruitment data with scheduled backups.
By applying these practices, your dashboard will not only save time but also elevate recruitment performance tracking.
Click to Purchases Executive Search & Staffing KPI Dashboard in Excel
Who Can Benefit from This Dashboard?
The Executive Search & Staffing KPI Dashboard is ideal for:
-
Recruitment Agencies: Measure consultant productivity and client satisfaction.
-
Corporate HR Teams: Track internal hiring efficiency and costs.
-
Talent Acquisition Leaders: Assess overall hiring strategy success.
-
Freelance Recruiters: Present professional performance reports to clients.
-
Business Owners: Gain a quick visual summary of hiring outcomes.
How to Use the Dashboard
Here’s a simple step-by-step guide to get started:
-
Open the Excel file.
-
Start at the Home Sheet and navigate using buttons.
-
Update Targets, Actuals, and Previous Year Data in their respective sheets.
-
View Results on the Dashboard and KPI Trend sheets.
-
Filter by Month using the drop-down menu to analyze different time frames.
-
Compare KPIs to identify improvement areas.
-
Save a copy for monthly reporting or team presentations.
Conclusion
The Executive Search & Staffing KPI Dashboard in Excel empowers recruitment professionals with the tools they need to track performance, visualize results, and make data-driven decisions. It simplifies complex data into meaningful visuals, improves transparency, and supports continuous improvement across staffing operations.
Whether you’re an independent recruiter or managing a large HR department, this dashboard helps you measure what truly matters — the efficiency, quality, and impact of your hiring efforts.
With its customizable design, simple interface, and advanced analytics, this Excel-based KPI dashboard stands as a powerful ally for modern staffing operations.
Click to Purchases Executive Search & Staffing KPI Dashboard in Excel
Frequently Asked Questions (FAQs)
1. What KPIs should a staffing agency track?
Staffing agencies should monitor KPIs such as Time to Hire, Offer Acceptance Rate, Cost per Hire, Fill Rate, and Client Satisfaction Score to evaluate performance effectively.
2. Can I customize the dashboard KPIs?
Yes. You can easily add, remove, or rename KPIs in the KPI Definition sheet. The charts and visuals automatically update once you refresh your data.
3. How often should I update the dashboard?
It’s recommended to update it monthly or after every major recruitment cycle to keep your insights relevant.
4. Is Excel better than dedicated HR software for KPI tracking?
For small and mid-sized teams, Excel is a cost-effective, customizable, and secure option. Larger organizations may integrate Excel with advanced BI tools like Power BI for extended insights.
5. Can I compare performance across years?
Absolutely. The Previous Year Data sheet allows side-by-side performance comparisons, helping you assess growth trends and identify areas of improvement.
Click to Purchases Executive Search & Staffing KPI Dashboard in Excel
Visit our YouTube channel to learn step-by-step video tutorials
Watch the step-by-step video tutorial: