Modern fertilizer manufacturing companies operate in a highly competitive and performance-driven environment. Every day, plants manage production volumes, raw material consumption, quality standards, energy efficiency, and operational costs. However, many organizations still struggle to monitor performance efficiently because data remains scattered across spreadsheets and manual reports.
As a result, decision-makers often lack real-time visibility into operational performance. Consequently, delays occur, targets get missed, and improvement opportunities remain hidden. Therefore, companies increasingly adopt data visualization tools that transform raw numbers into meaningful insights.
Click to Purchases Fertilizer Manufacturing KPI Dashboard in Power BI
One powerful solution is the Fertilizer Manufacturing KPI Dashboard in Power BI — a structured, interactive, and ready-to-use analytics system designed specifically to track manufacturing performance indicators.
In this comprehensive guide, you will learn everything about the Fertilizer Manufacturing KPI Dashboard in Power BI, including its features, structure, benefits, implementation process, best practices, and frequently asked questions.
What Is a Fertilizer Manufacturing KPI Dashboard in Power BI?
A Fertilizer Manufacturing KPI Dashboard in Power BI is an interactive business intelligence solution that helps manufacturing organizations monitor key performance indicators (KPIs) through visual analytics.
Instead of reviewing multiple reports, managers can analyze performance using dynamic charts, KPI cards, slicers, and comparisons — all in one centralized dashboard.
The dashboard captures data through an Excel file and transforms it into powerful visual insights using Power BI.
Why is this important?
Because fertilizer manufacturing depends heavily on operational efficiency, even small performance deviations can impact profitability. Therefore, real-time KPI tracking becomes essential for better planning and faster decision-making.
Why Do Fertilizer Manufacturers Need KPI Dashboards?
Many fertilizer plants rely on manual tracking methods. Although spreadsheets store data effectively, they rarely provide instant insights.
Here’s why organizations need KPI dashboards:
-
Production managers require daily performance visibility.
-
Leadership teams need quick comparisons between targets and actual results.
-
Quality teams must monitor performance trends continuously.
-
Finance departments analyze operational efficiency and cost control.
Without visualization, teams spend hours preparing reports. However, with Power BI dashboards, insights appear instantly.
Key Features of the Fertilizer Manufacturing KPI Dashboard in Power BI
This ready-to-use dashboard includes three interactive pages designed to simplify KPI monitoring and analysis.
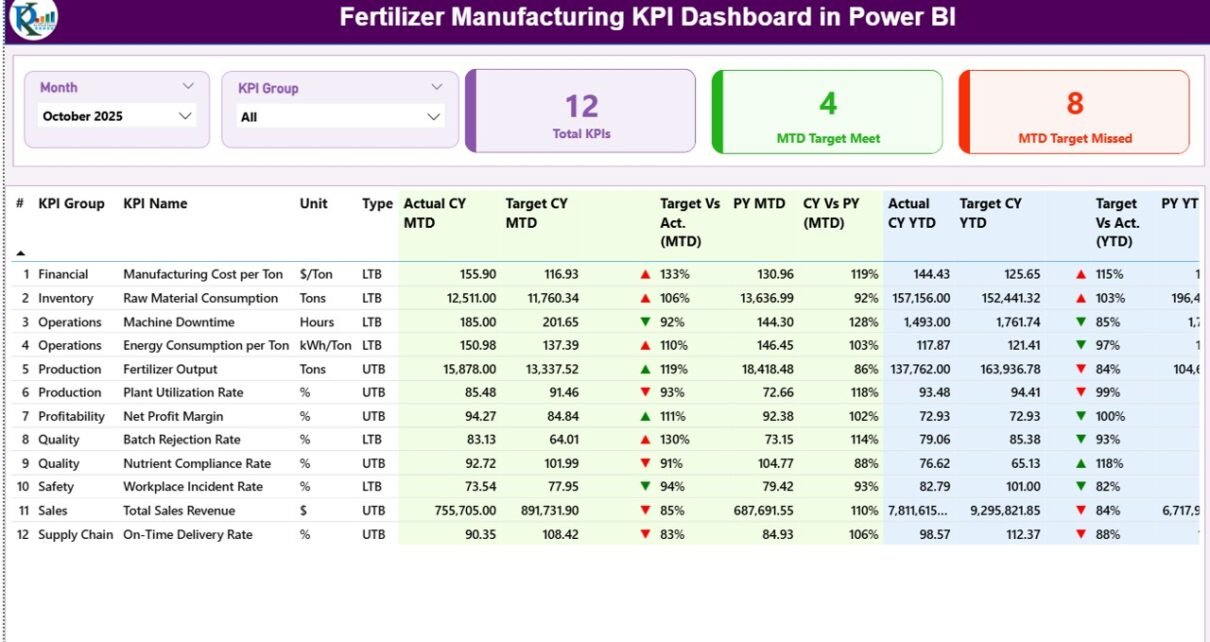
1️⃣ Summary Page – The Main Performance Overview
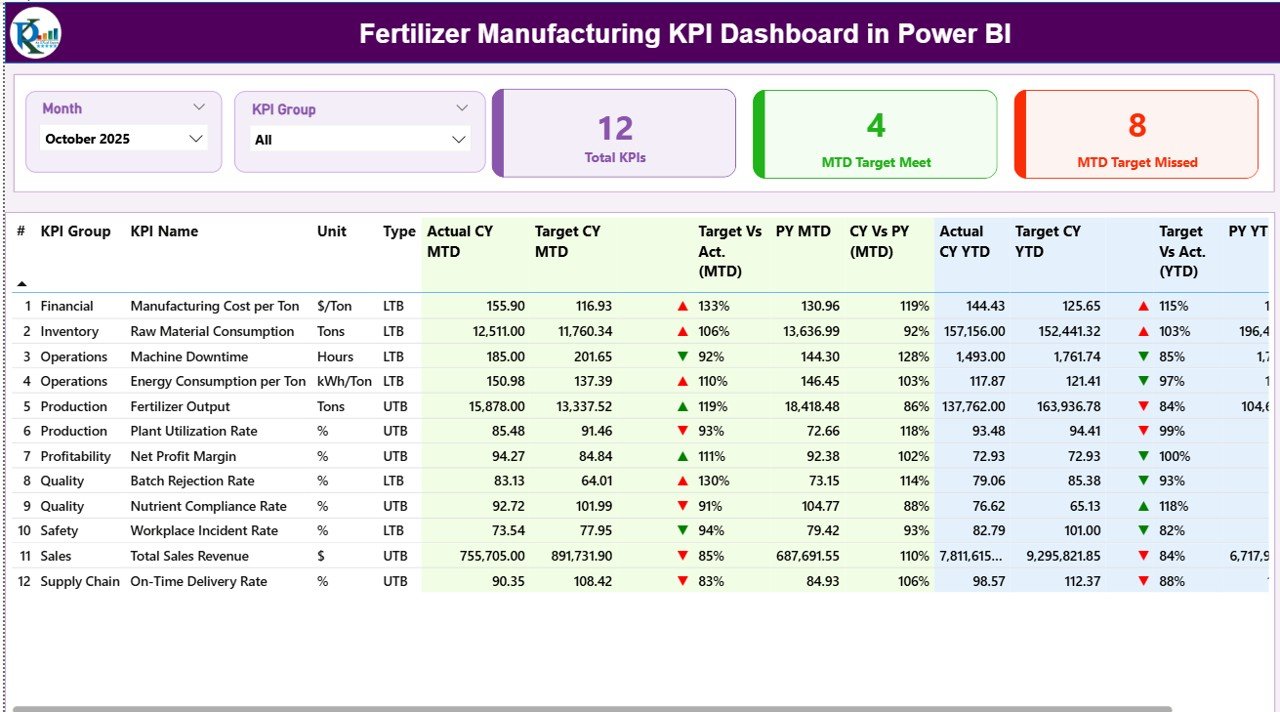
The Summary Page works as the central control panel of the dashboard. Users immediately understand overall performance once they open the report.
Interactive Filters (Slicers)
At the top of the dashboard, users can select:
-
Month slicer
-
KPI Group slicer
These filters allow instant performance analysis without changing datasets manually.
Click to Purchases Fertilizer Manufacturing KPI Dashboard in Power BI
KPI Performance Cards
The dashboard displays three powerful KPI cards:
-
Total KPIs Count – Shows total tracked KPIs.
-
MTD Target Meet Count – Displays KPIs achieving targets.
-
MTD Target Missed Count – Highlights underperforming KPIs.
Therefore, managers quickly identify performance status within seconds.
Detailed KPI Performance Table
Below the cards, the dashboard shows a structured KPI table containing detailed information.
KPI Number
Represents the sequence number assigned to each KPI.
KPI Group
Shows the category or functional group of the KPI.
KPI Name
Displays the specific performance indicator.
Unit
Defines measurement units such as percentage, tons, or cost value.
Type (LTB or UTB)
-
LTB (Lower the Better) – Lower values indicate improvement.
-
UTB (Upper the Better) – Higher values indicate improvement.
MTD (Month-To-Date) Performance Metrics
The dashboard tracks monthly performance using:
-
Actual CY MTD
-
Target CY MTD
-
MTD Status Icons (▲ ▼)
Green arrows indicate success, while red arrows highlight gaps.
Target vs Actual (MTD)
Calculated using:
Actual MTD ÷ Target MTD
This percentage shows how close performance comes to targets.
Previous Year Comparison (PY MTD)
Managers compare current performance with historical data.
CY vs PY (MTD)
Formula used:
Current Year MTD ÷ Previous Year MTD
Therefore, trend improvement becomes clearly visible.
YTD (Year-To-Date) Performance Metrics
Similarly, the dashboard evaluates long-term performance.
Click to Purchases Fertilizer Manufacturing KPI Dashboard in Power BI
Metrics include:
-
Actual CY YTD
-
Target CY YTD
-
YTD Status Icons
-
Target vs Actual (YTD)
-
PY YTD comparison
-
CY vs PY (YTD)
As a result, leadership teams gain both short-term and long-term insights simultaneously.
2️⃣ KPI Trend Page – Performance Analysis Over Time
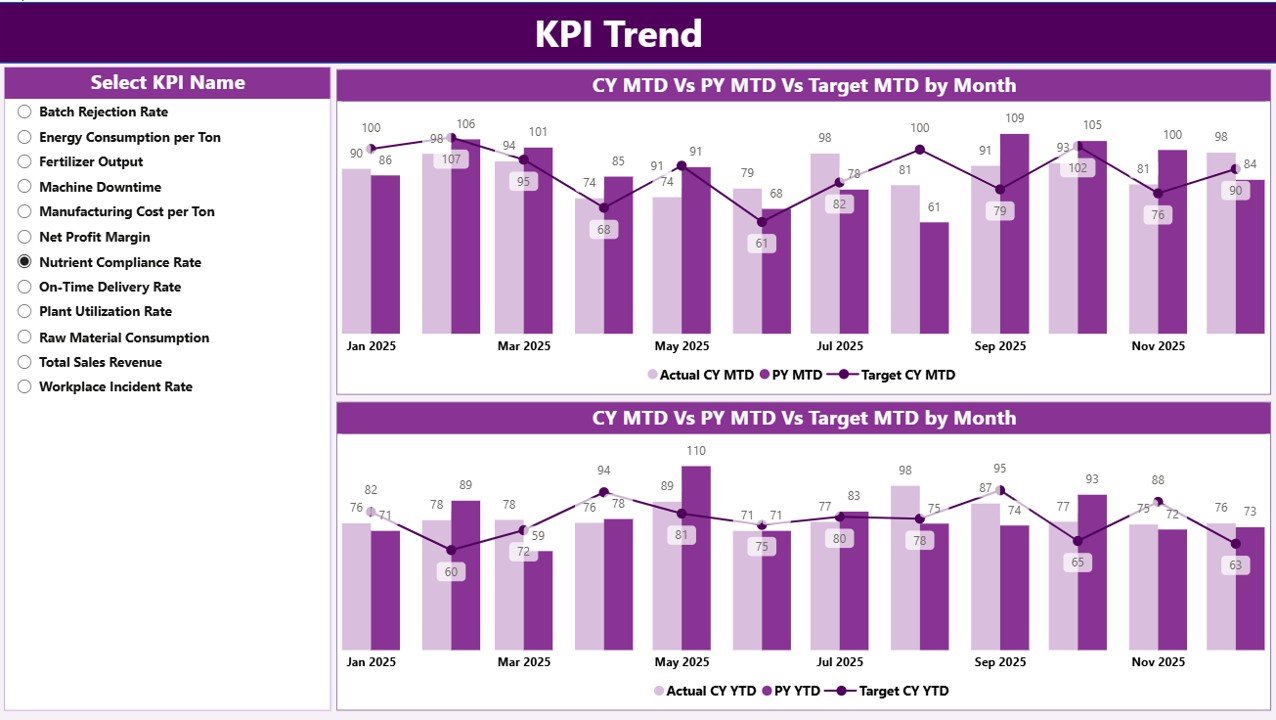
While the summary page shows status, the KPI Trend Page explains performance behavior.
What Does This Page Show?
The page includes two combo charts:
-
MTD Performance Trend
-
YTD Performance Trend
Each chart compares:
-
Current Year Actual
-
Previous Year Actual
-
Target Values
KPI Selection Slicer
Users select a KPI from the left-side slicer. Immediately, charts update automatically.
Therefore, managers analyze performance patterns without building additional reports.
3️⃣ KPI Definition Page – Deep KPI Understanding
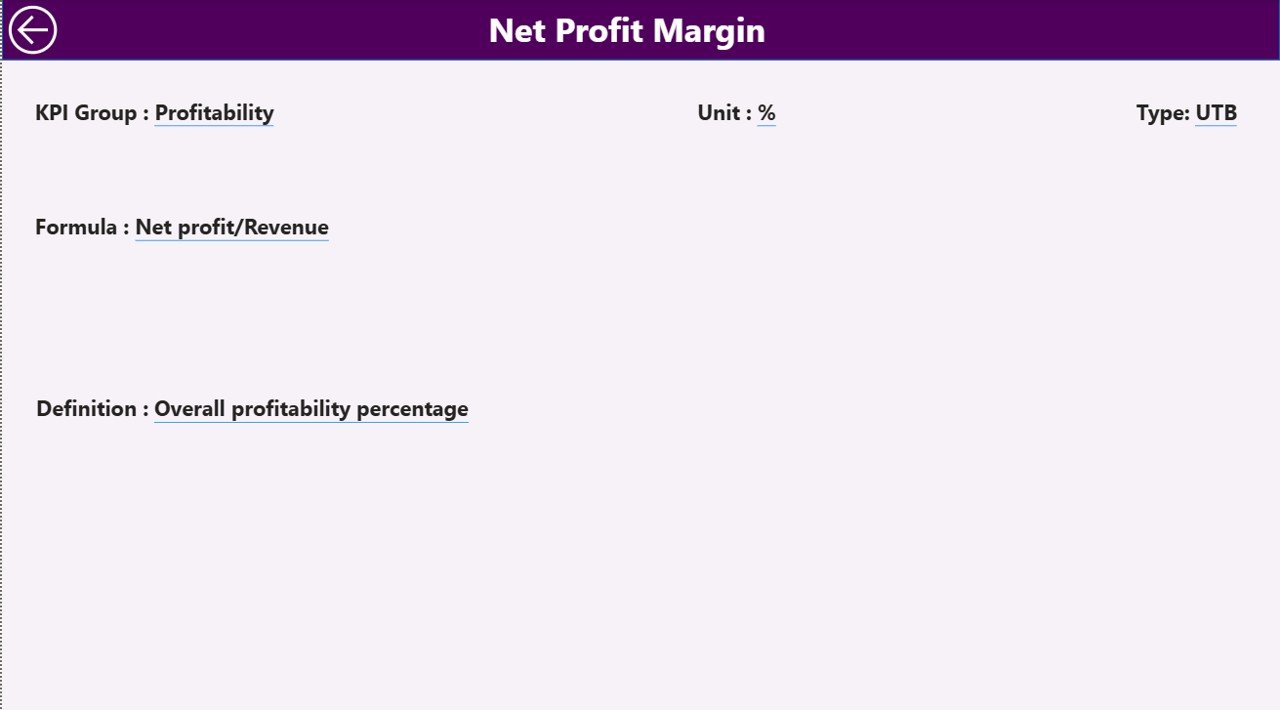
The dashboard also includes a hidden drill-through page called the KPI Definition Page.
Users access this page directly from the Summary Page.
Information Available:
-
KPI Formula
-
KPI Definition
-
KPI Unit
-
KPI Type
-
KPI Group
This feature ensures transparency because users understand how each KPI calculates performance.
A back button allows users to return quickly to the main dashboard.
How Does the Excel Data Source Work?
The dashboard connects to an Excel file containing structured datasets.
Users only update Excel sheets, and Power BI automatically refreshes visuals.
1. Input_Actual Sheet
Users enter:
-
KPI Name
-
Month (first date of month)
-
MTD values
-
YTD values
This sheet captures actual performance data.
2. Input_Target Sheet
Users record:
-
KPI targets
-
Month
-
MTD targets
-
YTD targets
Therefore, Power BI compares actual performance against expectations.
3. KPI Definition Sheet
Users define KPI metadata:
-
KPI Number
-
KPI Group
-
KPI Name
-
Unit
-
Formula
-
Definition
-
Type (LTB/UTB)
This structure ensures consistency across reports.
What KPIs Can Fertilizer Manufacturers Track?
Click to Purchases Fertilizer Manufacturing KPI Dashboard in Power BI
Organizations can monitor various operational KPIs such as:
-
Production Volume
-
Plant Utilization Rate
-
Energy Consumption per Ton
-
Raw Material Efficiency
-
Equipment Downtime
-
Quality Compliance Rate
-
Inventory Turnover
-
Maintenance Efficiency
-
Safety Incident Rate
-
Cost per Ton Produced
-
On-Time Delivery Rate
Because the dashboard remains flexible, companies customize KPIs easily.
Advantages of Fertilizer Manufacturing KPI Dashboard in Power BI
Implementing this dashboard delivers multiple operational benefits.
✅ Real-Time Performance Visibility
Managers instantly monitor operational results.
✅ Faster Decision-Making
Visual insights eliminate manual calculations.
✅ Improved Accountability
Teams clearly understand performance targets.
✅ Data Centralization
All KPIs exist within one platform.
✅ Historical Performance Comparison
Organizations track growth using previous-year analysis.
✅ Easy Data Updates
Users update Excel instead of modifying dashboards.
✅ Better Strategic Planning
Leadership identifies trends early and plans proactively.
How Does This Dashboard Improve Manufacturing Efficiency?
The dashboard supports efficiency in several ways:
-
Highlights production bottlenecks quickly.
-
Identifies underperforming KPIs immediately.
-
Encourages data-driven decisions.
-
Improves collaboration between departments.
-
Reduces reporting time significantly.
Consequently, organizations focus more on improvement rather than reporting preparation.
Steps to Implement the Fertilizer Manufacturing KPI Dashboard
Step 1: Define KPIs
Identify operational, quality, and financial indicators.
Step 2: Prepare Excel Data
Fill Actual and Target sheets regularly.
Step 3: Maintain KPI Definitions
Ensure formulas and definitions remain accurate.
Step 4: Connect Excel to Power BI
Load data using Power BI data connection.
Step 5: Refresh Dashboard
Update visuals automatically after data entry.
Step 6: Review Performance Monthly
Analyze trends and plan corrective actions.
Best Practices for the Fertilizer Manufacturing KPI Dashboard
To achieve maximum results, organizations should follow proven practices.
✔ Maintain Data Accuracy
Always validate input numbers before refresh.
✔ Update Data Regularly
Consistent updates improve trend analysis.
✔ Limit KPI Overload
Track only meaningful KPIs.
✔ Standardize KPI Definitions
Ensure teams interpret KPIs consistently.
✔ Use Monthly Reviews
Discuss dashboard insights during review meetings.
✔ Train Users
Educate teams about slicers and drill-through features.
✔ Monitor Trends, Not Just Numbers
Focus on improvement patterns instead of single results.
Common Challenges and How to Overcome Them
Challenge: Data Inconsistency
Solution: Create standardized data entry templates.
Challenge: Too Many KPIs
Solution: Focus on strategic indicators.
Challenge: Low User Adoption
Solution: Provide training sessions.
Challenge: Delayed Updates
Solution: Assign data ownership responsibilities.
Who Can Benefit from This Dashboard?
Click to Purchases Fertilizer Manufacturing KPI Dashboard in Power BI
This dashboard helps multiple roles:
-
Plant Managers
-
Production Supervisors
-
Quality Control Teams
-
Operations Heads
-
Finance Managers
-
Supply Chain Leaders
-
Senior Executives
Therefore, the dashboard becomes a company-wide performance tool.
Why Choose Power BI for Manufacturing KPI Monitoring?
Power BI offers several advantages:
-
Interactive visualization
-
Automatic data refresh
-
Drill-through analysis
-
Easy sharing
-
Scalable architecture
-
Professional reporting interface
Because Power BI integrates smoothly with Excel, organizations implement solutions quickly.
Future Scope of KPI Dashboards in Fertilizer Manufacturing
Manufacturing analytics continues evolving rapidly.
In the future, dashboards may include:
-
Predictive maintenance analytics
-
AI-driven performance forecasting
-
IoT equipment integration
-
Real-time sensor monitoring
-
Automated alerts for KPI deviations
Therefore, companies adopting dashboards today prepare for smarter factories tomorrow.
Conclusion
The Fertilizer Manufacturing KPI Dashboard in Power BI transforms how organizations monitor performance. Instead of relying on static reports, teams gain dynamic insights that drive operational excellence.
Because the dashboard combines Excel data management with Power BI visualization, implementation remains simple yet powerful. Managers monitor targets, analyze trends, and compare historical performance — all from one centralized interface.
Ultimately, organizations improve productivity, enhance accountability, and make faster decisions using data-driven insights.
Frequently Asked Questions (FAQs)
1. What is the main purpose of a KPI dashboard in fertilizer manufacturing?
It helps organizations monitor operational performance, compare targets with actual results, and improve decision-making.
2. Do users need advanced Power BI skills to use this dashboard?
No. Users only update Excel data, and the dashboard refreshes automatically.
3. Can companies customize KPIs?
Yes. Organizations can modify KPI definitions based on operational requirements.
4. How often should data be updated?
Most companies update data monthly, although weekly updates also work.
5. What does LTB and UTB mean?
LTB means Lower the Better, while UTB means Upper the Better.
6. Can this dashboard track historical performance?
Yes. It compares current performance with previous-year data.
7. Is Excel required for this dashboard?
Yes. Excel works as the primary data source for Actual and Target inputs.
8. Who should use this dashboard?
Plant managers, analysts, executives, and operational teams benefit the most.
Visit our YouTube channel to learn step-by-step video tutorials