In today's fast-paced educational world, it’s crucial for institutions to track their student enrollment data efficiently. A Student Enrollment KPI
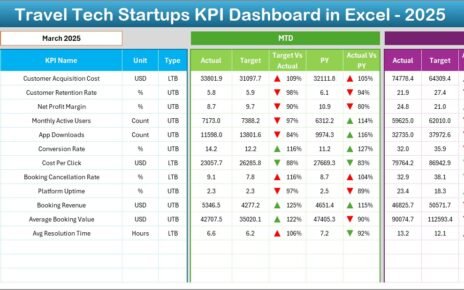
Travel tech startups operate in a fast-moving and highly competitive environment. While innovation drives success, data-driven decision-making sustains growth. However,
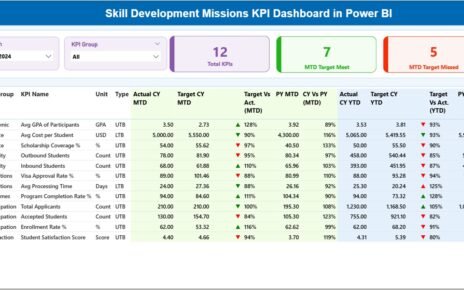
Skill development missions play a vital role in building a future-ready workforce. Governments, training institutions, and development agencies invest heavily