In today’s competitive market, tracking customer feedback has become more important than ever. Especially in finance and accounting, customer satisfaction directly impacts trust, loyalty, and ultimately business growth. To simplify the process, we have created a ready-to-use Finance and Accounting Customer Feedback KPI Dashboard in Excel.
In this article, you will learn everything about this powerful dashboard, including its key features, advantages, best practices, and answers to commonly asked questions.
Let’s dive right in!
Click to Purchases Finance and Accounting Customer Feedback KPI Dashboard in Excel
What is the Finance and Accounting Customer Feedback KPI Dashboard?
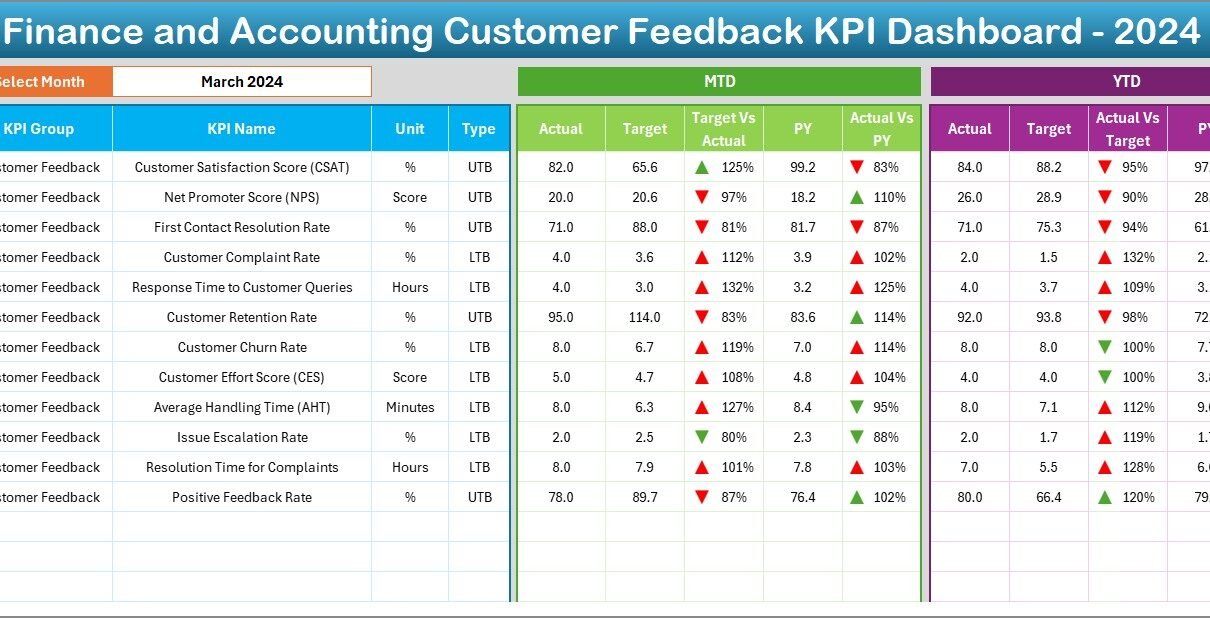
The Finance and Accounting Customer Feedback KPI Dashboard is a dynamic Excel-based template that helps finance teams easily monitor customer satisfaction. It tracks key performance indicators (KPIs) across different periods like Month-to-Date (MTD) and Year-to-Date (YTD), and compares actual performance against targets and previous year numbers.
This dashboard ensures that you can instantly visualize important trends, spot areas for improvement, and take actions that strengthen customer relationships.
Key Features of the Customer Feedback KPI Dashboard
We have designed this dashboard with a focus on usability, flexibility, and visual clarity. Let’s look at its major components:
Home Sheet
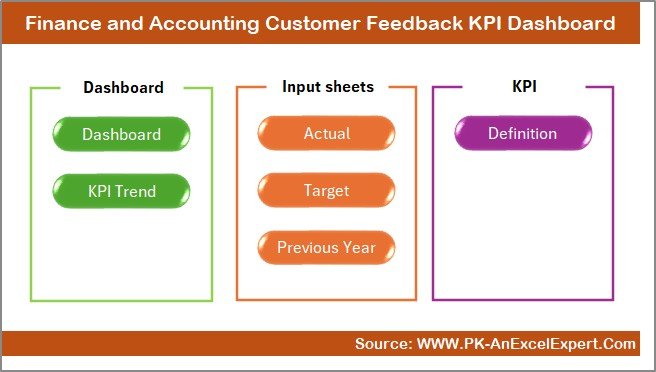
- Serves as the index page for the dashboard.
- Features six clickable buttons that take you quickly to other important sheets.
- Provides easy navigation, saving your time while working with the dashboard.
Dashboard Sheet Tab
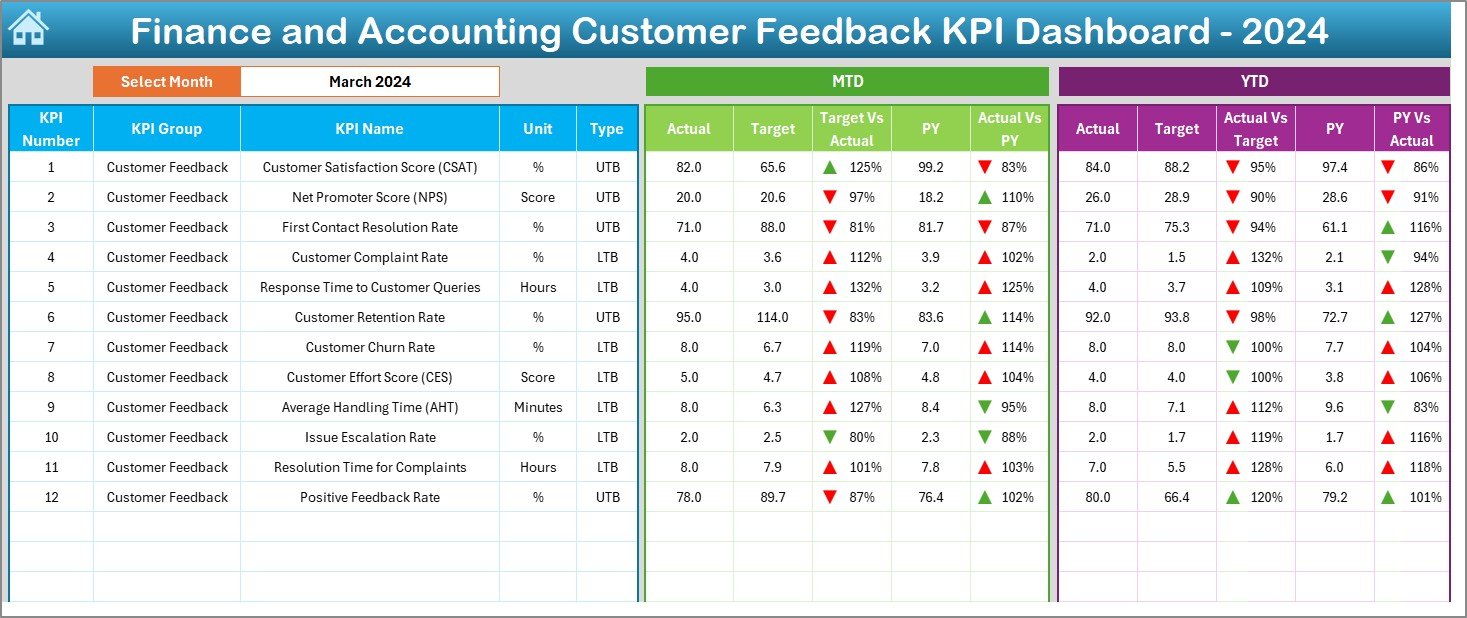
- This is the main sheet where all the magic happens.
- At cell D3, you can select the month using a simple dropdown menu.
- Once you pick a month, all KPIs automatically update to show that month’s MTD Actual, Target, and Previous Year values.
- You can also see YTD Actual, Target, and Previous Year values.
- Conditional formatting adds arrows to instantly indicate whether KPIs have improved or declined.
KPI Trend Sheet Tab
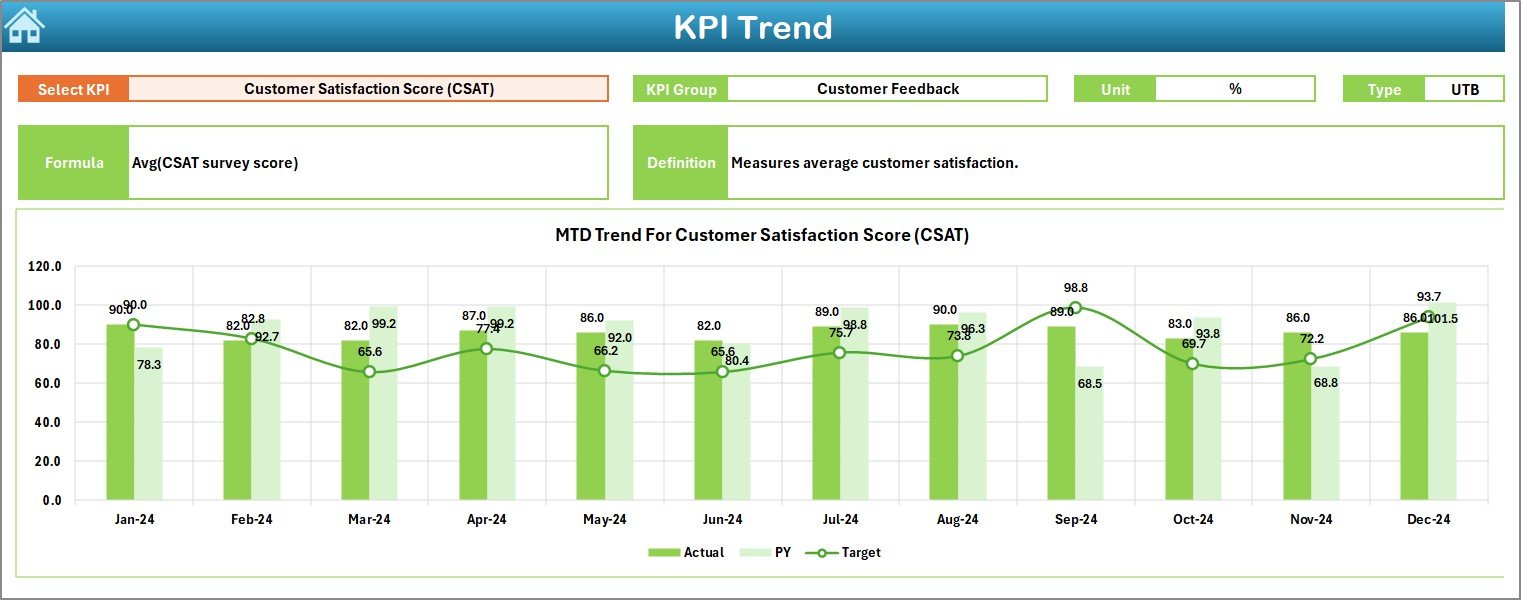
- Track the performance of a specific KPI using a dropdown at cell C3.
- Displays critical information like KPI Group, Unit, KPI Type (Lower The Better or Upper The Better), Formula, and Definition.
- View MTD and YTD trend charts for quick visual analysis.
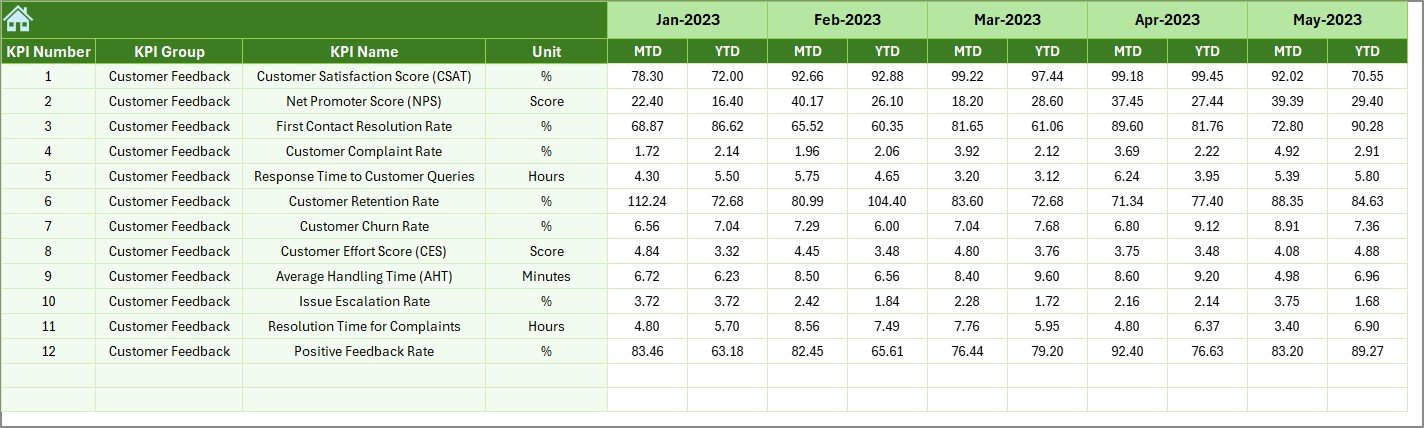
Actual Numbers Input Sheet
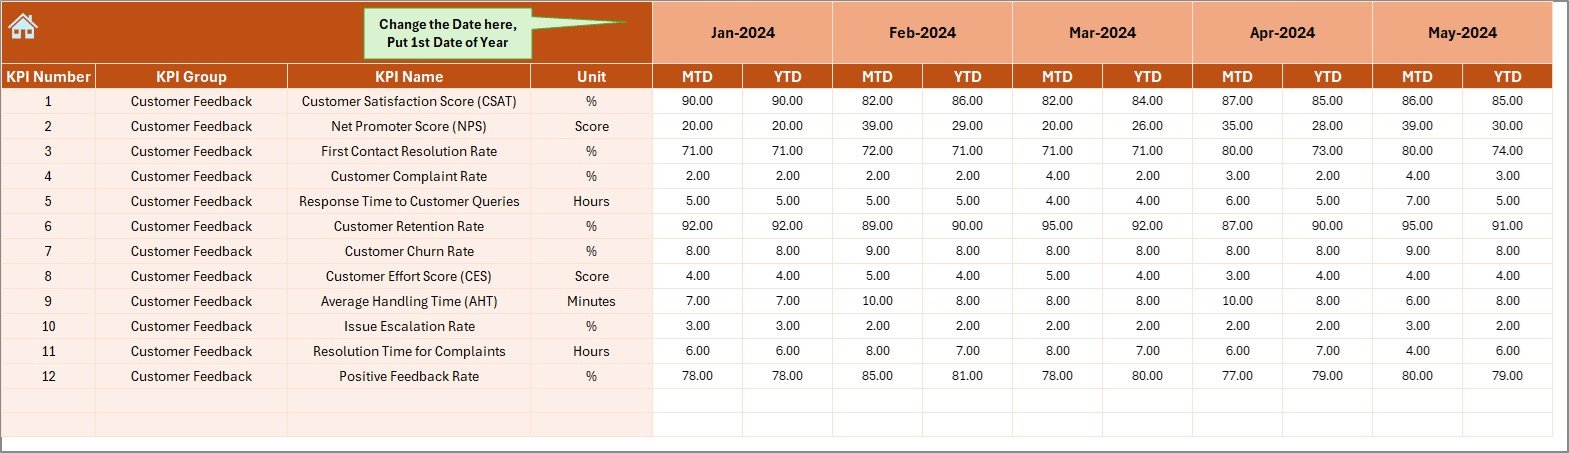
- Here you manually input the actual performance numbers.
- Select the starting month of the year in cell E1, and the template will handle the rest.
- Maintain accuracy by entering both MTD and YTD data for each KPI.
Target Sheet Tab
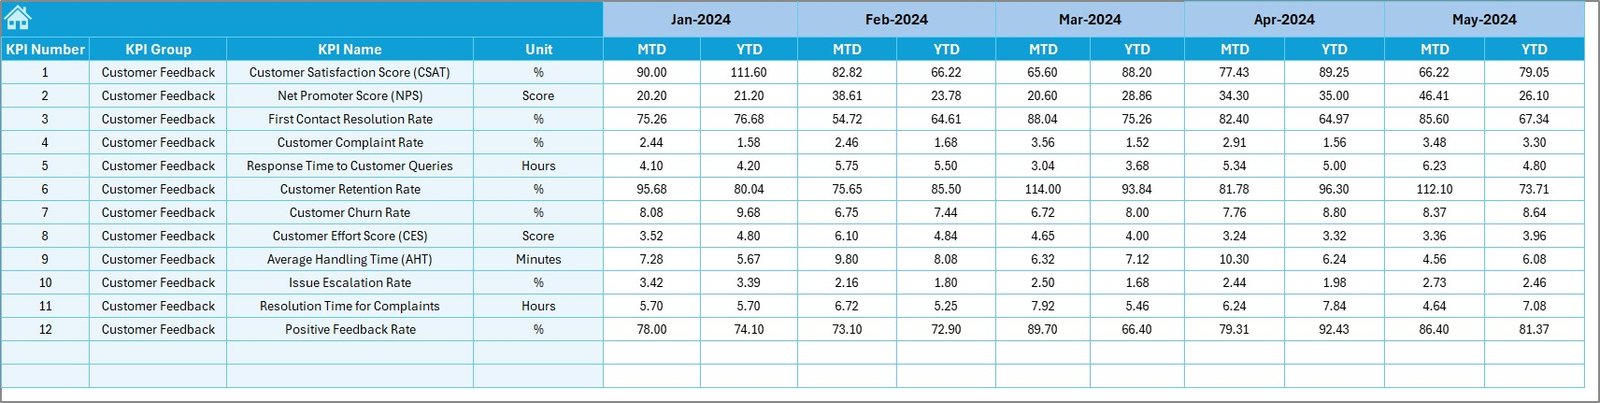
- Input target values for each KPI in this section.
- Helps you set monthly and yearly targets to measure progress accurately.
Previous Year Number Sheet Tab
- Record last year’s MTD and YTD performance data here.
- Enables a detailed comparison between current and previous performance.
KPI Definition Sheet Tab
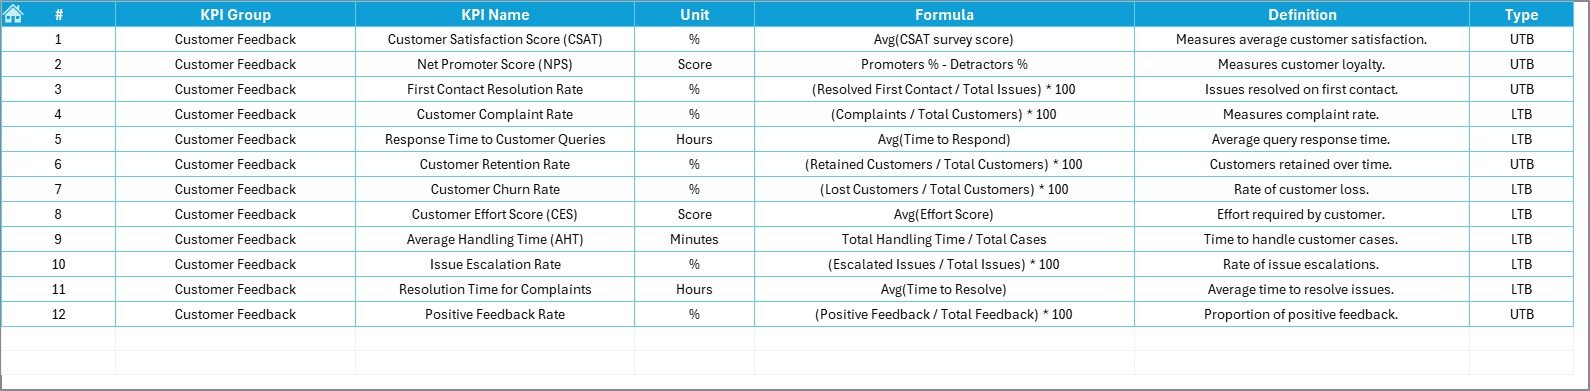
- Maintain a central database of all KPIs.
- Enter KPI Name, Group, Unit, Formula, and Definition for easy reference.
Why Use a Customer Feedback KPI Dashboard in Finance and Accounting?
Many businesses often track financial metrics but overlook customer feedback. However, satisfied customers are the foundation of any successful finance or accounting business. This dashboard makes it easy to quantify and improve customer satisfaction.
With this dashboard, you can:
- Track customer sentiment over time.
- Quickly identify problem areas.
- Enhance services based on real feedback.
- Improve overall client loyalty and retention.
Click to Purchases Finance and Accounting Customer Feedback KPI Dashboard in Excel
Advantages of the Finance and Accounting Customer Feedback KPI Dashboard
Now, let’s talk about why this dashboard is a must-have:
📊 Instant Insights
You can see real-time updates whenever you input new data. It saves you from digging through endless reports.
🔄 Easy Month-to-Month Comparison
Switch months in just one click using the dropdown, and the entire dashboard updates automatically.
🚀 Quick Trend Analysis
With built-in charts for every KPI, you can easily spot positive or negative trends without manual effort.
🎯 Focused Decision Making
Clear visualizations and KPI arrows guide you in making quick, data-driven decisions.
✍️ Customization Flexibility
You can easily edit KPIs, targets, or months without needing any advanced Excel skills.
Best Practices for Using the Customer Feedback KPI Dashboard
To make the most out of this dashboard, follow these simple best practices:
Update Regularly
Always input actual numbers as soon as the month ends. Fresh data ensures your insights are reliable.
Set Realistic Targets
Base your monthly and yearly targets on historical data and achievable goals.
Monitor Trends Consistently
Don’t wait for issues to pile up. Analyze the KPI trends every month and act promptly.
Customize KPIs
If needed, add or remove KPIs depending on your business priorities. The dashboard is flexible enough to adapt.
Involve Your Team
Share the dashboard with your finance and customer support teams. Collaborative use leads to faster problem-solving.
How to Set Up the Finance and Accounting Customer Feedback KPI Dashboard?
Setting up the dashboard is easy if you follow these steps:
Step 1: Enter the Starting Month
Go to the Actual Numbers Input Sheet and select the starting month in cell E1.
Step 2: Input Actual Data
Enter MTD and YTD actuals every month after collecting customer feedback.
Step 3: Set Your Targets
On the Target Sheet, input the MTD and YTD target numbers for every KPI.
Step 4: Add Previous Year’s Data
In the Previous Year Number Sheet, fill in last year’s actual values for comparison.
Step 5: Customize Your KPI List
If you want to add or modify KPIs, edit the KPI Definition Sheet.
Step 6: Start Monitoring
Use the Dashboard Sheet and KPI Trend Sheet to track progress month after month.
How Does This Dashboard Help Improve Customer Experience?
When you track feedback KPIs regularly, you can:
- Respond faster to customer complaints.
- Understand what aspects customers value most.
- Adjust service delivery to meet evolving expectations.
- Build stronger relationships based on trust and responsiveness.
As a result, you not only retain customers but also attract more through positive word-of-mouth.
Common KPIs You Can Track Using This Dashboard
Here are some popular customer feedback KPIs that you can include:
- Net Promoter Score (NPS): Measures customer loyalty.
- Customer Satisfaction Score (CSAT): Indicates satisfaction after transactions.
- First Contact Resolution Rate: How often customer issues are resolved on the first interaction.
- Customer Retention Rate: Tracks how many customers stay over time.
- Customer Effort Score (CES): Measures the effort customers put in to get their issues resolved.
- Average Response Time: Time taken to respond to customer queries.
- Complaint Resolution Time: How quickly customer complaints are resolved.
Conclusion
The Finance and Accounting Customer Feedback KPI Dashboard in Excel is an essential tool for any business serious about customer satisfaction. By tracking the right KPIs and acting on the insights, you can improve services, delight your customers, and boost your financial performance.
Using this dashboard will not only help you measure your current standing but will also guide you toward long-term success. So why wait? Start using it today and experience the difference!
Frequently Asked Questions (FAQs)
What is the purpose of the Customer Feedback KPI Dashboard?
The dashboard helps you track customer satisfaction KPIs in finance and accounting, providing quick insights for better decision-making.
Can I customize the KPIs in the dashboard?
Yes! You can easily add, modify, or remove KPIs based on your business needs by updating the KPI Definition Sheet.
How often should I update the dashboard?
Ideally, you should update it monthly after collecting and analyzing customer feedback data.
Is it difficult to use the dashboard if I am not an Excel expert?
Not at all. The dashboard is user-friendly, and basic Excel knowledge is enough to use it effectively.
Can I compare current performance with previous years using this dashboard?
Yes! The dashboard has a dedicated sheet for entering previous year’s data, making year-over-year comparisons simple and quick.
What happens if I change the starting month?
Changing the starting month in the input sheet automatically updates the entire dashboard accordingly.
Is this dashboard suitable for small businesses too?
Absolutely! Whether you run a large firm or a small business, this dashboard helps you manage customer feedback efficiently.
Click to Purchases Finance and Accounting Customer Feedback KPI Dashboard in Excel
Visit our YouTube channel to learn step-by-step video tutorials
Watch the step-by-step video Demo: