The global fisheries industry is a vital source of food, income, and economic growth. However, managing operations efficiently—from catch volumes to resource utilization—requires reliable data insights. That’s why an Excel-based Fisheries KPI Dashboard is a game-changer for fisheries managers, aquaculture farms, and government departments.
With this dashboard, users can measure, track, and visualize key performance indicators (KPIs) that impact sustainability, profitability, and productivity — all within Microsoft Excel’s familiar environment.
In this detailed article, we’ll explore what a Fisheries KPI Dashboard is, how it’s structured, and how you can use it to monitor performance effectively.
Click to Purchases Fisheries KPI Dashboard in Excel
What Is a Fisheries KPI Dashboard in Excel?
A Fisheries KPI Dashboard in Excel is a performance management tool designed to help fisheries and aquaculture operators monitor critical business metrics. It consolidates data from operations, harvest, and supply into one centralized, interactive Excel file.
Users can analyze Month-to-Date (MTD) and Year-to-Date (YTD) results, compare them with targets or previous years, and visualize trends using charts and color-coded indicators.
This ready-to-use Excel template eliminates the need for complex software, offering a straightforward way to track performance and make data-driven decisions.
Click to Purchases Fisheries KPI Dashboard in Excel
Dashboard Structure Overview
The Fisheries KPI Dashboard includes seven interconnected worksheets, each serving a unique purpose in tracking and reporting performance.
1️⃣ Home Sheet
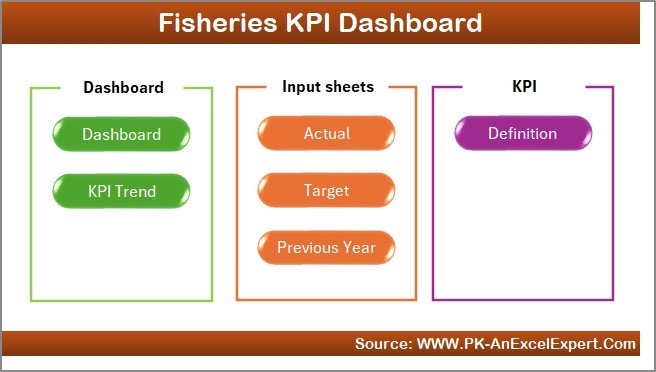
The Home sheet serves as the control center of the workbook.
It includes six navigation buttons that allow users to jump directly to specific sheets such as the Dashboard, KPI Trend, and Input sheets.
This layout simplifies user navigation, ensuring that even beginners can easily switch between pages without scrolling or searching manually.
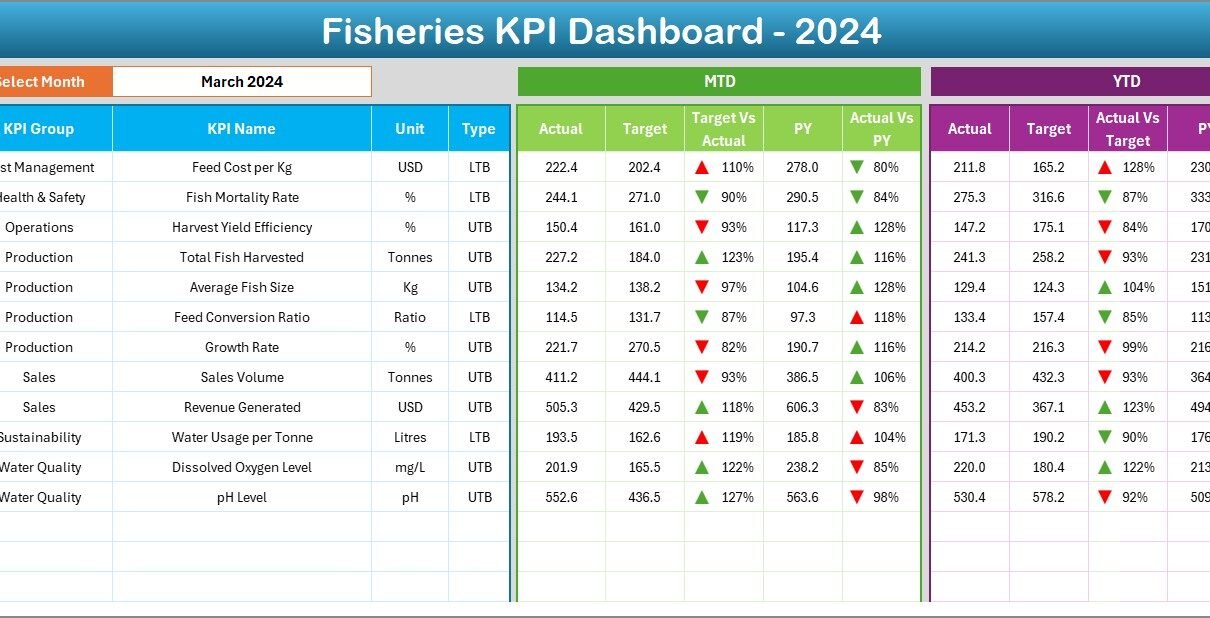
2️⃣ Dashboard Sheet Tab
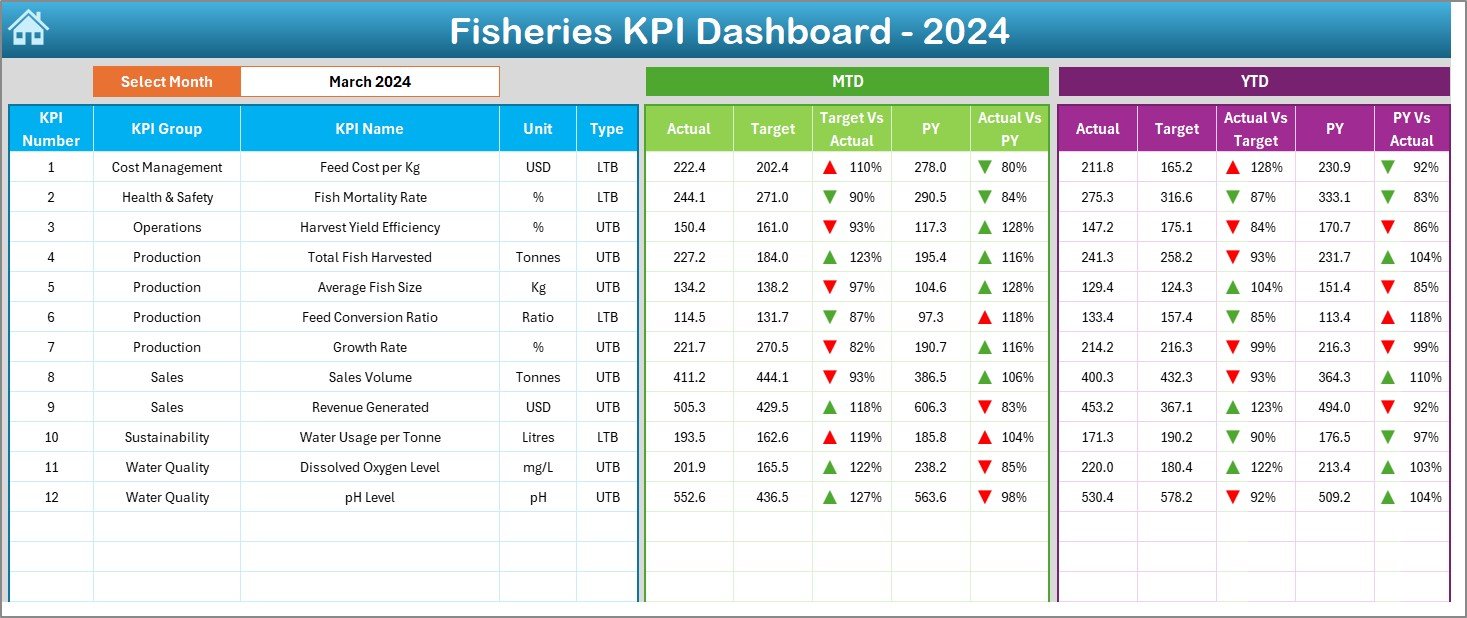
The Dashboard sheet is the main visualization hub where all KPIs are displayed.
In cell D3, you’ll find a Month selector drop-down. When you choose a month, all dashboard metrics automatically refresh to show the corresponding data.
Data Displayed
-
MTD (Month-to-Date): Actual, Target, and Previous Year numbers
-
YTD (Year-to-Date): Actual, Target, and Previous Year numbers
-
Target vs Actual (%) and PY vs Actual (%) comparisons
Each metric includes conditional formatting arrows:
-
🔼 Green arrow for improvement
-
🔽 Red arrow for decline
These visual indicators make it easy to see at a glance which KPIs are performing well and which need attention.
Common KPIs Displayed
-
Total Catch Volume (Tons)
-
Catch per Vessel (kg/day)
-
Average Size of Fish (cm)
-
Fuel Consumption per Ton Caught (L/Ton)
-
Equipment Downtime (Hours)
-
On-Time Shipment Rate (%)
-
Fish Mortality Rate (%)
-
Feed Conversion Ratio (FCR)
-
Processing Yield (%)
-
Revenue per Ton (USD)
This page provides a complete monthly and yearly snapshot of performance.
Click to Purchases Fisheries KPI Dashboard in Excel
3️⃣ KPI Trend Sheet Tab
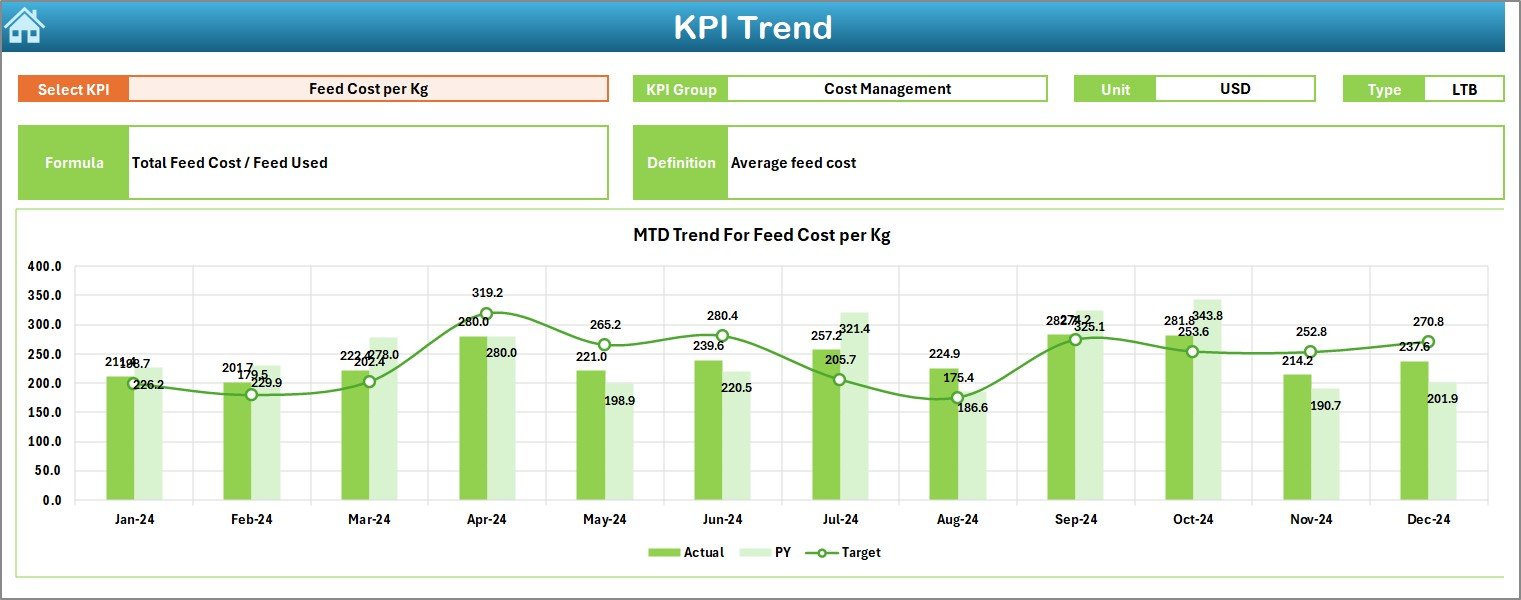
The KPI Trend sheet is designed for deeper insights.
Users can select a specific KPI name from the drop-down in cell C3, and the sheet updates automatically to show that KPI’s performance trends.
Details Displayed
-
KPI Group (e.g., Production, Quality, Logistics)
-
Unit of KPI (%, tons, USD, etc.)
-
Type of KPI — UTB (Upper the Better) or LTB (Lower the Better)
-
Formula of KPI — the calculation logic
-
Definition — short explanation of what the KPI measures
Below these details, the dashboard displays MTD and YTD trend charts comparing:
-
Actual values
-
Target values
-
Previous Year (PY) values
This allows users to visualize performance progression over time and quickly identify upward or downward trends.
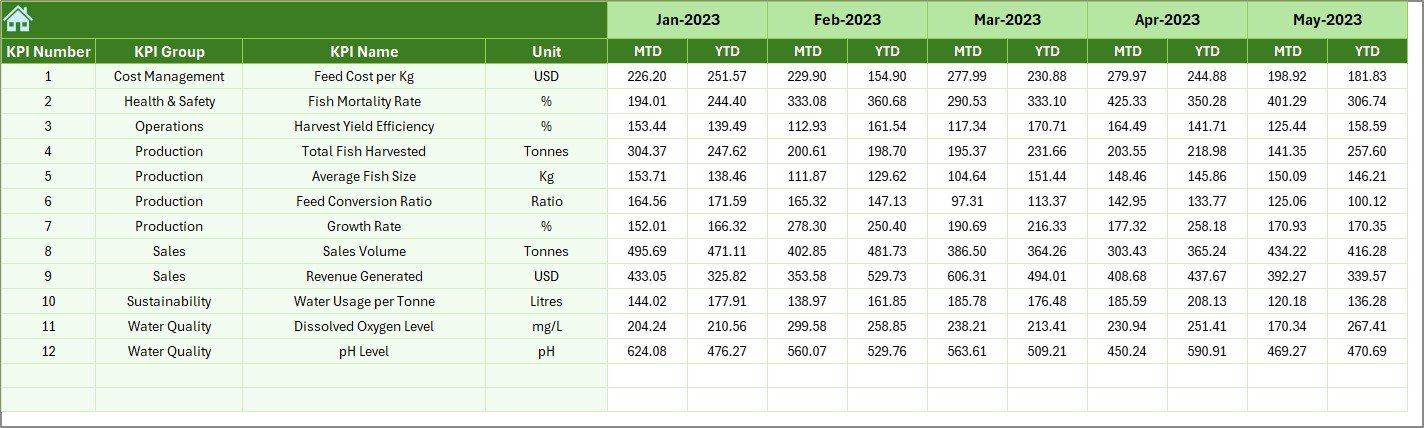
4️⃣ Actual Numbers Input Sheet
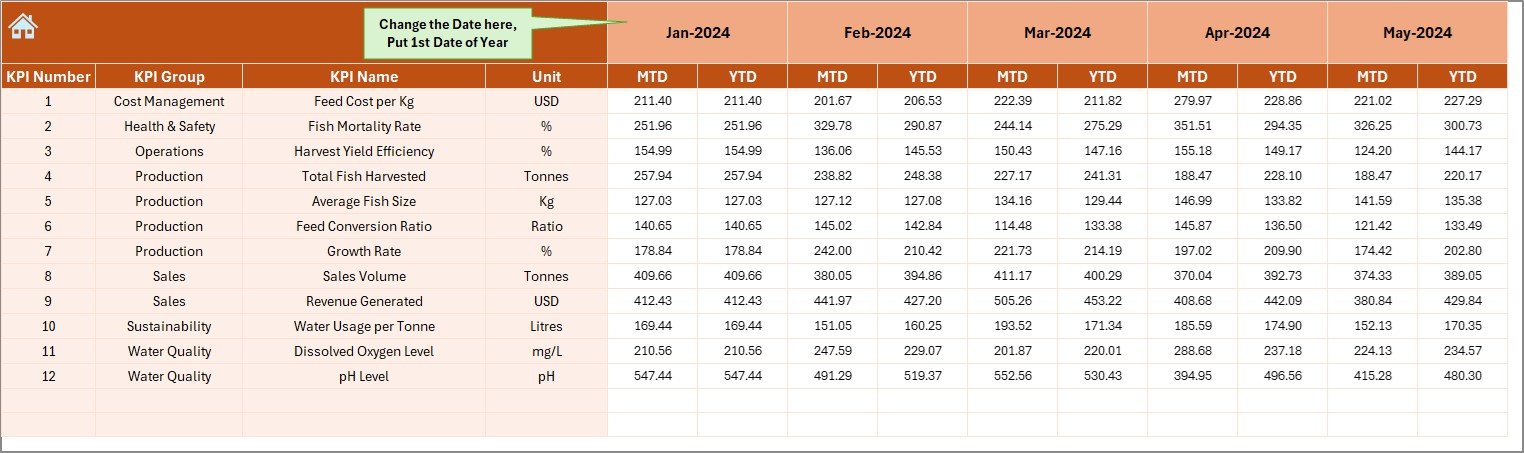
The Actual Numbers Input sheet is where you enter real operational data.
Each row represents one KPI for a specific month, with columns for both MTD and YTD values.
At the top of the sheet, in cell E1, you’ll find a month reference — enter the first month of the year here (e.g., January 2024). This helps the formulas align all subsequent data correctly.
This sheet ensures that all data feeding the dashboard is accurate and organized.
5️⃣ Target Sheet Tab
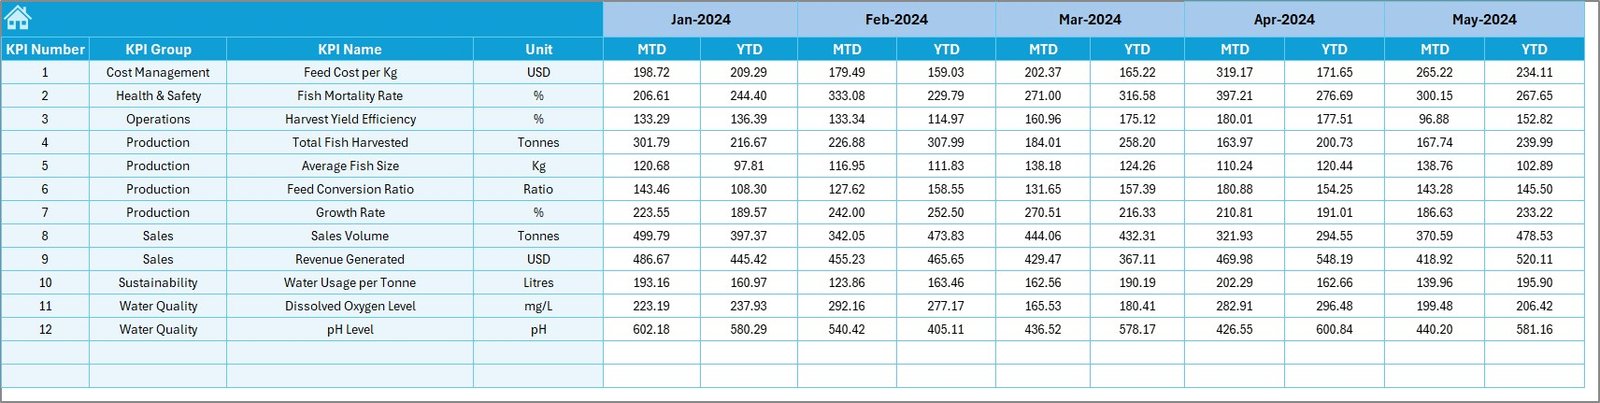
In the Target Sheet, users input monthly and yearly targets for each KPI.
The structure mirrors the Actual Numbers Input sheet, allowing for easy comparison.
By defining realistic targets here, you can benchmark your performance effectively.
6️⃣ Previous Year Number Sheet Tab
This sheet holds last year’s KPI figures, again structured similarly to the Actual and Target sheets.
By comparing Current Year vs Previous Year data, users can monitor improvements, spot inefficiencies, and evaluate long-term trends.
7️⃣ KPI Definition Sheet Tab
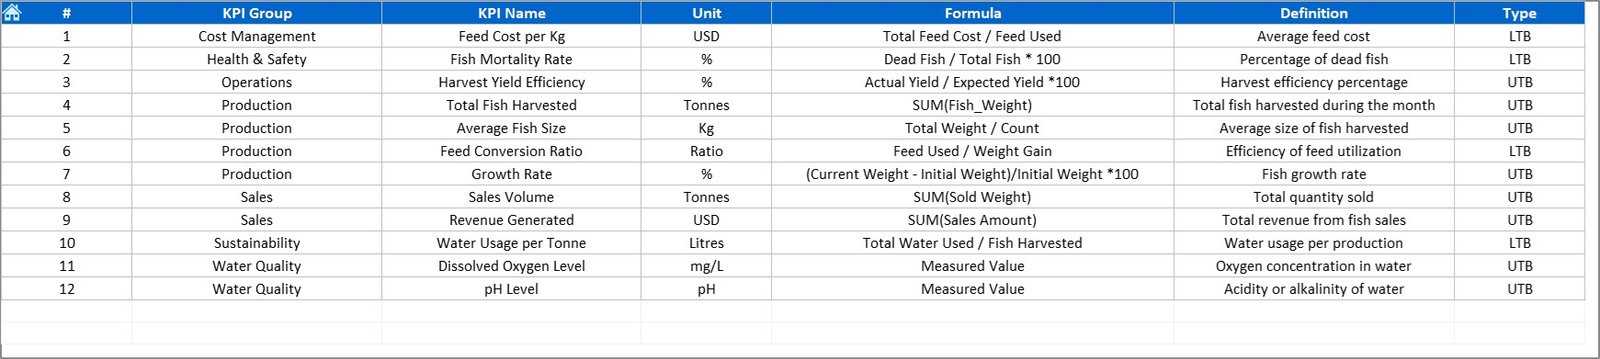
The KPI Definition sheet serves as your KPI reference library.
It includes the following columns:
-
KPI Name
-
KPI Group
-
Unit
-
Formula
-
Definition
This sheet ensures consistency and transparency. When new team members use the dashboard, they can easily understand what each KPI measures and how it’s calculated.
Click to Purchases Fisheries KPI Dashboard in Excel
How the Fisheries KPI Dashboard Works
Here’s how the entire workflow operates:
-
Data Entry: Enter Actual, Target, and Previous Year data in their respective sheets.
-
Month Selection: Choose the desired month in the Dashboard sheet (cell D3).
-
Automatic Update: Excel formulas and lookups refresh all MTD and YTD numbers.
-
Conditional Formatting: Arrows and color coding highlight performance trends.
-
Analysis: Use the KPI Trend sheet to deep-dive into any specific KPI.
This simple yet powerful process transforms raw data into visual insights.
Why Every Fishery Needs This Dashboard
Managing fisheries operations involves complex factors like catch volume, environmental conditions, fuel costs, and sustainability targets. Using an Excel KPI dashboard brings all of these together into one streamlined view.
Here’s why it’s essential:
-
✅ Centralized Data Control: All KPI data lives in one workbook.
-
✅ Instant Performance Tracking: Quickly identify which metrics are improving.
-
✅ Customizable Framework: Add or modify KPIs anytime.
-
✅ No Software Dependency: Works entirely in Excel.
-
✅ Better Decision-Making: Turns complex data into actionable insights.
Advantages of Fisheries KPI Dashboard in Excel
1️⃣ Easy to Use
The dashboard uses Excel’s familiar interface, so anyone with basic spreadsheet knowledge can operate it.
2️⃣ Real-Time Insights
As soon as you update the input sheets, all dashboards and charts reflect the new data instantly.
3️⃣ Visual Clarity
Arrows, color codes, and charts make it easy to interpret performance at a glance.
4️⃣ Historical Comparison
The inclusion of previous year data allows year-on-year analysis.
5️⃣ Customization
You can expand KPI lists, adjust targets, or modify charts to fit your operational needs.
6️⃣ Data-Driven Decisions
The dashboard enables managers to focus on what truly drives results — efficiency, quality, and sustainability.
Click to Purchases Fisheries KPI Dashboard in Excel
Best Practices for the Fisheries KPI Dashboard
Follow these best practices to get maximum benefit:
1️⃣ Keep Data Consistent
Ensure all input data uses uniform units and formats (e.g., tons, liters, percentages).
2️⃣ Automate Monthly Updates
Use Excel formulas or Power Query to link data directly from your operational sheets or ERP systems.
3️⃣ Validate KPIs Quarterly
Review KPI definitions and targets every few months to align with business changes or environmental shifts.
4️⃣ Simplify Visualization
Avoid overcrowding charts — focus on clarity and interpretability.
5️⃣ Protect Data Integrity
Lock calculation cells and protect key formulas to prevent accidental changes.
6️⃣ Share Insights Regularly
Export dashboard snapshots for management reviews or sustainability reports.
How to Customize the Dashboard
You can easily tailor the dashboard to your specific fishery:
-
Add new KPIs in the KPI Definition sheet.
-
Modify chart ranges in the KPI Trend sheet.
-
Update conditional formatting thresholds.
-
Integrate Power Query for automatic data import.
-
Add macros for monthly report generation.
This flexibility makes it useful for both small fisheries and large aquaculture enterprises.
Conclusion
The Fisheries KPI Dashboard in Excel is more than a reporting tool — it’s a complete performance management system. It provides an easy, affordable, and effective way to monitor every aspect of your operations, from production to sustainability.
By leveraging this dashboard, fisheries can track MTD and YTD performance, evaluate progress against targets, and ensure continuous improvement. In a data-driven era, this Excel solution helps you stay ahead — efficiently and sustainably.
Click to Purchases Fisheries KPI Dashboard in Excel
Frequently Asked Questions (FAQs)
1️⃣ What is the purpose of a Fisheries KPI Dashboard?
It helps fisheries monitor operational, financial, and environmental KPIs in one interactive Excel file.
2️⃣ How often should I update the data?
Monthly updates are recommended to keep MTD and YTD figures accurate and actionable.
3️⃣ Can I customize the KPIs?
Yes. You can add, remove, or modify KPIs easily through the KPI Definition sheet.
4️⃣ Do I need Excel expertise to use it?
No. The dashboard is beginner-friendly and comes with automated formulas and buttons for easy use.
5️⃣ What kind of analysis can I do?
You can compare Actual vs Target, Current Year vs Previous Year, and view MTD/YTD trends for each KPI.
6️⃣ Can this dashboard help with sustainability tracking?
Yes. It can include KPIs related to environmental impact, waste reduction, and resource efficiency.
7️⃣ Is it compatible with all Excel versions?
Yes, it works seamlessly in Excel 2016 and later versions, including Microsoft 365.
Click to Purchases Fisheries KPI Dashboard in Excel
Visit our YouTube channel to learn step-by-step video tutorials